Statistics
in focus
Income poverty in the
European Union: Children,
gender and poverty gaps
Lene Mejer (Eurostat) and
Clemens Siermann (Statistics Netherlands)
POPULATION AND
SOCIAL CONDITIONS
4
THEME 3-12/2000
POPULATION AND LIVING
CONDITIONS
Contents
Income poverty and children ...2
Income poverty and gender
3
Poverty gap
5
* * *
*
*
*
*
* * *
■ 1 ^
eure
»stat
Jr
Manuscript completed on: 06.06.2000
ISSN 1024-4352
Catalogue number: CA-NK-OO-012-EN-C
Price in Luxembourg per single copy
(excl.VAT):EUR6
© European Communities, 2000
This Statistics in Focus was carried out jointly by Eurostat and Statistics
Netherlands. Based on the 1996 wave of the European Community
Household Panel (ECHP), it analyses income poverty from the point of view
of children, gender differentials and how poor persons with a low-income are.
The information presented in this Statistics in Focus forms part of a bigger
Eurostat report on income poverty and social exclusion in the Member States
of the European Union which is being prepared for publication by autumn
2000.
Children in the European Union run an above average income poverty risk
compared to adults. In 1996, 2 1 % of all children in the European Union lived
in a low-income household, whereas only 16% of adults were in the same
position.
Almost half of all children living in single parent households (46%) lived in
income poverty. Compared to other children, children in a single-parent
household were more than twice as likely to live in a low-income household.
Similarly, poverty rates of children belonging to unemployed or inactive
households are more than 60% in the European Union.
Within all age groups, women were always at a greater risk of being in
income poverty than men within the European Union. In 1996, 18 per cent of
all women lived in a low-income household compared to 16 per cent of all
men.
Single women have higher poverty rates than single men (25% against 19%),
but the relative difference between men and women becomes larger when
they are working (16% against 10%). Controlling for education, it appears,
that whereas income poverty for high educated single women and men is
equally low (7%), the middle to low educated single women have
substantially higher poverty rates than men with similar educational level.
The poverty gap measures the distance between the value of the poverty line
and the average income of those living in income poverty. Hence, measuring
this gap gives an insight into the severity of income poverty.
Income poverty and children
One out of every five children living in income
poverty
Children in the European Union run an above average
income poverty risk, but not every child is equally
threatened by poverty. In 1996, 21 per cent of all
children in the European Union lived in a low-income
household. These were 16.9 million children below the
age of 18 living in 7.9 million low-income households
across 13 Member States. More than one in every five
(23 per cent) of these children lived in a single-parent
household.
Figure 1: Share of children below 18 by household type in the European Union, 1996
single parent
couple + 1
couple + 2
couple + 3 or couple + dep.
other
dependent
dependent
more dep.
& non dep.
child
children
Children
Children
Source: ECHP, wave 3 (Finland and Sweden excluded)
Example: 23% of children living in income poverty in the European Union live in single parent households
Looking at poverty rates, this means that almost half of
all children in a single-parent household lived in income
poverty. Compared to other children, children in a
single-parent household were more than twice as likely
to live in a low-income household.
Besides children in single-parent households, children
living in large households (a couple with 3 or more
dependent children) also run a poverty risk above the
European Union average. Of all children in large
households, one out of four lived in low-income
households. For children in households consisting of a
couple with one dependent child and children in
households consisting of a couple with two dependent
children, the income poverty rate was 10 and 14 per
cent, respectively.
Figure 2: Income poverty rate of dependent children 1) in the European Union by household type, 1996
% so
Total
Single parent
Couple + 1
Couple + 2
Couple + 3 or
Couple + dep.
dependent child
dependent
more dep.
& non dep.
children
children
children
1) Dependent children are below 18 years old.
Source: ECHP, 1996 (Finland and Sweden excluded).
Example: 46% of children in single parent households live in income poverty
Statistics in focus
— Theme 3 — 12/2000 ■
The poverty rates of children belonging to
unemployed or inactive households are more than
60% in the European Union
The poverty risk of a child is determined by his or her
household situation. For instance, a child that lives in a
working household is far less likely to be threatened by
income poverty than a child living in an unemployed,
retired or other inactive household.
In 1996, the majority of all poor children (69 per cent)
lived in a working household. Compared to 90 per cent
of all children living in such households, this indicates
that children in a working household have a
comparatively low risk of being poor. Almost one third
(31 per cent) of all poor children lived in a non-working
household. Among all 81.3 million children below the
age of 18 this was 10 percent.
Relatively more Luxembourg, Irish and British
children live in income poverty compared to other
EU Member States
[image:3.595.40.554.419.550.2]Children are not equally threatened by income poverty
in all Member States. In the great majority of countries
children run a poverty risk which is higher than that of
adults. However, there are some exceptions. In
Denmark, children under the age of 18 were far less
Table 1: Income poverty of dependent children
v
in the
European Union by labour market situation of the
household, 1996
Total
Total %
Working
Unemployed
Retired
Inactive
100
90
4
1
5
Low income
100
69
13
2
16
Poverty rate
21
16
65
38
68
v
Dependent children: below 18 years old
Source: ECHP, wave 3 (Finland and Sweden excluded)
Example: In the total population, 90% of dependent children live in
a working household, in low-income households this is 69%. 16%
of all children living in a working household, live in a low-income
household.
likely to be found in a low-income household than the
average adult Danish citizen. Their poverty risk was less
than half the average Danish poverty risk. Also in
Greece, children below the age of 18 had a poverty risk
below the average. At the other extreme, children in
Luxembourg, Ireland and the United Kingdom were
almost 50% more likely to live in a low-income
household.
Figure 3: Relative poverty risk of children (age < 18) in the European Union, 1996 (100=country specific poverty
rate of persons aged 18 or above)
lillllllhll
Source: ECHP, wave 3 (Finland and Sweden excluded)
Example: In Belgium, the nsk of children living in a low income household is 25% higher than that for adults.
Income poverty and gender
Women always at a greater risk of being in income
poverty than men
Within all age groups, women were always at a greater
risk of being in income poverty than men within the
European Union. In 1996, 18 per cent of all women lived
in a low-income household compared to 16 per cent of
all men. However, the difference in income poverty
rates between the sexes depends on age. The gender
differences in income poverty are largest within the age
groups of 18-24 years old* and of 65 years or older. Of
all women in the latter age group, one in five (20 per
cent) lived in a low-income household against just below
one in every six (16 per cent) elderly men (see Table 3).
*
Note: In the age group 18-24 years there are a large number of persons who are ¡n full-time education. Such persons would in some Member States live
mainly or partly from student loans and/or income in kind transferred from parents/family. Loans and income in kind are not part of the income concept used
in this study and thus the poverty rate for persons in full time education may be overestimated.
m
eurostat
Single women have higher poverty risk than single
men
With regard to type of household, the greatest
difference in poverty rates between the sexes was
found for single persons. In 1996, the poverty risk for
single women aged below 65 was 29 per cent higher
than for single men. The difference was even larger
[image:4.595.43.476.185.364.2]among working singles (i.e. 55 per cent). However, the
latter result depends on the level of education.
High-educated, single female workers had the same poverty
rate as men with similar education and labour market
situation. On the other hand, middle- or low-educated
single female workers were 50% more likely to be in a
low-income household than men with those
characteristics.
Table 2: Poverty rates of women and men by household type in the European Union, 1996 (%)
Type of household
single below age 65
single age 65 or more
Working single person below age 65
education level of the household
high
middle
low
total
male
19
20
male
7
10
12
total
female
25
27
female
7
16
21
working
male
10
-working
female
16
-Source: ECHP, wave 3 (Finland and Sweden excluded)
Example: 16% of working single women below 65 of age live in income poverty, for the same group of men this is 10%. The
relative risk is thus more than 50% higher (155) for women in this group of being in income poverty compared to men.
Controlling for level of education, 21% of low educated single working women below 65 of age live in income poverty, for the
same group of men this is 12%. The relative hsk for women in this group is thus 74% higher compared to men.
Member State specific poverty risks differ
Although In the great majority of countries women were
more at risk of poverty than men, the importance of the
difference diverges. In the age groups 45-54 and 55-64
there are only very slight differences between the
poverty rates of women and men in Denmark, Germany,
Spain, Ireland, Italy, and they go in both directions.
Although elderly women (aged 65 or older) in most
countries have a significantly higher poverty risk than
men (notably in Ireland), in Spain and the Netherlands
they run a slightly lower poverty risk than men in this
age group.
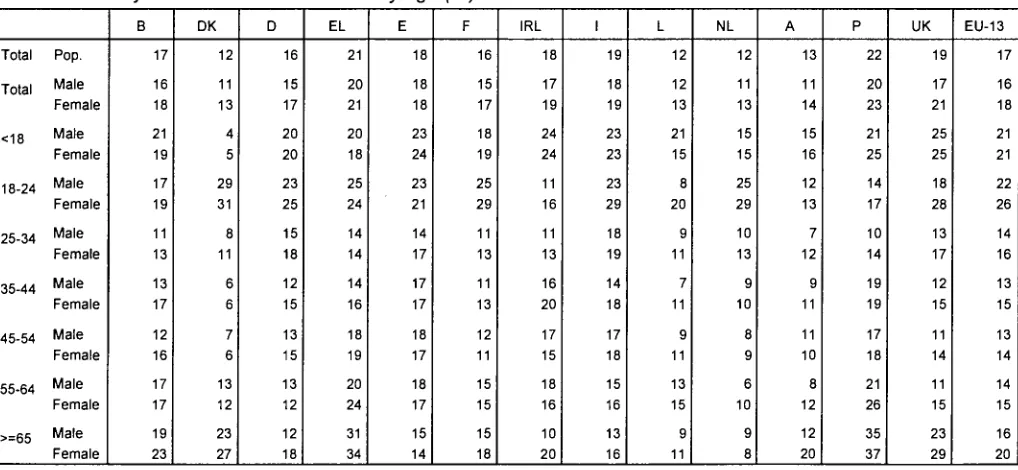
Table 3: Poverty rates of men and
Total Pop.
Total
M a l eFemale
<18
M a l eFemale
18-24
M a l eFemale
25-34
M a l eFemale
35-44 Male
Female
45-54
M a l eFemale
55-64
M a l eFemale
>=65
M a l eFemale
Β
17
16
18
21
19
17
19
11
13
13
17
12
16
17
17
19
23
DK
12
11
13
4
5
29
31
8
11
6
6
7
6
13
12
23
27
D
16
15
17
20
20
23
25
15
18
12
15
13
15
13
12
12
18
women by age (%)
EL
21
20
21
20
18
25
24
14
14
14
16
18
19
20
24
31
34
E
18
18
18
23
24
23
21
14
17
17
17
18
17
18
17
15
14
F
16
15
17
18
19
25
29
11
13
11
13
12
11
15
15
15
18
IRL
18
17
19
24
24
11
16
11
13
16
20
17
15
18
16
10
20
I
19
18
19
23
23
23
29
18
19
14
18
17
18
15
16
13
16
L
12
12
13
21
15
8
20
9
11
7
11
9
11
13
15
9
11
NL
12
11
13
15
15
25
29
10
13
9
10
8
9
6
10
9
8
A
13
11
14
15
16
12
13
7
12
9
11
11
10
8
12
12
20
Ρ
22
20
23
21
25
14
17
10
14
19
19
17
18
21
26
35
37
UK
19
17
21
25
25
18
28
13
17
12
15
11
14
11
15
23
29
EU-13
17
16
18
21
21
22
26
14
16
13
15
13
14
14
15
16
20
Source: ECHP, wave 3 (Finland and Sweden excluded)
Example: Of all women aged 65 or more in Ireland, 20% live in income poverty, formen in the same group this is 10%.
Statistics in focus
— Theme 3 — 12/2000
[image:4.595.45.554.532.767.2]Poverty gap
In 1996, 61.1 million persons in the European Union
had an income below their country specific poverty line.
Having an income below the poverty line identified one
as being in income poverty, but did not show how
severe this poverty was. The poverty gap is defined as
the extra income necessary to bring the equivalised
household income of a person under the poverty line,
level with the income at the poverty line. Measuring this
gap between income and the poverty line provides an
insight into the severity of income poverty*.
The European mean poverty gap is 30%
[image:5.595.50.512.280.403.2]In 1996, persons living in a low-income household in the
European Union had an equivalised household income
that was 30 per cent below the EU weighted average
poverty line. With an average poverty line of 6,400 PPS
in the European Union, this amounts to a mean
equivalised poverty gap of roughly 2,000 PPS.
Figure 4: Relative poverty gap of persons, 1996
Across the 13 Member States the gap between
equivalised household income and the poverty line
ranged from below 25 per cent in Ireland and
Luxembourg to over 35 per cent of the income at the
poverty line in Italy. Taking into account the various
poverty lines, the mean poverty gap in the 13 Member
States ranged from a little under 1,300 PPS in Ireland to
over 2,500 PPS in Germany and Luxembourg.
Source: ECHP, wave 3 (Finland and Sweden excluded)
Example: The equivalised mean income of persons in income poverty in Gemnany is 34% below the poverty line.
In comparison to other age groups, young adults living
in a low-income household had the largest poverty gap
in the European Union. In 1996, the gap between
equivalised household income and the poverty line was
32 per cent for persons in the age group 18-24.
Between the age of 25 and 64, the poverty gap is stable
Figure 5: Relative poverty gap by age and sex, 1996
around 30-31%. For persons aged 65 or older the gap
between the equivalised mean income and the poverty
line was 27 per cent on average. Elderly have a lower
poverty gap due to the fact that most receive at least a
state pension. Between the sexes there were no
significant differences in the level of the poverty gap.
Source: ECHP, wave 3 (Finland and Sweden excluded)
Example: The equivalised mean income of persons aged 65 or more in income poverty is 27% below the poverty line.
*The results should be treated with caution as the income information for those at the very bottom of the income distribution, that is those
with the largest gaps, is of potentially low reliability.
[image:5.595.51.508.537.690.2]_ _ _ _ _ _
_ _ _ _ _ _ _ _ _ _ _ _
. _ _ _ _ _ ,
.
iät would It cost to bring all households out of poverty?
mmmm,
pyerty.gap i^.'-ciefinëdi.îh.t§^8
%¿c^;^ívalenyncpmes. This enables à
:.compan
:tón.:b>tw^
in
^'-^j^j&^Tents^^^^^^is^âii,
However, it does
not.
"answej
^the^ciuiaetJorSf
yv^a^ViK^jta
ΑΆsd5
à-ìò^^n^
!*'Uip:
put óf.poverty, given the present, poyèrty.lirie?
vÓnly ín"the spedai case of. ai .singlétpèrsori. hpusehòid does'the
3 answer this question directly. In this case, the poverty gap is exactly e q u a l t ò the extra income needed by the
; household to leave income poverty.
..:■■'·.'. '..'.■ ■
, J
'
;'
v"
.-.''.
■'.''[.
..
::'
:,"'.
&>?λ·
':¿<:
■{'
,i--'■-'■■'
''
' ' ■ ' . ·
' . ' ■ ' ■
■ '
,
.
'' -
· '
Normally, this is not the case due to the fact that the poverty gap is based on the equivalent household income. In equivalising
the income, households are made comparable by dividing the household income by its equivalent size. The income poverty
gap is equal to the difference between the poverty line and equivalent household income. Hence, multiplying the poverty gap
by the household equivalent size gives the extra income the household (not the person) would need to receive in order to
-badge the gap
to
tne poverty lins,
,
,
-
,
.
.
å
fppy|· · '
'
... -
' : . · " .
-^^.|^|pw-jncorne;:ho.usehold in the European Union needed, on average, an extra income of around 3,200 PPS. With
aroffia^S.S'faillïon low-Income households in the European Union (excluding Finland and Sweden), this means that it would
i f f i r ø c o s r about
82.6
billion P P S to bring
a!! households
out of
poverty.
> METHODS AND CONCEPTS
The source of data used in this Statistics in Focus is the
European Community Household Panel (ECHP).
The ECHP ¡s a survey based on a standardised
questionnaire that involves annual interviewing of a representative panel of households and individuals in each European Union Member State, covering a
wide range of topics such as income (including social transfers), health, education, housing, demographic and employment characteristics, etc. The
longitudinal structure of the ECHP makes it possible to follow up and interview the same households and individuals over several consecutive years. The
first wave of the ECHP was conducted in 1994 in the twelve Member States of the European Union at that time. The survey was based on a sample of some
60,500 households (about 170,000 individuals). Since then, Austria (in 1995) and Finland (in 1996) have joined the project. Sweden does not take part.
The
results
in this study were calculated from the ECHP
'users' database',
which contains longitudinal microdata on households and persons interviewed,
harmonised and interlinked as the various survey waves are completed. For more details of direct access to ECHP microdata, see
'EC Household Panel
Newsletter
3/99'(OPOCE, Luxembourg, 1999).
The figures analysed in this study are
estimates,
whose precision - all other things being equal - depends on the size of the sample and the percentage.
They cover the 13 Member States for which the required data are currently available: all EU Member States except Finland and Sweden. The data for
Austria are still provisional. All results in this Statistics in Focus are based on at least 50 sample observations. Separate methodological studies on for
example sample size and attrition rates for analysis of income poverty are available in Eurostat.
Education level of a person
In the ECHP, each person aged 16 or over is asked to state the highest level of education he or she has successfully completed.
Type of the household
During the ECHP interview, the relationship of each person to the reference person of the household is established. Based on this relationship, and on age,
persons are classified into ten household types. Single persons fall into two classes, depending on age: singles below 65 and singles aged 65 or older.
Couples without children are similarly divided into two groups based on the age of the oldest person in the couple: couples below 65 without children and
couples aged 65 or over without children. Children are labelled dependent if their age is less than 18. Depending on the number of children, couples with
only dependent children are classified as: couples with one dependent child, couples with two dependent children and couples with three or more dependent
children. Couples with both dependent and non-dependent children are treated separately. One-parent households with at least one dependent child are
classified as single-parent households. All households that fall outside the above mentioned groups are labelled other households.
Labour market situation of the household
In this Statistics in Focus the labour market situation of the household was based on a combination of ILO main activity status during the current year and
self-defined main activity status of all household members aged 16 or older. The former is used to distinguish between working, unemployed and inactive
households. The latter is used to make a distinction between retired and other inactive households. This leads to the following categories:
■
Working, if a household has at least one member who is working.
■
Unemployed, if a household has no working members and at least one member is unemployed.
■
Retired, if a household has no working or unemployed members and at least one member is retired.
■
Other inactive, if a household has no working, unemployed or retired members.
Self-defined activity status
During the ECHP interviews, all persons aged 16 or over are asked to state for each month of the previous year their main activity: From this 'calendar of
activities' the most frequent activity of a person is defined (priority is given to activity over inactivity and to work over non-work). Contrary to the 'ILO main
activity' definition, the most frequent activity is 'self-defined' and not constructed.
Statistics in focus
— Theme 3 — 12/2000 ·
m
Income
Total household income is taken to be all the net monetary income received by the household and its members at the time of the interview (1996) during the
survey reference year (1995). This includes income from work (employment and self-employment), private income (from investments, property and private
transfers to the household), pensions and other social transfers directly received. No account has been taken of indirect social transfers (such as the
reimbursement of medical expenses), receipts in kind and imputed rent for owner-occupied accommodation. As the weight of these income components
may be different in the different countries, full comparability of income statistics is hampered. Figures on the level and distribution of income from the ECHP
should therefore be treated with some caution.
Equivalised income
In order to take into account differences in household size and composition in the comparison of income levels, the amounts given here are per "equivalent
adult". The household's total income is divided by its 'equivalent size', using the modified OECD equivalence scale. This scale gives a weight of 1.0 to the
first adult, 0.5 to the second and each subsequent person aged 14 and over, and 0.3 to each child aged under 14 in the household.
Purchasing power parities (PPP)
Incomes cannot be made directly comparable by using currency exchange rates, as in this way the difference in purchasing power of a particular monetary
unit in the different countries will not be taken into account. The conversion rates that take both rates of exchange and differences in purchasing power into
account are called Purchasing power parities (PPP). They convert every national monetary unit into a common reference unit, the "purchasing power
standard" (PPS), of which every unit can buy the same amount of goods and services across the countries in a specific year. However, in the ECHP, the
measurement of income related to the preceding year, so the conversion rates between PPS and the national currencies used in 1996 are 1995 PPPs.
These rates are: Β (42.13), DK (9.740), D (2.148), EL (236.5), E (134.9), F (7.274), IRL (0.7032), I (1.696), L (40.79), NL (2.250), A (15.19), Ρ (142.7),FIN
(7.012), UK (0.7305).
Income poverty
The income poverty line (or low-income threshold) is set at 60% of the median equivalised income per person in each Member State. The median income is
a robust measure as it is not affected by extreme values of the income distribution and less affected by sampling fluctuations. The 60% cut-off point is
chosen as a main reference point, while more points were used in the analyses to check the robustness of the results.
Ι
ΖΚ / 1
12/2000 — Theme 3 —
Statistics in focus
Further information.
Databases
New Cronos, Theme 3
Domain: ILC
To obtain information or to order publications, databases and special sets of data, please contact the
Data Shop
network:
B E L G I Q U E / B E L G I E D A N M A R K D E U T S C H L A N D E S P A N A F R A N C E I T A L I A - R o m a Eurostat Data Shop
Bruxelles/Brussel Planistat Belgique 124 Rue du Commerce Handelsstraat 124 B-1000 BRUXELLES / BRUSSEL
Tel. (32-2) 234 67 50
Fax (32-2) 234 67 51 E-Mail: datastiop@planistat.be
DANMARKS STATISTIK Bibliotek og Informaton Eurostat Data Shop Sejrogade 11 DK-2100 KØBENHAVN 0 Tel. (45-39) 17 30 30 Fax (45-39) 17 30 03 E-Mail: bib@dstdk
STATISTISCHES BUNDESAMT Eurostat Data Shop Berlin Otto-Braun-Straße 70-72 D-10178 BERLIN Tel. (49-30) 23 24 64 27/28 Fax (49-30) 23 24 64 30 E-Mail:
datashop@statistik-bund.de
INE Eurostat Data Shop Paseo de la Castellana, 183 Oficina 009
Entrada por Estèbanez Calderón E-28046 MADRID Tel. (34-91) 583 91 67 Fax (34-91 ) 579 71 20 E-Mail: datashop. eurostat@ine.es
INSEE Info Service Eurostat Data Shop 195, rue de Bercy Tour Gamma A F-75582 PARIS CEDEX 12 Tel. (33-1)5317 88 44 Fax (33-1) 5317 88 22 E-Mail: datashop@insee.fr
ISTAT
Centro di Informazione Statistica Sede di Roma, Eurostat Data Shop Via Cesare Balbo, 11a 1-00184 ROMA Tel. (39-06) 46 73 31 02/06 Fax (39-06) 46 73 31 01/07 E-Mail: dipdiff@istat.it
I T A L I A - M i l a n o L U X E M B O U R G N E D E R L A N D N O R G E P O R T U G A L S C H W E I Z / S U I S S E / S V I Z Z E R A ISTAT
Ufficio Regionale per la Lombardia Eurostat Data Shop
Via Fieno 3 1-20123 MILANO
Tel. (39-02) 8061 32460
Fax (39-02) 8061 32304 E-mail: mileuro@tin.it
Eurostat Data Shop Luxembourg Β Ρ 453
L-2014 LUXEMBOURG 4. rue A. Weicker L-2721 LUXEMBOURG Tel.(352)43 35 22 51 Fax (352) 43 35 22 221
STATISTICS NETHERLANDS Eurostat Data Shop-Voorburg pò box 4000
2270 JM VOORBURG
Nederland
Tel. (31-70) 337 49 00
Fax (31-70) 337 5984 E-Mail: dslux@eurostaLdatashop.lu E-Mail: datashop@cbs.nl
Statistics Norway Library and Information Centre Eurostat Data Shop Kongens gate 6 P. b. 8131, dep. N-0033OSLO
Tel. (47-22) 86 46 43
Fax (47-22) 86 45 04 E-Mail: datashop@ssb.no
Eurostat Data Shop Lisboa INE/Serviço de Difusão Av. António José de Almeida, 2 P-1000-O43 LISBOA Tel. (351-21) 842 61 00 Fax (351-21 ) 842 63 64 E-Mail: data.shop@ine.pt
Statistisches Amt des Kantons Zürich, Eurostat Data Shop Bleicherweg 5 CH-8090 Zürich Tel. (41-1)2251212 Fax (41-1) 225 12 99 E-Mail: datashop@zh.ch Internetadresse: http://www.zh.ch/statistik S U O M I / F I N L A N D S V E R I G E U N I T E D K I N G D O M U N I T E D K I N G D O M U N I T E D S T A T E S O F A M E R I C A
Eurostat Data Shop Helsinki Tilastokirjasto
Postiosoite: PL 2B
Käyntiosoite: Työpajakatu 13 B, 2 krs FIN-O0O22 Tilastokeskus Tel. (358-9) 17 34 22 21 Fax (358-9) 17 34 22 79
S-posb datashcp ülastokeskustablastokeskus fi Internetadresse
htlpj/www tilastokeskus MWVX/datashop himl
STATISTICS SWEDEN Information service Eurostat Data Shop Karlavägen 100-Box 24 300 S-104 51 STOCKHOLM Tel. (46-8) 50 69 48 01 Fax (46-8) 50 69 48 99 E-Mail: infoservice@scb.se URL: http://www.scb.se/info/datashop/ eudatashop.asp
Eurostat Data Shop Enquiries & advice and publications
Office for National Statistics Customers & Electronic Services Unit 1 Drummond Gate-B1/05 UK-LONDON SW1V2QQ
Tel. (44-207) 533 56 76
Fax (44-1633) 812 762 E-Mail eurostat.datashop@ons.gov.uk
Eurostat Data Shop Electronic Data Extractions, Enquiries & advice - R.CADE Unit 1L Mountjoy Research Centre University of Durham UK-DURHAM DH13SW Tel: (44-191) 374 7350 Fax: (44-191) 384 4971 E-Mail: r-cadetóìdur.ac.uk URL: http://www-rcade dur.ac.uk
HAVER ANALYTICS Eurostat Data Shop 60 East 42nd Street Suite 3310
USA-NEW YORK, NY 10165 Tel. (1-212) 986 93 00 Fax (1-212) 986 69 81 E-Mail: eutodata@haver.com Media Support Eurostat (for professional journalists only):
Bech Building Office A3/48 · L-2920 Luxembourg ■ Tel. (352) 430133408 · Fax (352) 4301 32649 ■ e-mail: eurostat-mediasupport@cec.eu.int
For information on methodology
Lene Mejer, Eurostat/E2, L-2920 Luxembourg, Tel. (352) 4301 32382, Fax (352) 4301 35979, E-mail: lene.mejer@cec.eu.int
ORIGINAL: English
Please visit our web site at
www.europa.eu.int/comm/eurostat/
for further information!
A list of worldwide sales outlets is available at the Office for Official Publications of the European Communities.
2 rue Mercier- L-2985 Luxembourg Tel. (352) 2929 42118 Fax (352) 2929 42709 Internet Address http://eu r-op.eu.int/fr/general/s-ad.htm e-mail: info.info@cec.eu.int
BELGIQUE/BELGIË - DANMARK - DEUTSCHLAND - GREECE/ELLADA - ESPAÑA - FRANCE - IRELAND - ITALIA - LUXEMBOURG - NEDERLAND - ÖSTERREICH PORTUGAL - SUOMI/FINLAND - SVERIGE - UNITED KINGDOM - ISLAND - NORGE - SCHWEIZ/SUISSE/SVIZZERA - BALGARIJA - CESKÄ REPUBLIKA - CYPRUS EESTI - HRVATSKA - MAGYARORSZAG - MALTA - POLSKA - ROMANIA - RUSSIA - SLOVAKIA - SLOVENIA - TÜRKIYE - AUSTRALIA - CANADA - EGYPT - INDIA ISRAEL - JAPAN - MALAYSIA - PHILIPPINES - SOUTH KOREA - THAILAND - UNITED STATES OF AMERICA