eurostat
STATISTICS IN FOCUS
External trade
1996
D 3
Reconciliation of the Merchandise Trade Statistics of the European Union, the United States and Canada
ISSN 1017-5792
1. Eurostat announces today the results of a study of differences in the statistics on trade between the European Union (EU) and the United States (US), and between the EU and Canada. The reference year of the study was 1992. Statistics on EU imports from the US and Canada differ by 8.1 % and 16.6% respectively from their counterparts (statistics on US and Canadian exports to the EU); statistics on EU exports to the US and Canada differ from their counterparts (statistics on US and Canadian imports from the EU) by 1.4% and 8.4% respectively. In order to help users with a clearer understanding of the data, Eurostat, together with the US Bureau of the Census and Statistics Canada, detected the main causes for the differences and estimated their effects on exports and imports. The study confirms findings for 1989 statistics that discrepancies are mostly caused by the treatment of freight and insurance, trade movements via third countries and the failure to record all export transactions.
2. A task force with representatives from some European Member States (Belgium-Luxembourg,
France, Germany, the Netherlands, Ireland, Spain and the United Kingdom) was created and gave valuable support to this exercise. Additional statistical and methodological information was provided, and in many cases the analyses and interpretation of statistical discrepancies were facilitated.
3. Some estimations have been made in cases where the statistical information was incomplete. Each partner concentrated on its import flows, so, in the case of Eurostat, EU imports were compared to US and Canadian exports (eastbound trade), while in the case of the US Bureau of the Census and Statistics Canada, North American imports were compared to the EU's exports (westbound trade).
4. The results of the study are presented below. These results do not constitute a revision of the official statistics published by the above-mentioned three organisations. The reconciled totals represent an estimation for the bilateral flows after having put the conceptual and methodological approach of both partners on a comparable basis.
Manuscript completed on = 28.02.1996
For further information please contact: E. Barredo
Eurostat, L-2920 Luxembourg, tel. 4301-32149 Fax: 4301-34762 e-mail: eduardo.barredo @ eurostat.cec.be
Price (excl. VAT) in Luxembourg: Subscription ECU 240,
5..The study was launched in March 1994, and was completed at the end of 1995, when the results were agreed upon by the three statistical organisations concerned. The decision to use 1992 as the reference year was taken when the exercise was started, as complete data for the EU was not available for later years.
6. In 1992, the European Union was comprised of 12 Member States: Belgium, Denmark, France, Germany, Greece, Ireland, Italy, Luxembourg, The Netherlands, Portugal, Spain and the United Kingdom. Austria, Finland and Sweden joined the EU in 1995 and are not included in this study.
7. The exchange rates used in this exercise were the following: $1 CDN= 0.6408 ECU, $1 CDN= 0.8271 US$, $1 US= 0.7743 ECU.
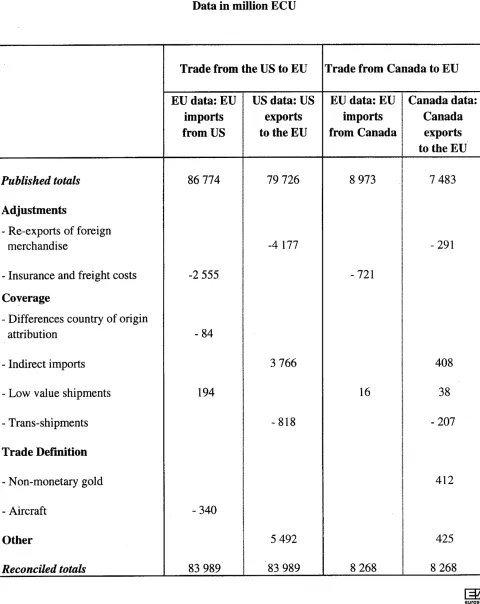
TABLE 1: RECONCILIATION OF 1992 MERCHANDISE TRADE STATISTICS
OF THE EUROPEAN UNION, UNITED STATES, AND CANADA
(EASTBOUND TRADE) Data in million ECU
Trade from the US to EU Trade from Canada to EU
EU data: EU US data: US EU data: EU Canada data:
imports exports imports Canada
from US to the EU from Canada exports
to the EU
Published totals 86 774 79726 8 973 7 483
Adjustments
- Re-exports of foreign
merchandise -4 177 - 291
- Insurance and freight costs -2 555 - 721
Coverage
- Differences country of origin
attribution - 84
- Indirect imports 3 766 408
- Low value shipments 194 16 38
- Trans-shipments - 818 - 207
Trade Definition
- Non-monetary gold 412
- Aircraft - 340
Other 5 492 425
Reconciled totals 83 989 83 989 8 268 8 268
[3!n
eurostat
Explanatory notes:
Published totals:
These figures are the official data for reported import and export totals for merchandise trade between the European Union, the United States and Canada, as published by the respective statistical organisations.
EU imports are valued on a "c.i.f. 11
basis (i.e. insurance and freight charges are included). Canadian exports are valued on a "f.o.b.11
(free on board) basis and therefore exclude international fr~ight and insurance charges. The United States values its exports on a "f.a.s". (free alongside ship) basis and like Canada, also excludes international freight and insurance charges. In practical terms, there is very little difference between "f.a.s. 11
and "f.o.b." valuation.
The US export total includes ECU 7 million in exports to Monaco and San Marino not normally included in published US totals for the EU.
EU merchandise trade data is compiled using the special trade system in comparison to the United States and Canada, who use the general trade system. The special trade system used by the EU excludes entries into Customs bonded warehouses which are subsequently re-exported to non-EU destinations. However, the published export data of the United States and Canada generally record such shipments as exports to the EU. The 'trans-shipment' adjustment provides estimates to compensate for this conceptual difference.
Acljustments;
Re-exports of foreign merchandise: These are shipments from the US and Canada to the EU of
merchandise originating in a third country, which are included in the published total exports of the United States and Canada. The EU records these as imports from the country of origin, and not from the re-exporting country.
Insurance and freight costs: These costs are not included in the US "f.a.s." or Canadian 11
f.o.b." export values. Since insurance and freight represent a value for services (not necessarily provided by the exporting country) and not for goods, for reconciliation purposes these have been removed from the EU import values. Unfortunately, the insurance and freight rates for EU imports are not available in a complete and detailed form. The corresponding charges for US imports from the EU have been used as a substitute for the EU imports from the United States and Canada.
Coverage:
Differences in country of origin attribution: These are re-exports of the United States which
have been incorrectly attributed in the EU import statistics as imports originating in the US, and not from third countries. This problem was identified for two particular commodities: (a) for diamond shipments from the United States that actually originated in third countries and, (b) for some Japanese nameplate automobiles manufactured in and shipped from the US but which were attributed as Japanese origin in EU import data.
Indirect imports: These are goods of US or Canadian origin which were exported indirectly
through one or more intermediary countries to the EU. Whereas, in principle, it can be assumed that these transactions are recorded in EU import statistics (using the country of origin principle), it may also be assumed that are not usually recorded in US or Canadian statistics as exports to the EU, but rather as exports to the intermediate country. Only a few EU Member States participating in the task force, in particular, the UK, Ireland, the Netherlands, Germany, France and Belgium, were able to identify such transactions. An estimation of 4% of total EU imports arriving indirectly from the United States and/or Canada was established using data from these Member States.
Low value trade: The United States account for all trade irrespective of its value. Canada has a
minimum threshold of $2,000 (CDN) for individual export transactions. Most EU Member States also have minimum statistical thresholds which vary between Members. Aggregate estimations for EU imports below the statistical thresholds were provided by those Member States participating in the task force, while for Canadian exports the amount was estimated as an average of 0.5% of total Canadian exports.
Trans-shipments: This adjustment represents goods of United States or Canadian origin shipped
through the EU to non-EU countries. These shipments are not included in EU import statistics, but are usually recorded in the counterpart export figures of the United States and Canada as shipments to the EU. It is particularly difficult to estimate the value of these flows as they are shipped through EU warehouses, mainly in Belgium and the Netherlands, as very little information pertaining to the value of these shipments is available. However, some flows could be identified: US exports of tobacco to Belgium and Canadian exports of aluminium, wood pulp, and nickel to warehouses both in Belgium and the Netherlands, where these were identified as having final destinations other than a EU Member State.
Trade definition:
These are transactions that are included in statistics by one partner but excluded by the other. - Non monetary gold: Some Canadian gold is exported to EU banks established in Switzerland, for furtherance to the EU. These flows appear in Canadian statistics as exports to Switzerland but are included in EU figures as imports from Canada.
- Aircraft: Some EU countries include leasing or repairs of aircraft as imports from the United States, whereas they are not recorded in US exports.
Other: This reflects all remaining differences not fully accounted for in the preceding adjustments,
including additional re-exports, valuation differences, trans-shipments or indirect imports, differences in the timing of exports and the corresponding import shipments, and the non-filing of export documents.
TABLE 2: RECONCILIATION OF 1992 MERCHANDISE TRADE STATISTICS OF THE EUROPEAN UNION, UNITED STATES, AND CANADA
(WESTBOUND TRADE) Data in million ECU
Trade from the EU to the US Trade from the EU to Canada
US data: US
I
EU data: EU Canada data: EU data: EUimports
I
exports Canada exportsfrom EU !
i
to the US imports to Canadafrom EU
I
Published totals 72 789 73 833 9 251 8472 Adjustments
- Re-exports of foreign
merchandise -3 149 - 291
- US-Re-imports - 865
Coverage
- Indirect imports 1 692 637
- Low values shipments 300 38
- Trans-shipments -492 492
- Postal trade 5
Trade Definition
- Autornobiles -60 ~ 110
- Aircraft - 31
- Cruise ships -290
Other 90 49
Reconciled totals 71 924 71924 9 256 9 256
Explanatory notes:
Published Totals:
These figures are the official data for reported import and export totals for merchandise trade between the EU, the US and Canada as published by the respective statistical organisations.
EU exports are valued on a "f.o.b. 11
basis, using the special trade system as compared to the general trade system used by the United States and Canada.
Re-exports of non-EU merchandise which have not entered the EU for domestic consumption are excluded from EU export statistics. An example of such a flow is goods previously entered into an EU Customs bonded warehouse and subsequently re-exported. In the import statistics of the United States and Canada, these shipments are credited to the country of origin ·and not the EU, and thus are consistent with EU exports.
However, foreign goods that had entered the EU for consumption and then were re-exported to North America are included in EU exports but excluded from the corresponding North American imports data as they are credited to the country of origin. This latter type of flow is adjusted for by the frrst reconciliation adjustment (re-exports of foreign merchandise).
US imports are valued on a "f.a.s. 11
(free alongside ship) basis. The US imports total includes ECU 12 million in imports from Monaco and San Marino not normally included in published US totals for the EU.
Canadian imports are valued on a 11
f.o.b." (free on board) basis. The "f.o.b." value exceeds the "f.a.s." value used by the United States by the cost ofloading the goods onto the exporting carrier. In practice there is little difference between the values reported on "f.o.b." and "f.a.s." basis.
Adjustments:
Re-exports of foreign merchandise: In the EU' s special trade system export statistics include
re-exports of non-EU goods from the Member States (although not from warehouses). This adjustment represents shipments from the EU of goods that are not of EU origin. The corresponding imports are recorded in US and Canadian statistics as imports from the non-EU country of origin (or as US re-imports).
US Re-imports: This is the value of US goods re-imported from the EU. This value, normally
included in US imports, corresponds to European re-exports of foreign merchandise and is removed for consistency.
Coverage:
Indirect imports: This represents goods of EU origin exported to North America from non-EU
countries. These shipments are not normally recorded as exports to the US or Canada in the EU statistics, but are recorded as imports from the EU in both US and Canadian statistics.
Low value shipments: Within import merchandise trade statistics, both the US and Canada account
for all trade, regardless of value. Some EU Member States exclude shipments below a statistical threshold. The US and Canadian adjustments represent the estimated value of shipments below each Member State's statistical threshold, if any.
Trans-shipments: This represents EU exports of crude petroleum which is unloaded in the United
States and shipped inmediately to Canada. The oil, which the EU shows as an export to the United States, does not appear in the published statistics of the US but is recorded as an import from the EU in Canadian statistics.
The value of this adjustment has been estimated from volume reports submitted to Statistics Canada, and supplemented by publicly available pricing information.
Postal trade: Up to 1992, Canada did not record imports of items imported by post. This adjustment
is based on data supplied by the European Union.
Trade definition:
These adjustments reflect transactions that are included in statistics by one partner but excluded by the other.
- Automobiles: This adjustment represents differences in the conceptual treatment of automobiles
temporarily purchased by North Americans visiting Europe. Note that the vehicles do not physically arrive in either the United States or Canada.
- Aircraft: This adjustment represents a timing difference in the recording of aircraft
purchases/leases by Canada and the EU.
- Ships: This adjustment represents ships recorded by the EU as exports to the United States that
were never recorded as US imports due to differing Customs regulations.
Other: This reflects all remaining differences not fully accounted for in the preceding adjustments,