This is a repository copy of First evidence of widespread active methane seepage in the
Southern Ocean, off the sub-Antarctic island of South Georgia.
White Rose Research Online URL for this paper:
http://eprints.whiterose.ac.uk/82703/
Version: Accepted Version
Article:
Römer, M, Torres, M, Kasten, S et al. (13 more authors) (2014) First evidence of
widespread active methane seepage in the Southern Ocean, off the sub-Antarctic island of
South Georgia. Earth and Planetary Science Letters, 403. 166 - 177. ISSN 1385-013X
https://doi.org/10.1016/j.epsl.2014.06.036
eprints@whiterose.ac.uk https://eprints.whiterose.ac.uk/
Reuse
Unless indicated otherwise, fulltext items are protected by copyright with all rights reserved. The copyright exception in section 29 of the Copyright, Designs and Patents Act 1988 allows the making of a single copy solely for the purpose of non-commercial research or private study within the limits of fair dealing. The publisher or other rights-holder may allow further reproduction and re-use of this version - refer to the White Rose Research Online record for this item. Where records identify the publisher as the copyright holder, users can verify any specific terms of use on the publisher’s website.
Takedown
If you consider content in White Rose Research Online to be in breach of UK law, please notify us by
1
First evidence of widespread active methane seepage in the
Southern Ocean
Römer, M.1,*, Torres, M.2, Kasten, S.3, Kuhn, G.3, Graham, A.G.C.4,5, Mau, S.1, Little, C.T.S.6, Linse, K.5,
Pape, T.1, Geprägs, P.1, Fischer, D.1,3, Wintersteller, P.1, Marcon, Y.1, Rethemeyer, J.7, Bohrmann, G.1 5
and shipboard scientific party ANT-XXIX/4
1
MARUM – Center for Marine Environmental Sciences and Department of Geosciences,
University of Bremen, Klagenfurter Str., 28359 Bremen, Germany
2
College of Oceanic and Atmospheric Sciences, Oregon State University, 104 Ocean Admin
10
Building, Corvallis, Oregon 97331-5503
3 Alfred Wegener Institute, Helmholtz Centre for Polar and Marine Research, Am
Handelshafen 12, 27515 Bremerhaven, Germany
4 College of Life and Environmental Sciences, University of Exeter, Rennes Drive, Exeter EX4
4RJ, UK
15
5
Geological Sciences Division, British Antarctic Survey, High Cross, Madingley Road,
Cambridge CB3 0ET, UK
6
School of Earth and Environment, University of Leeds, Leeds LS2 9JT, UK
7
Institute of Geology and Mineralogy, University of Cologne, 50674 Cologne, Germany
20
* Corresponding author: Phone +49(0)421 218 65059 Fax +49(0)421 218 65099 E-mail:
Abstract
25
A new extensive submarine cold-seep area was discovered on the northern shelf of South Georgia
during R/V Polarstern cruise ANT-XXIX/4 in spring 2013. Hydroacoustic surveys and video-based sea
floor observations documented the presence of 133 individual gas bubble emissions, which were
restricted to glacially-formed fjords and troughs. Effective methane transport from these emissions
into the hydrosphere was proven by relative enrichments of dissolved methane in near-bottom 30
waters. Stable carbon isotopic signatures of the methane pointed to a predominant microbial origin.
Although known from many continental margins in the world’s oceans, this is the first report of an
active area of methane seepage in the Southern Ocean. Our finding of substantial methane emission
related to a trough and fjord system, a topographical setting that exists commonly in
glacially-affected areas, opens up the possibility that methane seepage is a more widespread phenomenon in 35
polar and sub-polar regions than previously thought.
Keywords: Cold seeps, gas bubble emissions, methane seepage, South Georgia
1. Introduction
Sea-floor hydrocarbon seepage occurs at numerous sites on the world’s ocean margins, from the 40
continental shelves to the abyssal depths, in a variety of geological settings1,2. Notwithstanding
several decades of global methane seep exploration, examples in the Southern Ocean are almost
unknown. First videographic evidence of an Antarctic cold seep was obtained by Domack et al.3 from
the seafloor beneath the collapsed Larsen B ice shelf, western Weddell Sea, located in the trough of
the Evans and Crane glacier. This site was later revisited by Niemann et al.4, who classified the 45
seepage as inactive, based on the presence of dead shells of seep-associated chemosymbiotic clams
3
emissions. Apart from at this single extinct cold seep site, naturally occurring chemosynthetic
organisms5 have also been found in the Southern Ocean at hydrothermal vents in the Bransfield
Straight6,7 and the South Sandwich back-arc8, and at a whale fall from the Kemp Caldera9. The paucity 50
of records of chemosynthesis-based communities in the Southern Oceans can be partly explained by
a lack of exploration, due to the challenging and remote conditions in this region10.
The expanding numbers of seep locations discovered worldwide highlights the importance of
methane seepage for the global carbon cycle, and its potential contribution to the oceanic and
atmospheric methane inventory, where - in the latter case - methane acts as a potent greenhouse 55
gas. In contrast to deep-water seep sites, where most bubbles dissolve during ascent through the
water column and the dissolved methane is oxidized by microbes11–13, a fraction of gas emitted from
shallow water environments may transgress the sea-atmosphere boundary, especially in storm
seasons14,15. Therefore, shelf and upper slope areas such as off Spitsbergen16,17, in the Black Sea18,
and off East Siberia19 are of particular interest when considering the role of methane seepage as a 60
possible contributor to concentrations of methane in the atmosphere.
South Georgia belongs to the crustal blocks forming the North Scotia Ridge (Fig. 1a), which were once
part of the continental connection between South America and the Antarctic Peninsula20,21. These
crustal blocks were moved during the Cenozoic by backarc spreading and subsequent eastward
growth of the Scotia Sea20,22. There is evidence for active convergence along the western side of the 65
North Scotia Ridge, but convergence has now ceased along its eastern section, which includes the
South Georgia block20,23. However, analyses of an earthquake with its epicenter located south of the
South Georgia block (see Fig. 1b) indicates nearly pure thrust faulting, interpreted to represent
thrusting of the Scotia Plate beneath South Georgia24. This tectonic framework shows that South
Georgia is part of an isolated microcontinental block, divided by the W-E trending Cooper Bay Shear 70
Zone that crosses the Island (Fig. 1b). This is the major tectonic boundary that displaces the late
In contrast to the knowledge of the geologic and tectonic evolution of South Georgia, the shelf and
upper slope area surrounding the Island have been less well studied. However, a recent
comprehensive bathymetric compilation aimed at elucidating the paleo-ice sheet drainage of the 75
Island has greatly improved our knowledge of the continental shelf morphology of South Georgia26.
Graham et al.26 described large eroded troughs linked to the recent fjords around South Georgia (Fig.
1b), and they proposed that these cross-shelf troughs were formed during glacial times and
represent former pathways of outlet glaciers and ice streams. While probable Mesozoic sedimentary
and volcanic rocks extend beneath the inner shelf of South Georgia, Cenozoic sediments form the 80
outer parts of the continental shelf26,27.
South Georgia is located in the path of the Antarctic Circumpolar Current (ACC). The Polar Front is
located to the north and the southern ACC front loops anticyclonically around the island from the
south before retroflecting to the east28. The shelf waters of South Georgia often show oceanographic
properties that are markedly different from the open waters, indicating that local processes are 85
important in dictating shelf water mass characteristics29. Various shelf-specific processes have been
observed, or inferred at South Georgia, and significant interannual variability of the oceanographic
conditions on the shelf are known29,30. Whitehouse et al.31 reported a surface water warming of up to
2.3°C in 81 years around South Georgia, however, this warming was not recognized in waters deeper
than 200 m. In general, the special oceanographic conditions around South Georgia result in a rich 90
ecosystem, with large phytoplankton blooms and related strong atmospheric carbon drawdown32,33,
as well as high organic matter sedimentation on the shelf. The seasonally occurring blooms are
particularly intense on the northern shelf area of South Georgia and within the adjacent Georgia
Basin32.
In this study we performed a comprehensive hydroacoustic survey along the northern shelf of South 95
Georgia, detecting numerous gas flares and analyzing their distribution. Subsequent sea floor visual
observations of two of these flares revealed a detailed view of the seep sites. These data were
5
together illustrate methane-related processes taking place in the local hydrosphere. In addition, gas
samples taken from sediment cores from the seep sites were analyzed for their stable carbon 100
isotopic composition, which allowed us infer the source of the methane fueling them.
Results
Hydroacoustic observations
Hydroacoustic surveys revealed the presence of numerous gas emission sites at water depths
between 130 and 390 meters below sea level (mbsl) on the northern shelf of South Georgia in spring 105
2013. The gas emissions appear as ‘flares’ in the echograms due to the high impedance contrast of
free gas emanating as bubbles through the water column, which produce a high-backscatter signal
(Fig. 2a). The flares are composed of vertically arranged oblique reflections that image the up-rising
individual bubbles or groups of bubbles, and make them discernible from fish schools. In total, at
least 133 individual flares were detected during our study (Figs. 3a and b, supplementary table S1). 110
The flares showed largely straight and vertical orientation (e.g. the 170-m high ‘Cumberland Bay
Flare’, Fig. 4c), indicating a lack of strong currents that would be expected to deflect the bubbles
during their rise through the water column. Roughly ~75 % of the flares were less than 100 m high,
with an average of ~70 m (supplementary table S1). However, three flares extended from the sea
floor to a height of at least 25 mbsl. The uppermost part of the echograms was disturbed by acoustic 115
noise that hampered differentiation of gas bubbles from plankton and/or fish. In general, the real
flare height was difficult to determine using Parasound recordings, as the small ~4° opening angle
and a coherent narrowing footprint with decreasing depth impeded the detection of the uppermost
part of the flares when the ship did not pass exactly through the center of the bubble train.
Many flares detected were discontinuous or had no connection to the sea floor (Figs. 4a and b). This 120
observation can be attributed to horizontal deflections of a bubble stream that moves in and out of
the conical Parasound beam, or to pulsing gas bubble streams where the emissions are spatially and
appeared vertical and didn’t show strong lateral deflections, although variable current regimes
cannot be ruled out entirely. 125
The temporal variability of the flares was examined by imaging a given location more than once. Four
flares became visible at the same location two times within ca. 14 days, whereas seven other flares
appeared only once, although crossed twice (supplementary table S2). The observations of the flare
appearance and the repeated surveys show that most flares probably are temporally variable on
scales of minutes to weeks. 130
The detected flares were not randomly distributed along the South Georgia margin. They occured
either within the Cumberland Bay fjord system or within the other incised cross-shelf troughs that
cut through the broad shelf surrounding the island (Fig. 3a). Two fjord systems were inspected for
the occurrence of flares during cruise ANT-XXIX/4: Cumberland Bay was investigated intensively (Fig.
3b), whereas Possession Bay was entered once and inspected along only two survey lines. While 135
numerous flares were observed in the Cumberland Bay region, no indication of gas emissions was
found in Possession Bay. In total, more than 75 flares were detected in both branches of Cumberland
Bay and within the cross-shelf to which the fjord system connects (designated as Trough 5 in Fig. 3b).
Flares were distributed close to the fjord-mouth and within the fjord itself, but were not detected in
the innermost parts of the bay close to the glaciers that discharge into the fjord at the coast. A few 140
flares were found within the ~10 km area seaward of the fjord mouth, and one flare was detected as
far as ~30 km from land. In addition to cross-shelf Trough 5, gas emissions were also found in four of
the seven troughs defined by Graham et al.26 on the northern shelf of South Georgia (Fig. 3a). The
northern shelf was passed for hydroacoustic surveys twice in a roughly two week interval and during
both investigations flares were observed to be restricted to the troughs. No flares were detected on 145
the shallower banks between the cross-shelf troughs and, with the exception of Troughs 2 and 7, all
7
Sedimentary strata were not visible in subbottom Parasound SLF profiles of the shallow shelf banks
(Fig. 4b), but the troughs were characterized by reflections indicating sediment accumulations of up
to ~40 m in their centers (Figs. 4a). The reflections were sub-parallel to the sea floor and presumably 150
reflect accumulations of sediment transported from the fjords to the shelf, and deposition within the
cross-shelf troughs. Numerous zones of acoustic blanking or acoustically-transparent chimneys that
pierced the horizontal reflections were observed for all of the sediment infills within the troughs
(Figs. 2b, 4a, b and c), suggesting upward gas migration at these sites. The acoustic chimneys were
positioned directly underneath the acoustic flares in the water column in several areas, strongly 155
suggesting that the chimneys are the conduits for channeling free gas through the sediments
towards the sea floor, where gas bubbles escape into the water column and form the flares imaged
in the Parasound PHF echograms (Figs. 2b, 4a, b and c).
Visual sea floor observations at the ‘Cumberland Bay Flare’
An OFOS deployment was conducted at a flare site designated as the ‘Cumberland Bay Flare’ in order 160
to visually confirm the sea floor origin of the gas flares recorded hydroacoustically (Fig. 4c), and the
nature of the surrounding sediments. The sea floor was inspected along an approx. 400 m long track
(Fig. 5). Visibility during the OFOS deployment was limited to a few meters because of the highly
turbid and sediment-rich meltwater in the fjord and inspections were thus performed with an
altitude of ~2 m. The flat sea floor was composed of unconsolidated sediments and detached kelp 165
fronds (Figs. 6a and b), many of which were partially buried. The observed epibenthic invertebrate
megafauna included cidaroid and echinoid sea urchins, asteroid starfish, holothurians, hexactinellid
sponges, and fish (Fig. 6a).
Numerous centimetre-sized holes were visible in the sea floor along the OFOS track, which were
probably produced by endobenthic organisms or may represent the orifices of emanating gas 170
bubbles. Rising gas bubbles were observed at two seep sites during the OFOS deployment, which was
guided by flare observations in the water column. Our observations document single gas bubbles
period of about 40 minutes at the southeastern located seep site (Figs. 5 and 6a), we documented
more than 50 events (roughly about each minute), where a single bubble or small groups of 2 or 3 175
bubbles rose from the seabed. We observed individual rising gas bubbles again at a northwestern
seep site, which is located ~50 m distant from the other and corresponded to a different water
column flare (Figs. 5 and 6b).
At both seep sites the sea floor was covered by centimeter to decimeter-sized, subcircular, whitish
material (Fig. 6a and b), occurring either as coherent patches or as collections of several smaller 180
patches (Figs. 5 and 6a). These patches most probably represent microbial mats indicative of fluid
flow from below. However, we did not see taxonomically higher chemosymbiotic organisms typically
associated with cold seeps in other regions, such as bathymodiolin mussels or vesicomyid clams. The
sea floor in two locations where whitish material was observed was slightly elevated and formed
topographic mounds up to a few decimeters high (Fig. 6a). Fig. 5 illustrates that the whitish material 185
is restricted to two areas a few meters in extent, both of which are located at the central foci of the
two flares detected hydroacoustically.
Water column characteristics in Cumberland Bay
Three hydrocasts revealed a general water column stratification and specific differences in
hydrological conditions in Cumberland Bay (station CTD-1 close to the ‘Cumberland Bay Flare’; CTD-2 190
close to the ‘Grytviken Flare’; see Fig. 3b) and a station seaward of the fjord (CTD-3). A pronounced
surface layer (upper ~20 mbsl) was present at stations CTD-1 and CTD-2 in Cumberland Bay,
characterized by relatively low salinities (<33 PSU), temperatures (<2.8 °C) and beam transmissions
(<80 %). These characteristics suggest that this water mass (not observed at the seaward station;
Figs. 7, supplementary Fig. S3) represents plumed meltwater and originates from the melting marine 195
terminating glaciers that feed the bay (Fig. 3b). Physico-chemical properties varied only slightly with
increasing depth throughout the midwater section. The lower limit of this water mass was found at
~165 mbsl for CTD-2 (located relatively deep within the fjord) and at ~190 mbsl for CTD-1 (located
9
topographically-controlled circulation patterns. Similar water characteristics at all three investigated 200
stations indicate water exchange between Cumberland Bay and the shelf area of South Georgia. The
lowermost water mass within and outside Cumberland Bay was characterized by relatively low
temperatures (~2.4 – 1.7°C) and relative depletions in dissolved oxygen concentrations (6.5 – 5.2
mL/l), but with the highest salinities (up to 34.2 PSU). A markedly lower beam transmission (as low as
80% at the bottom) recorded for the near-bottom water mass within the bay, if compared to that at 205
the outer shelf station, might be the result of a higher particulate matter load (see also chapter 4.2).
Strong enrichments in dissolved methane of up to 25.4 nmol/l and 55.6 nmol/l, respectively, were
measured in the lowermost water mass characterized by low-beam transmission at the two CTD
stations taken in close proximity to the ‘Cumberland Bay Flare’ and the ‘Grytviken Flare’ (Figs. 3b and
7). At these stations concentrations of dissolved methane decreased significantly with decreasing 210
depth within the lower 100-120 meters of the water column down to ca. 5 nmol/l (Fig. 7), which is
still slightly elevated in contrast to the atmospheric equilibrium (3-3.3 nmol/l). At the outer shelf
station, where flares were not detected, dissolved methane concentrations of <5 nmol/l were
measured though the whole water column.
Stable carbon isotopic composition of methane
215
Stable carbon isotopic analysis of methane in the gas samples extracted from the two sediment cores
taken in close proximity to flares (GC-1 within cross-shelf Trough 6; GC-2 in the Cumberland Bay; Figs.
3a and b) revealed strong depletions in 13C, with 13C-CH4 values ranging between –80.2 and –88.9‰
(V-PDB). The greatest depletion came from a methane sample extracted at ~6.5 mbsf from the
sediment core GC-2 at the ‘Grytviken Flare’. 220
Discussion
We detected 133 gas flares at the northern shelf of South Georgia (Fig. 3a) during R/V Polarstern
cruise ANT-XXIX/4 in 2013. Visual sea-floor inspections with the high-resolution video camera of the
bubbles and white sea-bed patches (Figs. 6a and b) interpreted as microbial mats fueled by methane 225
emission. Hydroacoustically-imaged flares originated from sea floor locations that showed
acoustically-blanked chimneys in the underlying sediments. In addition, water samples taken in
bottom waters within two flares showed elevated concentrations of dissolved methane (Fig. 7), that
proved methane transport by gas bubbles from the sea floor into the hydrosphere.
This new finding of methane seepage adds to the long and steadily growing list of seep areas in the 230
world’s oceans1,2,34. At high latitudes, seeps are known in the Arctic and sub-Arctic, which have
recently sparked particular scientific interest because of their links to permafrost settings19 with
potential global warming effects16. Hydrothermal vents and cold seeps are known to host specialized
faunal communities which are based on chemosynthesis5,35. In the Southern Ocean to date only a few
chemosynthetic ecosystems are known10, including the presently inactive cold seep in the western 235
Weddell Sea, hydrothermal vent fields and a natural whale fall3,4,6–9. The epibenthic invertebrate
megafauna observed in the Cumberland Bay area comprises species commonly found around South
Georgia36–38. Except for the inferred microbial mats chemosynthetic organisms usually found at cold
seep sites were not found at the seeps investigated in this study. This might be because of the
relatively shallow water depth (~250 mbsl), since the typical animals obligate at cold seeps (e.g. 240
species of vesicomyid clams, bathymodiolin mussels and siboglinid tubeworms) are restricted to
aphotic habitats. Explanations for their absence on the continental shelves include the abundance of
predators in shallower waters, or competitive exclusion by primary consumers limiting the presence
of species dependent on chemoautotrophic symbionts39. The exact depth limit is not precisely
resolved40, but the shallowest seep communities with the typical obligate species found so far are 245
reported from the Eel River basin, offshore California in ~350 mbsl41 and in the Sea of Okhotsk in
~370 mbsl39. In our study we detected gas bubble seepage using hydroacoustics in the same depth
range (ca. 380 mbsl), but did not investigate these sites visually. Thus, it remains a possibility that
11
As noted above, the flares detected during ANT-XXIX/4 along the northern shelf of South Georgia are 250
not randomly distributed, but are restricted to the fjords and glacial troughs along the shelf (Fig. 3a),
the latter accounting for ~15% of the total shelf area surrounding the island of South Georgia.
Detailed surveys are required to determine further distribution and total abundance of such
methane seep sites, which is probably significantly higher than the 133 flares we detected during the
detailed but still spatially-limited surveys of R/V Polarstern cruise ANT-XXIX/4. A similar observation 255
was made in a hydrocarbon seep area on the Baffin Bay shelf region, where oil and gas seeps were
found within glacially-formed troughs seaward of fjord systems42,43. In addition, seepage was inferred
to occur in fjords in Spitsbergen44 and Norway1, based on the presence of sea floor pockmarks. Fjords
generally appear to represent favorable settings for methane seepage as they are commonly
characterized by high sedimentation rates (due to high input from inflowing glaciers or meltwater 260
streams). In addition, in some cases shallow water sills hamper water exchange with open seawater
areas and ventilation, favouring anoxic conditions and protecting organic material from rapid
microbial decomposition under aerobic conditions, which finally leads to large accumulations of
refractory organic matter in the sediments1. During our study we observed various sill structures in
the high-resolution bathymetric maps of the South Georgia fjords, probably representing fjord 265
moraines45. However, these do not appear to fully restrict flow (Fig. 3b), as temperature, salinity and
concentrations of dissolved oxygen are indeed lower in the bottom waters than in overlying water
masses, but the values where similar in magnitude for all three stations, both within and outside the
fjord. Therefore, there is no apparent isolation of the deep waters in Cumberland Bay (Figs. 7,
supplementary Fig. S3). Bottom water oxygen concentrations within and outside the bay were ~5 270
mL/l (corresponding to ~220 µmol/l), indicating well-oxygenated conditions.
For Cumberland Bay, Platt46 estimated the sedimentation rate at 2.8 × 10³ g m-2 yr-1 and an organic
matter input of 60 g carbon m-2 yr-1, providing an ideal setting for shallow biogenic methane
production. A biogenic methane source is proven by 13C-CH4 values <–80 ‰ (V-PDB) for all gas
consume substrates depleted in 13C, whereas thermogenic light hydrocarbons by non-selective
hydrocarbon cracking are not affected by significant isotope fractionation effects47. For a microbial
hydrocarbon formation and accumulation both high sedimentation rate and the presence of
sufficient amount of organic matter in the sediments is required. South Georgia lies in the eastward
flowing ACC, creating a morphological high in the largest meander modifying the Southern ACC 280
front28,48. Due to this particular hydrographic configuration, intensive and regular phytoplankton
blooms develop in the area north and northwest of the South Georgia shelf32, leading to both a rich
food web49, and a high carbon production, which is either exported50 or ultimately deposited at the
sea floor. Although there is no indication for deeply buried reservoirs of thermogenic gas fueling the
gas emission sites investigated in this study, thermogenic gas migration through deep-rooted faults 285
cannot be entirely excluded as the fjords and connecting cross-shelf troughs may have established
along lines of structural weakness that could have evolved in association to faults zones26.
Unfortunately, there are currently no seismic data imaging the deeper structure of the South Georgia
block to test such a hypothesis.
Due to the nature of our survey, most of the imaged flares were not centered directly under the 290
vessel, thus, precluding a quantitative assessment of their intensities. However, our observations
revealed that (1) most flares are only few tens of meters high, (2) flares often appear episodically and
are characterized by discharge in pulses, and (3) flares indicative for individual bubbles or bubble
groups are occasionally tilted, so that their sea floor origin could not always be traced (Figs. 4a and
b). These data suggest that most of the flares are rather weak and represent discontinuous releases 295
of gas bubble emissions. Visual inspection of the ‘Cumberland Bay Flare’ one of the most intense
flares we imaged (Fig. 4c), showed sporadic gas bubble discharge from the projected flare origin, but
also indicated that the sporadic release of individual gas bubbles was sufficient to cause a relatively
intense signature in the corresponding echogram. Because our data demonstrate that the flares are
temporally variable over minutes to weeks it may be possible that the activity and intensity of the 300
13
The quantity of bubbles and the intensity of seepage on the northern shelf of South Georgia seems
to be rather weak in comparison to other seep areas, e.g. Hydrate Ridge51,52, the Makran continental
margin12, Santa Barbara channel53, as well as several seepage areas in the Black Sea 54–56, where
vigorous gas bubble emissions and/or strong flares have been documented. However, the large 305
number of emission sites as revealed from our flare imaging, in combination with the strong
enrichments in dissolved methane, suggests injection of significant quantities of methane into the
bottom water in fjords and the cross-shelf troughs of South Georgia, even though each individual
seep may contribute only a small amount of methane.
Our hydroacoustic data additionally indicate that most gas bubbles released into the water column 310
probably did not reach the upper water layer and atmosphere, but instead dissolved entirely during
their ascent. With three exceptions, all 133 flares detected disappeared from the SBES echograms
well below the sea surface. Although the geometric limitation of the SBES coverage, particularly at
shallow depths, has to be considered, the fraction of methane transported as gas bubbles is not
limited only by the maximum bubble rising height, but mainly depends on the effectiveness of gas 315
exchange processes taking place when entering the hydrosphere, due to concentration differences.
The proportion of methane initially contained in the bubble is rapidly replaced by dissolved nitrogen
and oxygen from the ambient water11,57,58. The rapidity of this process strongly depends on the
bubble size, the rising velocity, as well as the composition and conditions of the surrounding medium
and the presence of upwelling flows59. Several studies have demonstrated that methane escapes the 320
bubbles well before final bubble dissolution11,56,60,61. Our suggestion that most of the methane
discharged from the South Georgia northern shelf does not reach the upper water column is
additionally strengthened by the relatively low concentrations of dissolved methane (about 5 nmol/l)
in the intermediate to uppermost water masses at two hydrocast stations, deliberately acquired
close to recorded flares in the Cumberland Bay area (Figs. 3b and 8). Most probably, the strong 325
stratification of the water column, as evidenced by the T-S diagram (supplementary Fig. S3), impedes
the bottom water, leading to the observed profiles. A fraction of this methane may be oxidized by
microbial activity62, so the measured concentrations reflect a balance between methane input and
sea-floor consumption within Cumberland Bay and water exchange with the outer shelf water. It is 330
hard to directly correlate water column data with flare strength, but our data agrees with our
assumption that the methane transported via gas bubbles rapidly dissolves in the water body, so that
most of the dissolved methane remains in the bottom water and that bubbles producing the
hydroacoustic flares visible at that sites and reaching 50 m higher into the water column may have
been depleted in methane. 335
We argue that the seepage around South Georgia is spatially related to the glacial trough and fjord
system, a setting often occurring in sub-Antarctic regions that need further exploration to
characterize the nature, distribution and magnitude of hydrocarbon seepage in this region. Research
questions about methane seepage around South Georgia following from our study include: 1)
unraveling the relationships between seepage, methane sources and rates of sediment 340
accumulation, as well as the type and amount of organic carbon; 2) evaluating the potential
contribution of thermogenic gas in some areas; 3) documentation of the biosphere and
biogeochemical processes supported by the methane input; 4) establishing whether some of the
deeper seeps support chemosynthetic fauna, and, if present, do they serve as ‘stepping stones’ for
larval distribution of chemosynthesis-based organisms in the Southern Ocean; 5) constructing a 345
carbon budget for the region, which includes source and consumption terms as well as the effect of
circulation within and outside the fjords, and the circumstances under which this methane may reach
the atmosphere.
Methods
Hydroacoustic systems
350
The data used for this study were acquired during R/V Polarstern cruise ANT-XXIX/4 in March and
April 201363. Bathymetric mapping was performed using an ATLAS Hydrosweep Deep-Sea 320-beam
15
water depth. Raw data were processed with CARIS 7.0 HIPS and SIPS and the MB-System software64
and the grids produced were visualized with ESRI ArcMap 10.0, which allowed for inclusion of 355
additional relevant data to be plotted (e.g. track lines, locations of gas emissions). The cleaned
Hydrosweep data were gridded with a cell size of 25 m. We combined our results with additional
data from earlier cruises of the British Antarctic Survey65 (available at
http://www.antarctica.ac.uk/bas_research/data/online_resources/sgbd/) and the GEBCO dataset
(http://www.gebco.net/). 360
We used the ship-mounted parametric single beam echosounder (SBES) ATLAS PARASOUND for
shallow subbottom imaging. The secondary low frequency (SLF) of about 4 kHz was recorded and
processed online with the software ATLAS PARASTORE. The resulting PS3-files were imported to
SENT (H. Keil, University of Bremen) and the data plotted. In addition, the SBES ATLAS PARASOUND
was used for flare detection and imaging, using the primary high frequency (PHF) of about 18 kHz 365
(Fig. 2a). The transducer opening angle is 4°, resulting in a footprint size of about 7% of the water
depth. PARASOUND data as well as metadata are available at the PANGAEA data repository.
Seafloor observations
The Ocean Floor Observation System (OFOS), a towed underwater system equipped with a
high-resolution digital camera (ISITEC, CANON EOS 1Ds Mark III), was used to visually inspect the sea floor 370
in areas where flares were detected. The camera was programmed to take high-resolution (21
megapixels) photographs of the sea floor every 30 seconds at an altitude of about 1.5 – 2 m relative
to the seabed. Underwater-navigation was achieved using the shipboard IXSEA Posidonia ultra short
baseline system, with an accuracy of 5 – 10 m, and these data were used to establish the OFOS tracks
and the positions of each photograph taken. 375
Water column analyses
Water column properties were studied by repeated hydrocasts with a 24-Niskin water bottle rosette
and a CTD (Seabird, SBE 911+). Using the sensors of the CTD-unit, salinity, temperature, and pressure
data were measured and, in addition, a Sea-Tech transmissometer recorded beam transmission and
the water column, 750 ml of sampled seawater were transferred from the Niskin bottles into
pre-evacuated 1000 ml glas bottles immediately after recovery, followed by gas extraction according to
the modification of the vacuum degassing method described by Rehder et al.66. The extracted gas
samples were analyzed with a 6890N gas chromatograph (Agilent Technologies) equipped with a
capillary column and connected to a Flame Ionization Detector, as described in Pape et al.55. 385
Calibrations and performance checks of the analytical system were conducted regularly using
commercial pure methane standards. The coefficient of variation determined for the analytical
procedure was less than 2%.
Stable carbon isotope signatures
Three sedimentary gas samples each extracted from two gravity cores taken close to flare origins 390
(GC-1: station PS81/280-1 in cross-shelf Trough 6, Fig. 3a; GC-2: station PS81/284-1 in Cumberland
Bay, Fig. 3b) were analyzed for stable carbon isotope ratios of methane. The samples were obtained
from depths between 6 and 9 meters below sea floor (mbsf), which was below the actual depth of
the sulfate-methane transition (Chapter 9 in Bohrmann63), and, thus, should not have been
influenced by potential anaerobic oxidation of methane processes. Sediment (3 ml) was sampled 395
from the bottom of each of the freshly cut core sections using cut-off syringes and transferred into
20 ml glass vials prefilled with 5 ml of 1 M NaOH. The gas was sampled for onboard methane
concentration analyses and shore-based measurements of its stable isotope signature. Analysis of
stable C isotope signatures of CH4 was conducted in the commercial GEO-data GmbH laboratory
(Garbsen, Germany). Stable C isotope signatures are reported in -notation in parts permil (‰), 400
relative to the Vienna PeeDee Belemnite (V-PDB) standard for carbon isotopes. The reproducibility of
stable carbon isotope determinations is estimated at ±0.1‰.
References
17
2. Suess, E. in Handbook Of Hydrocarbon And Lipid Microbiology (Timmis, K. N.) 186–203 405
(Springer, 2010).
3. Domack, E. et al. A chemotrophic ecosystem found beneath Antarctic Ice Shelf. Eos, 86, 269 (2005).
4. Niemann, H. et al. Biogeochemistry of a low-activity cold seep in the Larsen B area, western Weddell Sea, Antarctica. Biogeosciences6, 2383–2395 (2009).
410
5. Van Dover, C. L., German, C. R., Speer, K. G., Parson, L. M. & Vrijenhoek, R. C. Evolution and biogeography of deep-sea vent and seep invertebrates. Science 295, 1253–7 (2002).
6. Bohrmann, G., Chin, C. & Petersen, S. Hydrothermal activity at Hook Ridge in the Central Bransfield Basin, Antarctica. Geo-Mar. Lett. 18, 277–284 (1999).
7. Aquilina, A. et al. Geochemical and visual indicators of hydrothermal fluid flow through a 415
sediment-hosted volcanic ridge in the Central Bransfield Basin ( Antarctica ). PLoS ONE8,
(2013).
8. Rogers, A. D. et al. The discovery of new deep-sea hydrothermal vent communities in the southern ocean and implications for biogeography. PLoS Biology10, e1001234 (2012).
9. Amon, D. J. et al. The discovery of a natural whale fall in the Antarctic deep sea. Deep-Sea
420
Res.Pt II 92, 87–96 (2013).
10. Rogers, A. D. & Linse, K. in Biogeographic Atlas of the Southern Ocean (De Broyer C. et al.) 2–6 (Scientific Committee on Antarctic Research, 2012).
11. McGinnis, D. F., Greinert, J., Artemov, Y., Beaubien, S. E. & Wüest, A. Fate of rising methane bubbles in stratified waters: How much methane reaches the atmosphere? J. Geophys.Res.
425
111, C09007 (2006).
12. Römer, M., Sahling, H., Pape, T., Bohrmann, G. & Spieß, V. Quantification of gas bubble emissions from submarine hydrocarbon seeps at the Makran continental margin (offshore Pakistan). J. Geophys. Res.117, C10015 (2012).
13. Mau, S., Heintz, M. B. & Valentine, D. L. Quantification of CH4 loss and transport in dissolved 430
plumes of the Santa Barbara Channel, California. Cont. Shelf Res.32, 110–120 (2012).
14. Schneider Von Deimling, J. et al. Quantification of seep-related methane gas emissions at Tommeliten, North Sea. Cont. Shelf Res.31, 867–878 (2011).
15. Schmale, O., Beaubien, S. E., Rehder, G., Greinert, J. & Lombardi, S. Gas seepage in the Dnepr paleo-delta area (NW-Black Sea) and its regional impact on the water column methane cycle. 435
J. Marine Syst.80, 90–100 (2010).
16. Westbrook, G. K. et al. Escape of methane gas from the seabed along the West Spitsbergen continental margin. Geophys. Res. Lett.36, L16608 (2009).
17. Gentz, T. et al. A water column study of methane around gas flares located at the West Spitsbergen continental margin. Cont. Shelf Res. (2013).
18. Greinert, J., McGinnis, D. F., Naudts, L., Linke, P. & De Batist, M. Atmospheric methane flux from bubbling seeps: Spatially extrapolated quantification from a Black Sea shelf area. J. Geophys.Res.115, C01002 (2010).
19. Shakhova, N. et al. Extensive methane venting to the atmosphere from sediments of the East Siberian Arctic Shelf. Science 327, 1246–50 (2010).
445
20. Cunningham, A. P., Barker, P. F. & Tomlinson, J. S. Tectonics and sedimentary environment of the North Scotia Ridge region revealed by side-scan sonar. J. Geol. Soc.London155, 941–956 (1998).
21. Dalziel I. W. D., Dott R. H. Jr, Winn R. D. Jr, Bruhn R. L. Tectonic relations of South Georgia Island to the southernmost Andes. Bull. Geol. Soc. Am. 86, 1034–1040 (1975).
450
22. Forsyth, D. W. Fault plane solutions and tectonics of the South Atlantic and Scotia Sea. J. Geophys. Res.80, 1429-1443 (1975).
23. Ludwig, W. J. & Rabinowitz, P. D. The collision complex of the North Scotia Ridge. J. Geophys.Res.87, 3731 (1982).
24. Pelayo, A. & Wiens, D. Seismotectonics and relative plate motions in the Scotia Sea region. J.
455
Geophys.Res.94, 7293–7320 (1989).
25. Curtis, M. L., Flowerdew, M. J., Riley, T. R., Whitehouse, M. J. & Daly, J. S. Andean sinistral transpression and kinematic partitioning in South Georgia. J. Struct.Geol.32, 464–477 (2010).
26. Graham, A. G. C. et al. A new bathymetric compilation highlighting extensive paleo-ice sheet drainage on the continental shelf, South Georgia, sub-Antarctica. Geochem. Geophy. Geosy.9,
460
Q07011 (2008).
27. Simpson, P. & Griffiths, D. H. in Antarctic Geoscience (Craddock, C.) 185 – 191 (Int. Union of Geol. Sci., 1982).
28. Thorpe, S. E., Heywood, K. J., Brandon, M. A & Stevens, D. P. Variability of the southern Antarctic Circumpolar Current front north of South Georgia. J. Marine Syst. 37, 87–105 (2002). 465
29. Young, E. F., Meredith, M. P., Murphy, E. J. & Carvalho, G. R. High-resolution modelling of the shelf and open ocean adjacent to South Georgia, Southern Ocean. Deep-Sea Res.Pt II58,
1540–1552 (2011).
30. Meredith, M. P. et al. Variability in hydrographic conditions to the east and northwest of South Georgia, 1996–2001. J. Marine Syst.53, 143–167 (2005).
470
31. Whitehouse, M. J. et al. Rapid warming of the ocean around South Georgia, Southern Ocean, during the 20th century: Forcings, characteristics and implications for lower trophic levels.
Deep-Sea Res. Pt I55, 1218–1228 (2008).
32. Borrione, I. & Schlitzer, R. Distribution and recurrence of phytoplankton blooms around South Georgia, Southern Ocean. Biogeosciences10, 217–231 (2013).
19
33. Jones, E. M., Bakker, D. C. E., Venables, H. J. & Watson, A. J. Dynamic seasonal cycling of inorganic carbon downstream of South Georgia, Southern Ocean. Deep-Sea Res. Pt II59-60,
25–35 (2012).
34. Campbell, K. A. Hydrocarbon seep and hydrothermal vent paleoenvironments and
paleontology: Past developments and future research directions. Palaeogeogr. Palaeocl.232,
480
362–407 (2006).
35. Bachraty, C., Legendre, P. & Desbruyères, D. Biogeographic relationships among deep-sea hydrothermal vent faunas at global scale. Deep-Sea Res. Pt I56, 1371–1378 (2009).
36. James E., McKenna Jr. Trophic relationships within the Antarctic demersal fish community of South Georgia Island. Fish. B.-NOAA89, 643–654 (1991).
485
37. Hogg, O. T., Barnes, D. K. A. & Griffiths, H. J. Highly diverse, poorly studied and uniquely threatened by climate change: An assessment of marine biodiversity on South Georgia’s continental shelf. PLoS ONE6, (2011).
38. Jones, C. D. et al. Diversity, relative abundance, new locality records and population structure of Antarctic demersal fishes from the northern Scotia Arc islands and Bouvetøya. Polar Biol.
490
31, 1481–1497 (2008).
39. Sahling, H. et al. Depth-related structure and ecological significance of cold-seep communities—a case study from the Sea of Okhotsk. Deep-Sea Res. Pt I50, 1391–1409 (2003).
40. Little, C., Campbell, K. & Herrington, R. Why did ancient chemosynthetic seep and vent 495
assemblages occur in shallower water than they do today? Comment. Int. J. Earth Sci.91,
149–153 (2002).
41. Orange, D. L., Yun, J., Maher, N., Barry, J. & Greene, G. Tracking California seafloor seeps with bathymetry, backscatter and ROVs. Cont.Shelf Res.22, 2273–2290 (2002).
42. Grant, A., Levy, E., Lee, K. & Moffat, J. Pisces lV research submersible finds oiI on Baffin Shelf. 500
Current Research, Part A, Geological Survey of Canada86, 65–59 (1986).
43. Levy, E. & Ehrhardt, M. Natural seepage of petroleum at Buchan Gulf, Baffin Island. Mar. Chem.10, 355–364 (1981).
44. Forwick, M., Baeten, N. J. & Vorren, T. O. Pockmarks in Spitsbergen fjords. Norw. J. Geol. 89,
65–77 (2009). 505
45. Hodgson, D. A. et al. Glacial history of sub-Antarctic South Georgia based on the submarine geomorphology of its fjords. Quaternary Sci.Rev.
46. Platt, H. M. Sedimentation and the distribution of organic matter in a sub-Antarctic marine bay. Estuar. Coast. Mar. Sci.9, 51–63 (1979).
47. Claypool, G. & Kvenvolden, K. Methane and other hydrocarbon gases in marine sediment. 510
48. Meredith, M. P. An anticyclonic circulation above the Northwest Georgia Rise, Southern Ocean. Geophys. Res. Lett. 30, 2061 (2003).
49. Atkinson, a et al. South Georgia, Antarctica: a productive, cold water, pelagic ecosystem. Mar. Ecol.-Prog. Ser.216, 279–308 (2001).
515
50. Schlitzer, R. Carbon export fluxes in the Southern Ocean: results from inverse modeling and comparison with satellite-based estimates. Deep-Sea Res. Pt II49, 1623–1644 (2002).
51. Heeschen, K. U. et al. Methane sources, distributions, and fluxes from cold vent sites at Hydrate Ridge, Cascadia Margin. Global Biogeochem. Cy.19, GB2016 (2005).
52. Torres, M. E. et al. Fluid and chemical fuxes in and out of sediments hosting methane hydrate 520
deposits on Hydrate Ridge, OR, I : Hydrological provinces. Earth Planet. Sc. Lett.201, 525–540 (2002).
53. Hornafius, J. The world’s most spectacular marine hydrocarbon seeps (Coal Oil Point, Santa Barbara Channel, California): Quantification of emissions. J. Geophys. Res.104, 20,703 – 20,711 (1999).
525
54. Nikolovska, A., Sahling, H. & Bohrmann, G. Hydroacoustic methodology for detection, localization, and quantification of gas bubbles rising from the seafloor at gas seeps from the eastern Black Sea. Geochem. Geophy. Geosy.9, Q10010 (2008).
55. Pape, T. et al. Molecular and isotopic partitioning of low-molecular-weight hydrocarbons during migration and gas hydrate precipitation in deposits of a high-flux seepage site. Chem.
530
Geol.269, 350–363 (2010).
56. Römer, M. et al. Geological control and magnitude of methane ebullition from a high-flux seep area in the Black Sea—the Kerch seep area. Mar.Geol.319-322, 57–74 (2012).
57. Leifer, I. & Patro, R. K. The bubble mechanism for methane transport from the shallow sea bed to the surface: A review and sensitivity study. Cont.Shelf Res.22, 2409–2428 (2002). 535
58. Wüest, A., Brooks, N. H. & Imboden, D. M. Bubble plume modeling for lake restoration. Water Resour. Res.28, 3235–3250 (1992).
59. Leifer, I. & Judd, a. G. Oceanic methane layers: the hydrocarbon seep bubble deposition hypothesis. Terra Nova14, 417–424 (2002).
60. Greinert, J. & McGinnis, D. F. Single bubble dissolution model – The graphical user interface 540
SiBu-GUI. Environ. Modell. Softw.24, 1012–1013 (2009).
61. Greinert, J., Artemov, Y., Egorov, V., Debatist, M. & McGinnis, D. 1300-m-high rising bubbles from mud volcanoes at 2080m in the Black Sea: Hydroacoustic characteristics and temporal variability. Earth Planet. Sc. Lett.244, 1–15 (2006).
62. Valentine, D., Blanton, D., Reeburgh, W. S. & Kastner, M. Water column methane oxidation 545
21
63. Bohrmann, G. The expedition of the research vessel “Polarstern” to the Antarctic in 2013 (ANT-XXIX/4). Berichte zur Polar- und Meeresforschung 668, 145 p. (2013).
64. Caress, D. W. et al. Repeat bathymetric surveys at 1-metre resolution of lava flows erupted at 550
Axial Seamount in April 2011. Nat. Geosci.5, 1–6 (2012).
65. Fretwell, P. T., Tate, A. J., Deen, T. J. & Belchier, M. Compilation of a new bathymetric dataset of South Georgia. Antarct. Sci.21, 171 (2008).
66. Rehder, G., Keir, R. S., Suess, E. & Rhein, M. Methane in the northern Atlantic controlled by microbial oxidation and atmospheric history. Geophys. Res. Lett.26, 587–590 (1999). 555
67. MacDonald, D. I. M. & Storey, B. C. South Georgia, BAS GEOMAP Series, Sheet 1, scale 1:250,000. 63 (British Antarctic Survey, 1987).
Acknowledgements
We greatly appreciate the shipboard support from the master and crew of the research vessel 560
Polarstern during cruise ANT-XXIX/4. This work was supported by the Deutsche
Forschungsgemeinschaft (DFG) in the framework of the priority program ‘Antarctic Research with
comparative investigations in Arctic ice areas’ by a grant to BO 1049/19 and through the
DFG-Research Center / Cluster of Excellence „The Ocean in the Earth System“. AGCG was supported by
Natural Environment Research Council (NERC) New Investigator Grant, NEK0005271, and by a 565
fieldwork grant from the UK Quaternary Research Association (QRA) Research Fund. KL was
supported by the ChEsSo programme (Consortium Grant NE/DO1249X/1) funded by NERC. CTSL
acknowledges travel funds from the Earth Surface Sciences Institute, University of Leeds.
Author contributions
M.R. led the authorship of the paper. G.B. was principle scientist of R/V Polarstern ANT-XXIX/4. P.W. 570
and A.G.C.G. took care of the processing of MBES data. G.K. and M.R. operated and analyzed the
SBES data. S.M., P.G., and J.R. conducted hydrocasts and water column analyses. C.T.S.L., K.L., Y.M.
and M.R. operated the OFOS and analyzed the video material. T.P., P.G. and J.R. provided the gas
analyses. All authors contributed to the development of the paper.
Figure captions
575
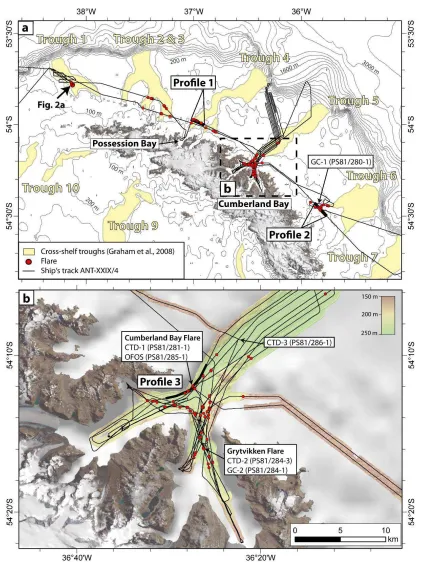
Fig. 1 a) Plate tectonic overview with the South Georgia microplate (SG) located at the eastern part
Antarctic Plate (modified after Cunningham et al.20). b) Map of the main tectonic structures of the
South Georgia crustal block (after MacDonald et al.67). The shelf morphology is characterized by at
least ten cross-shelf troughs sourcing at the fjords of the island (yellow areas; Graham et al.26). 580
Fig. 2 a) Echogram recorded with the single beam echosounder (SBES) illustrating a flare composed
of numerous oblique high-backscatter traces representing uprising gas bubbles. The footprint of the
SBES at a water depth of ~380 mbsl corresponds to ~30 m to the width of the flare signal at the sea
floor (white line). b) SBES echogram combing the water column data and the subbottom information
(using 18 and 3.5 kHz frequencies, respectively). Gas emission sites are characterized by acoustic 585
blanking in the subsurface (gas chimneys) and emissions of free gas in the water column causing
hydroacoustic flares. For locations see Figs. 3a and b.
Fig. 3 a) Map showing the shelf bathymetry with its characteristic cross-shelf troughs in
combination with the ship track (black line) and flare positions (red dots) detected during R/V
Polarstern cruise ANT-XXIX/4. Cross-shelf Troughs 1-7 at the northern shelf have been crossed in 590
order to detect free gas in the subbottom and water column. Additionally, two fjords were
investigated: the Possession Bay, where Trough 4 is sourced, and the Cumberland Bay, which is
directly connected to Trough 5. b) Detailed map of the Cumberland Bay with the processed
bathymetric data acquired during cruise ANT-XXIX/4. More than 75 flares were detected during the
surveys within the fjord system. 595
Fig. 4 Three profiles recorded with SBES combining subbottom (3.5 kHz) and water column (18 kHz)
information. Flares are repainted in red. For locations see Figs. 3a and b. a) Profile 1 shows an
echogram crossing the cross-shelf Trough 4. Several flares were detected, but the majority showed a
discontinuous pattern most probably caused by pulsing gas bubble emissions. b) Profile 2 shows an
echogram at cross-shelf Trough 6. In contrast to the shallow banks lacking visible sediment strata in 600
the subbottom, the troughs are characterized by sediment accumulation. c) Profile 3 shows an
23
Several acoustic chimneys characterized by vertical blanking zones illustrate up-rising free gas in the
subbottom (red outlines with arrows) and additionally, three flares prove the emission of gas bubbles
into the water column. 605
Fig. 5 a) Bathymetric map from ship-based swath echosounder recordings with the dive track of
the Ocean Floor Observation System (OFOS; station PS81/285-1) passing two areas, where
hydroacoustic investigations indicated gas bubble emissions from the sea floor (light red circles).
Rising gas bubbles were recognized in both areas and whitish patches on the sea floor additionally
proved the position of the seep sites (white dots). 610
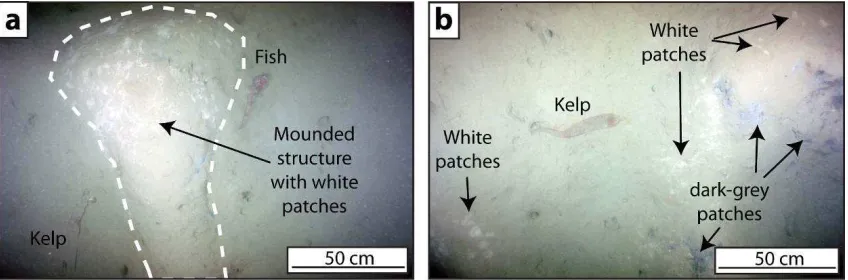
Fig. 6 a) Sea floor picture taken at the Cumberland Bay Flare with the high-resolution video camera
mounted on the frame of the Ocean Floor Observation System (OFOS) and showing an elongated
mounded structure at the sea floor characterized by whitish color, probably representing microbial
mats. b) Sea floor image taken at the northwestern flare area demonstrates the occurrence and
intercalation of white colored and additionally dark grey colored patches. For locations see Figs. 3b 615
and 5.
Fig. 8 Water column profile illustrating selected data recorded during three CTD casts acquired.
Stations CTD-1 (colored dashed lines) and CTD-2 (colored solid lines) were located within the
Cumberland Bay and CTD-3 (black lines) seaward the fjord mouth (see Fig. 3b). Elevated methane
concentrations were measured in particular in the lowermost ~100 m at the two Cumberland Bay 620
stations taken close to hydroacoustically detected flares. Bottom waters at that depth were
characterized by low temperatures, beam transmissions and dissolved oxygen concentrations.
Supplementary Fig. S3 Temperature-Salinity diagram of the data from the three CTD stations during
ANT-XXIX/4. T-S condition in surface waters at stations CTD-1 and CTD-2 located in the Cumberland
Fig. 1
25
27
Fig. 4
Fig. 5
29
Fig. 7
650