m
eurostatWAGES AND INCOMES
Rapid information
5.3.1980
LABOUR COSTS IN INDUSTRY (Updated survey r e s u l t s )
1975 - I978
[image:1.595.34.540.14.567.2]Contents
Table 1: Hourly l a b o u r c o s t s I 9 7 5 - I 9 7 8 , a l l manufacturing i n d u s t r i e s a) in national currency b) i n UCE
c) indices (1975=100), October I978 Table 2: Hourly labour costs 1975-I978,
by i n d u s t r i a l branches
a) in national currency b) in UCE
In the scope of the Community system of wages statistics, labour costs surveys are carried out every three years. While the results of the 1975 survey have been published (l), those of the 197Õ survey are currently processed by Member countries. First results are scheduled to become available in the second half of this year.
(l) EUROSTAT, Labour costs in industry 1975 vol. 1: results by industry; vol. 2: structure; vol. 3: results by size classes; vol. 4: results by regions.
Statistical Office
of the European Communities Demographic and Social Statistics Luxembourg B.P. 1907
Tel. 4 3 0 1 1 ext. 3594/2028
2
-Meanwhile, the Statistical Office of the European Communities, in collaboration with the national statistical institutes, has updated the hourly labour costs
(results of the 1975 survey) for the years 1976 to 1978. Users are cautionned that the 1978 updatings given in this note are provisional estimates to be re placed by the 1978 survey results as soon as these become available.
[image:3.595.112.548.383.758.2]A summary of the trends of labour costs in industry s table 1, showing total hourly labour costs for manual in all manufacturing industries. The large disparity labour costs in individual member countries should be (average) and October 1978 labour costs expressed in increases between 2jf0 in PR Germany and 9C70 in Italy, to 40 to 50% in Luxembourg, the UK and Prance, and to two Benelux-countries and in Denmark (estimates for I
ince 1975 is given in and non-manual workers in the developments of
stressed: between 1975 national currency showed
whereas the rise amounted about 30^ in the other reland are not available). On the other hand, the trends of labour costs, expressed in European units of account (EUA), confirm the importance of monetary developments resulting in a φ continued relative deterioration of the international competitive position of
certain countries, in particular the Benelux—countries and the P.R. of Germany. Thus, whereas these countries are found at the bottom of the scale if increases in labour costs between 1975 and 1978 are considered in national currencies, they show the biggest rises if these are measured from data converted to EUA; it is not surprising that these countries rank highest if the absolute levels of costs are compared.
Explanatory note
The hourly labour cost is arrived at by dividing the total labour cost (expenditure on manual and non-manual workers) by the total number of hours worked by manual workers and the customary or usual number of hours worked by non-manual workers.
The labour costs, expressed in national currencies, have been converted into European units of account (EUA) sole ly to facilitate comparison in terms of international competitiveness. A more general comparison of the relat ive labour costs in different countries, based on
purchasing power parities will be published in the near future.
3
-TAB.1
HOURLY LABOUR COSTS 1975-1978
a)
All manufacturing industries Manual + non manual workers
N
Β
UK
DK
Χ IV χ
1975 1976 1977 1978 1977 1978 1978
Χ IV χ
1975 1976 1977 1978 1977 1978 1978
In national currency In EUA
DM
a) in national currency
FF
LIT
HFL
BFR
LFR
UKL
b) in EUA c)
c) Indices (1975=100), October I978
DKR 17,54
18,90 20,30 21,40 20,50 21,20 21,60
24,95 . 28,90
32,80 37,10 33,70 36,10 38,10
3 450 4 280 5 400
: 5 620
6 5 6 0t )
20,24 22,60 23,80 25,60 24,60 25,50 25,90
268 301 332 354 337 349 359
270 313 344 377
1,66 1,91 2,12 2,27 2,03
• • 2,35
5,75 6,70 7,70 8,40 7,80 8,30 8,60
4*69 5,40 5,90 6,50 6,00 6,30 6,60
4,26 4,60 5,40
: 5,50
5:,90b )
6,46 7,60 8,50 9,30 8,80 9,30 9,50
5,89 7,00 8,10 8,80 8,20 8,80 9,00
5,93 7,20 8,40 9,40
2*95 3,10 3,20 3,40 3,10
• • 3,50
40,90 45,20 49,00 54,00 49,90 53,10 55,00
5,74 6,70 7,20 7,60 7,10 7,90 7,70
123,3
149,6
152,8
141,4
190,0 ;
139,ob )
128,1
146,6
133,6
153,5
137,0
157,3
141,8
117,3
134,4
136,9
a) Data for Ireland are not available
b) Estimated according to increase in hourly earnings between October 1977 and October I978
Table 2
HOURLY LABOUR COSTS IN INDUSTRY 1975 1978
a) in national currency
4
Manual 1 to 5 (ex oept 16+ 17)n,
13, 21, 23 12, 14, 15, 22, 24 to 26, 3, 411
12
13
14
21
+ non manual workers
N A C E
All industries (except elec tricity, gas, steam and water) Mining and quarrying Manufacturing industries Extraction and briquetting of solid fuels Coke ovens Extraction of petroleum and natural gas Mineral oil refining Extraction and preparation of metalliferous ores 1975 1976 1977 1978 1975 1976 1977 1978 1975 1976 1977 1978 1975 1976 1977 1978 1975 1976 1977 1978 1975 1976 1977 1978 1975 1976 1977 1978 1975 1976 1977 1978
D
DM
17,57 18,80 20,20 21,30 22,60 24,40 25,70 27,10 17,54 18,90 20,30 21,40 24,72^ 26,60^< 28,OOJ< 29,501;l • * • : : 23,06 24,90 26,30 27,40 25,50 27,40 29,30 31,30 21,14 22,50 24,00 23,80F
FF
24,44 28,50 32,50 36,70 33,56 : s : 24,95 28,90 32,80 37,10 34,34 • • t • • • • • • • • • • 53,58 62,40 71,60 78,20 44,85 51,60 59,20 65,00 38,00 45,30 49,80 56,30I
LIT
3400 4270 5390 • • 4379 4860 6160 • 3450 4280 5400 : 5220 4684 5820 7120 : 5221 6330 7470 : 5223 6760 7840 • • 4582 5280 6610 • •NL
HFL
20,21 22,60 23,80 25,60 26,79 t t t 20,24 22,60 23,80 25,60 « n 29,80 : t t 28,43 30,80 33,10 36,40 B
BFR
272 304 337 360 338 359 392 410 268 301 332 354 374 391 425 444 317 349 381 403 ~ 484 555 615 661 L
LFR
256 295 326 352 304 346 381 405 270 313 344 377 mm -^ 337 388 430 472UK
UKL
1,69 : : t 2,49 t X t 1,66 1,91 2,12 2,27 2,63 t t t ■ 2,29 : : t s t t t 2,67 3,04 3,42 3,68 : • • t tDK
DKR
40,40 s t t 37,42 40,30 47,20 49,80 40,90 45,20 49,00 54,00 \ 47,67 51,70 58,40 64,20 —Table 2 ( c o n t ' d )
HOURLY LABOUR COSTS IN INDUSTRY 1975 - 1978
A ) i n n a t i o n a l currency
5
-•
•
Manual + non manual workers
N A C E
22 23 24 25 26 31 32 Production and preliminary processing of metals Extraction of minerals other than metalli ferous Manufacture of non-metallic mineral products Chemical industry Man-made fibres industry Manufacture of metal articles Mechanical engineering 1975 1976 1977 1978 1975 1976 1977 1978 1975 1976 1977 1978 1975 1976 1977 1978 1975 1976 1977 1978 1975 1976 1977 1978 1975 1976 1977 1978
D
DM 19,83 21,40 22,80 24,10 15,37 16,50 17,50 18,60 16,42 17,60 18,80 19,80 20,78 22,40 24,10 25,50 19,5& 21,40 23,20 24,40 17,13 18,40 19,80 20,70 18,82 20,20 21,80 22,80F
FF 29,33 34,40 38,80 43,00 26,33 31,10 35,40 40,20 23,71 27,20 30,90 34,90 32,72 36,80 41,60 47,90 33,51 37,40 • • • * 23,06 27,00 30,60 34,50 25,77 30,20 34,30 38,70I
LIT 4012 5080 6250 • 4056 4430 5600 • • 3108 3850 4930 : 4169 5200 6490 • 4037 5390 6320 • • 3376 4190 5260 • 3567 4540 5680 : NL HFL 24,07 27,60 28,80 30,40 22,58 * : : 19,13 21,30 22,40 24,40 24,64 27,70 29,40 31,40 : : : : 18,79 20,60 21,70 23,00 19,55 21,80 22,70 24,30Β
BFR 336 376 413 437 279 321 358 379 265 303 340 362 331 369 415 441 321 365 400 406 266 295 327 347 283 315 345 368L
LFR 307 353 393 439 204 229 241 256 206 242 262 277 212 245 269 295 272 336 351 372 208 244 267 281 259 295 323 345 UK UKL 1,97 2,24 2,49 2,72 • « I • • • • 1,59 1,85 2,03 2,25 1,97 2,30 2,54 2,73 2,02 2,31 2,53 2,73 1,60 1,86 2,08 2,27 If 71 1,96 2,19 2,41 DK DKR 44,66 49,00 53,20 57,60 37,42 40,30 47,20 49,80 40,65 45,80 50,40 54,50 46,23 50,40 55,60 59,00 -38,75 43,20 46,30 51,10 42,26 47,δ01)51,4ο1)
53,3ο1
Table 2 (cont'd;
HOURLY LABOUR COSTS IN INDUSTRY I975 - 1978 a) in national currency
6
-mar
nial + non manual workersN A C E
33
34
t
36
37
» ,42
43
Manufacture of office machinery and data process-ing machineryElectrical engineering
Manufacture of motor vehicles and of motor vehicle parts and accessories Manufacture of other means of transport
Instrument engineering
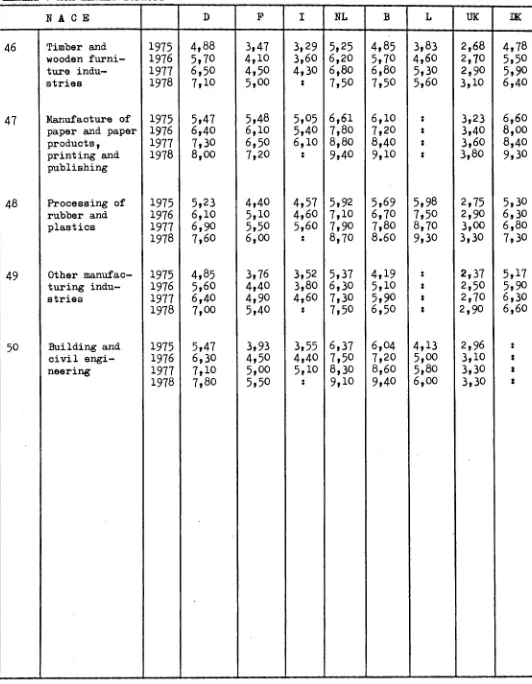
Table 2 (cont'd)
HOURLY LABOUR COSTS IN INDUSTRY 1975 - 1978 a) in national currency
7
-manual + non -manual workers
N A C E
44 Leather and leather goods industry
45 Manufacture of clothing and footwear
•
46 Timber and wooden furniture
industries
47 Manufacture of paper and paper products, printing and publishing 48 Processing of
rubber and plastics
«
49 Other manufactur-ing industries
Table 2
HOURLY LABOUR COSTS IN INDUSTRY 1975 1978 b) in EUA
8
Manual + non manual workers N A C E
1 to
5
(ex cept16+
17)
n,
13,
21,
23
12,
14,
15,
22,
24 to26,
3, 411
12
13
14
21
All industries (except elec tricity, gas, steam and water) Mining and quarrying Manufacturing industries Extraction and briquetting of solid fuels Coke ovens Extraction of petroleum and natural gas Mineral oil refining Extraction and preparation of metalliferous ores 1975 1976 1977 1978 1975 1976 1977 1978 1975 1976 1977 1978 1975 1976 1977 1978 1975 1976 1977 1978 1975 1976 1977 1978 1975 1976 1977 1978 1975 1976 1977 1978D
5,76 6,70 7,60 8,30 7,43 8,70 9,70 10,60 5,75 6,70 7,70 8,408
'
n
ì)
9,50; io,6o:< n , 5 0x': : t • • 7,56 8,80 9,90 10,70 8,36 9,80 11,10 12,30 6,93 8,00
9,io
9,30F
4,59 5,30 5,80 6,40 6,31 4,69 5,40 5,90 6,50 6,46 • • : : : : • • • 10,07 ii,70 12,80 13,60 8,43 9,70 10,60 11,30 7,14 8,50 8,90 9,80I
4,20 4,60 5,40 • • 5,41 5,30 6,10 I 4,26 4,60 5,40 : 6,45 5,79 6,30 7,10 : 6,45 6,80 7,40 • 6,58 7,30 7,80 1 5,66 5,70 6,60 :NL
6,45 7,60 8,50 9,30 8,55s
: • • 6,46 7,60 8,50 9,30 mm β — 9,51 9,07 10,40 11,80 13,20 mm ™Β
5,96 7,00 8,20 9,00 7,41 8,30 9,60 10,20 5,89 7,00 8,10 8,80 8,21 9,10 10,40 11,10 6,69 8,10 9,30 10,10 M mm 10,61 12,90i5,oo
16,50 _ ·"L
5,61 6,80 8,00 8,80 6,68 8,00 9,30 10,10 5,93 7,20 8,40 9,40 » mm ■ " _ mm ·*· mm 7,409,oo
10,50 11,80UK
3,02 t I • 4,45 1 • • • • 2,95 3,10 3,20 3,40 4,70 • : : 4,09 : : : : 1 : I 4,77 4,90 5,20 5,50 t • • • tDK
15,67 : ts
5,25 6,00 6,90 7,10 5,74 6,70 7,10 7,70 M mm - — _ mm 6,69 7,70 8,50 9,20 _. Table 2 (cont'd) HOURLY LABOUR COSTS IN INDUSTRY I975
b) in EUA manual + non manual workers
9
-1978
N A C E
D
NL
Β
UK
DK
22
23
24
25
26
31
32
33
Production and preliminary processing of metals Extraction of minerals other than metalli ferous Manufacture of non-metallic mineral products Chemical in dustry Man-made fibres industry Manufacture of metal articles Mechanical engineering Manufacture of office machinery and data pro cessing machi nery I975 1976 I977 1978 1975 1976 1977 1978 1975 1976 1977 1978 1975 1976 1977 1978 1975 1976 1977 1978 1975 1976 1977 1978 1975 1976 1977 1978 1975 1976 1977 19786,50
7,60
8,60
9,40
5,04
5,90
6,60
7,30
5,38
6,30
7,10
7,70
6,81
8,00
9,10
10,00
6,42
7,60
8,80
9,60
5,62
6,50
7,50
8,10
6,17
7,20
8,20
8,90
7,82
9,30
10,70
11,70
5,51
6,40
6,90
7,50
4,95
5,80
6,30
7,00
4,46
5,10
5,50
6,10
6,15
6,90
7,40
8,30
6,30
7,00
4,34
5,10
5,50
6,00
4,84
5,70
6,10
6,70
8,24
9,30
9,70
10,60
4,96
5,50
6,20
:
5,01
4,80
5,60
:
3,84
4,10
4,90
5,15
5,60
6,50
4,99
5,80
6,30
:
4,17
4,50
5,20
4,41
4,90
5,60
5,33
6,10
6,80
7,68
9,30
10,30
11,00
7,20
*
:
:
6,10
7,20
8,00
8,90
7,86
9,40
10,50
11,40
5,99
7,00
7,80
8,40
6,24
7,40
8,10
8,80
7,41
8,70
9,70
10,80
7,38
8,70
10,10
10,90
6,12
7,40
8,80
9,50
5,82
7,00
8,30
9,00
7,26
8,50
10,20
11,00
7,06
8,50
9,80
10,10
5,83
6,80
8,00
8,70
6,21
7,30
8,50
9,20
5,20
:
6,74
8,20
9,60
11,00
4,49
5,30
5,90
6,40
4,52
5,60
6,40
6,90
4,66
5,70
6,60
7,40
5,98
7,80
8,60
9,30
4,57
5,70
6,50
7,00
5,68
6,80
7,90
8,60
3,52
3,60
3,80
4,10
2,84
3,00
3,10
3,40
3,52
3,70
3,90'
4,10
3,61
3,70
3,90
4,10
2,86
3,00
3,20
3,40
3,05
3,20
3,40
3,60
3,68
4,00
4,30
4,40
6,27
7,20
7,80
8,20
5,25
6,00
6,90
7,10
5,71
6,80
7,40
7,80
6,49
7,50
8,10
8,40
5,44
6,40
6,80
7,30
5,93D
7 , 6 0
i ;5,46
t
s
ι
[image:17.595.15.573.64.782.2]Table 2 (cont'd)
HOURLY LABOUR COSTS IN INDUSTRY 1975 - 1978 b) in EUA
10
-•
•
manual + non manual workers
N A C E
34 35 36 37 41/ 42 43 44 45 Electrical engineering Manufacture of motor vehicles and of motor vehicle parts and accessories Manufacture of
other means of transport
Instrument engineering
[image:19.595.28.570.90.757.2]Table 2 (cont'd)
HOURLY LABOUR COSTS IN INDUSTRY 1975 - I978 b) in EUA
11 -manual + non -manual workers
N A C E
Ρ
NLΒ
UK DK [image:21.595.43.575.74.758.2]f
i
c
>
o
co
o
—i