Patterns of Transcriptional Regulation in Primary
Astrocytes
Wayne Chadwick1.
, John P. Boyle2.
, Yu Zhou1, Liyun Wang1, Sung-Soo Park1, Bronwen Martin3, Rui Wang3, Kevin G. Becker4, William H. Wood III4, Yongqing Zhang4, Chris Peers2*", Stuart Maudsley1*"
1Receptor Pharmacology Unit, National Institute on Aging, National Institutes of Health, Baltimore, Maryland, United States of America,2Institute for Cardiovascular Research, Leeds Institute of Genetics, Health and Therapeutics, University of Leeds, Leeds, West Yorkshire, United Kingdom,3Metabolism Unit, National Institute on Aging, National Institutes of Health, Baltimore, Maryland, United States of America,4Gene Expression and Genomics Unit, Research Resources Branch, National Institute on Aging, National Institutes of Health, Baltimore, Maryland, United States of America
Abstract
The central nervous system normally functions at O2levels which would be regarded as hypoxic by most other tissues.
However, most in vitro studies of neurons and astrocytes are conducted under hyperoxic conditions without consideration of O2-dependent cellular adaptation. We analyzed the reactivity of astrocytes to 1, 4 and 9% O2tensions compared to the
cell culture standard of 20% O2, to investigate their ability to sense and translate this O2information to transcriptional
activity. Variance of ambient O2tension for rat astrocytes resulted in profound changes in ribosomal activity, cytoskeletal
and energy-regulatory mechanisms and cytokine-related signaling. Clustering of transcriptional regulation patterns revealed four distinct response pattern groups that directionally pivoted around the 4% O2 tension, or demonstrated coherent
ascending/decreasing gene expression patterns in response to diverse oxygen tensions. Immune response and cell cycle/ cancer-related signaling pathway transcriptomic subsets were significantly activated with increasing hypoxia, whilst hemostatic and cardiovascular signaling mechanisms were attenuated with increasing hypoxia. Our data indicate that variant O2tensions induce specific and physiologically-focused transcript regulation patterns that may underpin important
physiological mechanisms that connect higher neurological activity to astrocytic function and ambient oxygen environments. These strongly defined patterns demonstrate a strong bias for physiological transcript programs to pivot around the 4% O2 tension, while uni-modal programs that do not, appear more related to pathological actions. The
functional interaction of these transcriptional ‘programs’ may serve to regulate the dynamic vascular responsivity of the central nervous system during periods of stress or heightened activity.
Citation:Chadwick W, Boyle JP, Zhou Y, Wang L, Park S-S, et al. (2011) Multiple Oxygen Tension Environments Reveal Diverse Patterns of Transcriptional Regulation in Primary Astrocytes. PLoS ONE 6(6): e21638. doi:10.1371/journal.pone.0021638
Editor:Rafael Linden, Universidade Federal do Rio de Janeiro, Brazil ReceivedMarch 1, 2011;AcceptedJune 4, 2011;PublishedJune 27, 2011
This is an open-access article, free of all copyright, and may be freely reproduced, distributed, transmitted, modified, built upon, or otherwise used by anyone for any lawful purpose. The work is made available under the Creative Commons CC0 public domain dedication.
Funding:This work was carried out by funding from the Intramural Research Program of the National Institute on Aging/National Institutes of Health, the Alzheimer’s Research Trust (ART/PG 2006/1), The Alzheimer’s Society and the Medical Research Council. The funders had no role in study design, data collection and analysis, decision to publish, or preparation of the manuscript.
Competing Interests:The authors have declared that no competing interests exist. * E-mail: maudsleyst@mail.nih.gov (SM); c.s.peers@leeds.ac.uk (CP)
.These authors contributed equally to this work. "These authors also contributed equally to this work.
Introduction
Normal brain function has an absolute requirement for a con-tinuous supply of O2, yet it is considered particularly susceptible
to oxidative damage. This has been postulated to arise because of the high levels of central nervous system (CNS) O2consumption,
which is employed to generate ATP primarily through oxidative phosphorylation [1]. This profound energy dependence requires high levels of mitochondrial activity which, along with the pre-sence of excitotoxic and oxidizable neurotransmitters and large, transient Ca2+ fluxes, contribute to a high degree of potential oxidative stress. Such stress is imposed not only on neurons but also on glia, and although both neurons and glia have antioxidant defense mechanisms [2], the simplest approach to avoiding oxida-tive stress is to keep brain O2 levels as low as possible without
compromising oxidative phosphorylation. Astrocytes are of par-ticular importance in this regard, as they are now known to regulate local blood supply to match local neuronal activity with remarkable speed and precision [3,4]. Thus, they are of major importance in the control of cerebral blood flow and, hence, brain O2levels.
The strategy of maintaining brain O2at low but sufficient levels
results in reported pO2 values ranging from ca. 20–30 mmHg
despite arterial pO2 levels being ca. 90 mmHg. Indeed, some
estimates have suggested that some 50% of brain regions normally exist at a pO2 of below 10 mmHg [1,5]. This value therefore
lungs or distribution by the vasculature, e.g.sleep apnea. If such hypoxia persists, this can predispose individuals to CNS damage, and markedly increases the likelihood of developing progressive dementias such as Alzheimer’s disease (AD) [6]. Indeed, we and others have previously shown that hypoxia in vitro leads to in-creased production of amyloid peptides (Ab) associated with AD [6,7,8].
Local O2 levels, either hyperoxic or hypoxic, are now
recog-nized as a major determinant of gene expression in all tissues examined to date. Numerous transcription factors (e.g. hypoxia inducible factor (HIF) and nuclear factor kappa B (NF-kB)) are known to be activated in hypoxia, and control the expression of large numbers of genes [9]. Such altered gene transcription and expression is of fundamental importance in the development of multiple tissue disorders such as cancers and dementias [10]. Given the importance of the relative abundance, or paucity, of O2
to such activity, and the uniquely low levels of O2which can be
regarded as normoxic in the brain, it is perhaps surprising that no systematic, unbiased, study of physiologically relevant levels of O2
on gene transcription in primary cortical astrocytic tissue has been previously conducted. We have shown previously that the relative abundance of oxygen (and oxygen-derived reactive species) can exert significant effects upon CNS pathological protein metabo-lism [6–8], as well as strongly regulate the pharmacogenomic ‘signatures’ of transmembrane receptor signaling systems [11,12]. As the relative oxygen levels in the CNS are likely to demonstrate a high dynamic flux, an understanding of the responsiveness at the cellular level to this, may assist in the development of CNS-targeted anti-neurodegenerative therapeutic strategies. Under-standing how the CNS system reacts and functions at diverse oxygen tensions may also benefit the rational development of drug-like agents with specific ‘context-sensitive’ efficacies and potencies [11,13].
Here, we report the effects of various O2 levels on gene
transcription and protein expression profiles in cortical astrocytes, employing levels of O2which can be regarded as physiologically
normoxic, hypoxic and, importantly hyperoxic, a condition which is commonly imposed on these and other primary cultured cells when typically studied in vitro. Our data indicates that clearly defined, specific ‘morphometric’ response patterns to varying O2
tensions exist, that bear distinct and functionally relevant pheno-types to CNS health. An enhanced appreciation of the alterations in the CNS environment during altered O2tension will likely assist
the development of novel therapies that may demonstrate specific efficacy in separate areas of the brain experiencing divergent levels of perfusion.
Materials and Methods
Primary astrocyte cultures
Primary cultures of rat cortical astrocytes were obtained as previously described [14]. All animal care and experimental procedures, performed under code (A(SP)A-86), followed United Kingdom Home Office Animals Scientific Procedures guidelines. Animal care and experimental procedures followed United King-dom Home Office regulations (code A(SP)A-86) and were con-ducted under the project licence PPL 40/3356 held by Professor C. S. Peers, following the official United Kingdom Home Office Animals Scientific Procedures guidelines. In brief, cerebral cortices were removed from 6–8-day-old Wistar rats and placed in ice-cold phosphate-buffered solution (PBS) containing: 8 mM NaH2PO4,
2.7 mM KCl, 138 mM NaCl, and 2.7 mM KH2PO4.
Multiply-dissected cortices were dispersed into the same buffer containing 0.25 mg/mL trypsin, at 37uC for 15 min. Digestion was halted by
the addition of an equal volume of buffer supplemented with 16mg/mL soy bean trypsin inhibitor (type I-S; Sigma, Poole, Dorset, UK), 20 U/mL DNase I (EC 3.1.21.1 type II from bovine pancreas; Sigma) and 1.6 mM MgSO4. The tissue was then
pel-leted by centrifugation at 10006gfor 1 min and the supernatant was poured off before resuspending the cell pellet in 6.8 mL of buffer solution containing 100mg/mL soy bean trypsin inhibitor, 125 U/mL DNase I and 10 mM MgSO4. The tissue was
subsequently triturated and, after allowing larger pieces of tissue to settle, the cell suspension was pipetted into media (Eagle’s minimal essential medium supplemented with 10% fetal calf serum (v/v) and 1% (v/v) penicillin-streptomycin (Gibco, Paisley, UK)). The cell suspension was then aliquoted into 75 cm2flasks. Cells were then maintained in a humidified incubator at 37uC (95% air; 5% CO2). Four to six hours following plating, cells were washed
twice with fresh media to remove non-adherent cells. This resulted in a culture of cortical astrocytes, as confirmed by visual inspection the following day and later by glial fibrillary acidic protein immunohistochemistry (data not shown). Any cortical astrocyte culture that was not homogenous was disposed of and not used in this study. Culture medium was exchanged every 7 days and cells were grown in culture for up to 14 days. In some cases, cells were exposed to chronic hypoxia; 24 hr prior to experimentation cells were transferred to a humidified incubator or hypoxic workstation both equilibrated with 1, 4 or 9% O2, 5% CO2, and the remaining
percentage gas N2. Control cells were maintained in a 95% air,
5% CO2incubator for the same time period.
Once cortical astrocytes had reached approximately 90% con-fluence (75 cm2 flask) they were subjected to hypoxia or nor-moxia, as above, washed with PBS, removed from the flask base with 0.05% trypsin-EDTA (Gibco) and then gently centrifuged (5006g). The cell pellet was then re-suspended in PBS and centrifuged twice more to remove any traces of media. The cell pellet was then: a) if required for RNA analysis; triturated in 8–10 volumes of RNAlater (Applied Biosystems), frozen and stored at 280uC until analysis; b) if required for the analysis of proteins; re-suspended in either 10–15 volumes of M-PER reagent (Pierce-Perbio, UK) supplemented with a Complete mini protease inhibitor tablet (Roche Applied Science) or an equivalent volume of a chaotropic solution (7 M Urea, 4% CHAPS, 30 mM Tris at pH 8.5). These samples were frozen and stored at 280uC until analysis.
RNA extraction
RNA isolation was carried out using the Qiagen RNeasy Mini Kit for cell extraction (Qiagen, Inc. Valencia CA). The cells were lysed in the proprietary buffer and then centrifuged. The super-natant was transferred to a second tube and centrifuged again to clear any remaining cellular debris. The supernatant was added to 95% ethanol, mixed and added to the proprietary binding columns. The columns were centrifuged, washed several times and the bound RNA was eluted using water. The RNA quality and quantity was checked using an Agilent 2100 Bio-analyzer and the RNA 6000 nano-chips. As an index of RNA quality we assessed the mean 28S/18S ribosomal RNA values for the samples. The ideal ratio of 28S/18S for intact RNA is 2.0, our measured 28S/ 18S ratio was 1.9860.06 (mean6standard error of mean).
Microarray hybridization and analysis
and then copied to produce double-stranded cDNA molecules. The double stranded cDNA was cleaned and concentrated with the supplied columns and used in an overnightin vitrotranscription reaction where single-stranded RNA (cRNA) was generated and labeled by incorporation of biotin-16-UTP. A total of 0.75mg of biotin-labeled cRNA was hybridized at 58uC for 16 h to Illumina’s Sentrix MouseRef-8 Expression BeadChips (Illumina, San Diego, CA). Each BeadChip has 24,000 well-annotated RefSeq tran-scripts with approximately 30-fold redundancy. The arrays were washed, blocked and the labeled cRNA was detected by staining with streptavidin-Cy3. The arrays were scanned using an Illumina BeadStation 5006 Genetic Analysis Systems scanner and the image data extracted using the Illumina BeadStudio software, Version 3.0.
Microarray data analysis
Microarray data were analyzed using DIANE 6.0, a spread-sheet-based microarray analysis program based on SAS JMP7.0 system. Raw microarray data were subjected to filtering and normalization and tested for significant changes as described previously [15]. Raw hybridization intensity data were log-transformed and normalized to yield z-scores, which in turn were used to calculate a z-ratio value for each gene transcript with respect to the control tissues. The z-ratio was calculated as the difference between the observed gene z-scores for the experimental and the control comparisons, and dividing by the standard deviation associated with the distribution of these differences [15]. Z-ratio values $+1.5 or #21.5 were chosen as cut-off values, defining increased and decreased expression, respectively. Array data were analyzed using DIANE 6.0, a spreadsheet-based micro-array analysis program based on the SAS JMP7.0 system. Raw microarray data were subjected to filtering and Znormalization and tested for significant changes as described previously [15]. Briefly, sample quality was analyzed by scatter plot followed by gene filtering as follows. A false discovery rate (FDR) cut-off , 0.01 was applied, which controls for the expected proportion of falsely rejected hypotheses. Subsequent remaining genomic data, possessing a z-ratio of$1.5 (6), were further analyzed using a two-way ANOVA design with significance set at p#0.05. Significantly-regulated genes that fulfilled all these criteria were assigned a selector score of63 (+, upregulated:2, downregulated) to indicate that they possess a z-ratio of$1.5(6), FDR of#0.01 and an ANOVA p#0.05. Array data for each experimental oxygen tension condition was additionally subjected to hierarchi-cally k-means clustering in DIANE 6.0/Ilumina BeadStudio Version 1.5 to investigate the presence of oxygen tension-related transitional transcriptomic patterns. We have deposited the raw data at GEO/ArrayExpress under accession number GSE29296, we can confirm all details are MIAME compliant.
Bioinformatic geneset analysis
After identifying individual genes that were significantly regulated by different oxygen tensions, the gene lists were analyzed further using multiple forms of functional annotational clustering, i.e. principal component analysis and k-means clustering (using DIANE 6.0/JMP7.0), parametric geneset enrichment analysis (PAGE) [16] using the Broad Institute Molecular Signatures Database (MSigDB: http://www.broadinstitute.org/gsea/msigdb/) canonical signaling pathway (CanPath) or functional network prediction analysis using Ingenuity Pathway Analysis (IPA: http:// www.ingenuity.com/). For PAGE/CanPath analyses similar ge-nomic statistical criteria were employed to ensure significant CanPath and PAGE gene collection ‘population’. For each form of grouping, at least two genes were required to fill the requisite
group/pathway at a significance of at least p,0.05. For CanPath functional grouping, a single amenable numeric index was created (hybrid score) by multiplying the relative enrichment (to a species-specific background set) factor (R) with the negative log10of the
probability of enrichment. For MSigDB annotation a cumulate Z score (positive or negative) for a specific PAGE gene collection was calculated using the sum of the z ratios of the individual genes clustering significantly into that PAGE collection. In addition to parametric geneset enrichment and IPA CanPath/functional network analysis, we also performed latent semantic indexing (LSI) textual analysis using GeneIndexer (https://computablegenomix. com/geneindexer/) as described previously [11,12,17].
Western blotting
Whole cell astrocyte lysates were created using M-PER protein extraction reagent (Pierce-Thermo Scientific, Rockford IL) or an in-house developed NP-40-based lysis buffer [18]. Protein extract concentrations were measured using a standard BCA assay kit (Pierce-Thermo Scientific, Rockford IL) and then normalized to 1 mg/mL of total protein using the appropriate extraction buffer. Protein extracts (20mg total per lane) were then resolved on Bis-Tris 4–12% gradient polyacrylamide gels (Invitrogen, Carlsbad CA) before electrotransfer to polyvinylenediflouride (PVDF) mem-branes (Perkin Elmer Life, Waltham, MA). PVDF memmem-branes were then blocked with Blotto (ThermoFisher Scientific, Waltham MA) for one hour before incubation with specific primary antisera at 1:1000 dilutions followed by five washing cycles in Tris (10 mM)-buffered saline and then incubation with a 1:10,000 dilution of a species-specific alkaline-phosphatase conjugated secondary antisera (Sigma Aldrich, St. Louis, MO). Presence of immunoreactive bands was detected by a one minute incubation with an enzyme-linked chemifluorescent developing reagent (GE Healthcare, Piscataway, NJ) followed by scanning with a Typhoon 9410 variable-mode phosphorimager (GE Healthcare, Piscataway, NJ). Antisera for the specific proteins identified were obtained as follows: anti-c-fos was from Sigma Aldrich (St. Louis, MO); anti-Flot1(flotilin-1) was from BD Bioscience (Chicago, IL); anti-Cst-3 (cystatin-C) was from LSBio (Seattle, WA); anti-Gclc (glutamate-cysteine ligase, catalytic subunit), anti-Gclm (glutamate-cysteine ligase, modifier subunit), anti-Txnip (thioredoxin interacting protein) anti-Timp1 (TIMP metallopeptidase inhibitor 1), anti-Adm (adrenomedullin), anti-Chrdl1 (chordin-like 1), anti-Ucp2 (uncoupling protein-2), anti-Zmpste24(zinc metalloprotease similar to yeast Ste24p), anti-Dcn (decorin), anti-Adk (adenosine kinase) were from Abcam (Cambridge, MA); anti-Vps34/Pik3c3 (phos-phoinositide-3-kinase, class III) was obtained from Novus Bio-logicals (Littleton, CO); anti-Cxcl12/Sdf1-a (stromal cell-derived factors 1-alpha) was obtained from Abnova (Walnut, CA); anti-Calr (calreticulin), anti-Gsk3-b (glycogen synthase kinase beta), anti-Sirt2 (silent mating type information 2-homolog), anti-Vim (vimentin) and anti-Calm (calmodulin) were from Cell Signaling Technology (Danvers, MA).
Results
extracted RNA (18S, 28S RNA) across samples. A representative quantitation of the 28S/18S ratio is included in the inset. The individual, significantly regulated, gene lists for each experimental oxygen tension, compared to the standard control condition (atmospheric 20% O2), are listed in Tables S1 (1% O2), S2 (4%
O2) and S3 (9% O2). Employing a z ratio cut-off (61.5 compared
to the mean) the z ratios of the genes significantly altered (relative to 20% O2control) by the different oxygen tensions are depicted
in the heatmap in Figure 1B. In addition to the z ratio heatmap, using the three-way significant criteria described in Materials and Methods a selector score for all the genes that satisfy this criteria is indicated (upregulated +3, downregulated 23). All of the experimental oxygen tensions (1, 4, 9% O2) caused the significant
alteration of hundreds of genes to generally similar z-ratio extents, ranging from a 11-fold (logarithmic) increase to a similar level of decrease. The highest number of significantly altered genes was
noted in response to the most extreme level of oxygen tension (1% O2) reduction compared to control (Figure 1C). Upon inspection
of the relative z ratio extent of gene regulation, each of the experimental oxygen tensions induced a similar mean up or down-regulation of genes (Figure 1D), however the 1% oxygen tension did generate the greatest mean elevation in gene transcription (1% O2-2.58, 4% O2-2.11, 9% O2-2.09). In each ambient oxygen
tension paradigm however, it was noted that a greater number of genes were significantly downregulated, compared to those upregulated when compared to control (20% O2) conditions.
Basic oxygen tension-dependent transcriptomic analysis With respect to specific gene regulation induced by switching to 1% O2tension from the cell culture-standard 20% O2tension, we
[image:4.612.65.555.55.423.2]identified multiple highly upregulated genes that have previously been linked to hypoxia,e.g. Vegfa[19],hypoxia-induced gene 1[20], Figure 1. Primary transcriptional oxygen tension-dependent responses in astrocytes. (A) Principal component analysis of triplicate transcriptomic datasets generated from primary astrocytes exposed to 1 (z 1% O2#1, 2, 3), 4 (z 4% O2#1, 2, 3), 9 (z 9% O2#1, 2, 3) or 20% (z 20%
O2#1, 2, 3) ambient oxygen conditions for 24 hours. Inset panel presents an RNA electropherogram of isolated RNA from the various samples
(kilo-basepair (kbp) mass – M; control – C; 1% O2– 1%; 4% O2– 4%; 9% O2– 9%) as well as a representative 28S(green)/18S(pink) fluorescence
quantification trace employed for RNA quality control. (B) Left panel, individual gene transcriptional z ratios (with associated heatmap key) and gene selector scores (based on criteria mentioned in Methods: right panel) for gene array datasets from astrocytes experiencing 1, 4, 9% O2conditions
relative to the expression level at 20% O2. Gene selector scores of63 indicate compliance with stringent limitations of z ratio, FDR and probability.
(C) z ratio expression profile of significantly regulated transcripts in astrocytes exposed to 1% (red circles), 4% (blue) or 9% (green) ambient O2
conditions. (D) Mean6standard deviations of z ratios for significantly, up- or down-regulated, genes after exposure to 1, 4, or 9% O2conditions. The
specific numbers of up or downregulated genes are indicated in white in each histogram bar. Statistical analysis, Student’s t-test, was performed using GraphPad Prism version 5.02 (GraphPad Software Inc.).p#0.05 = *,p#0.01 = **,p#0.001 = ***. Non-significant differences are indicated by numerical p values.
hexokinase[21] andInsig1[22] (Table S1). It was evident that many of the genes highly upregulated by the 1% O2environment were
directed to ribosomal activity (e.g. Rpl10, Rpl41, Rps10, Rps18, Rpl29,Rps27), heat shock factor expression (Hspa8,Hspb1,Hspca) and energy regulation/metabolism (Pgk1, Tpi1, Pdk1, Pygl). In addition to these transcripts, multiple iron-management factors were also highly upregulated,e.g.ferritin light chain 1 and 2 (Ftl1, Ftl2) and ferritin heavy polypeptide (Fth1). One of the most highly downregulated factors was gap junction membrane channel protein beta 2 (Gjb2), potentially suggesting a link to alterations in blood flow mechanisms [23].
Inspecting the gene regulation at the 4% O2 tension
com-pared to the 20% O2tension (Table S2), typical hypoxia-regulated
factors such as carbonic anhydrase 3, lipocalin-2 [24] and prostacyclin synthase [25] were all strongly upregulated (Table S2). As with the 1% O2tension geneset, there was a strong
ribo-somally-directed component, as well as a profound heat shock/ chaperone-directed component. Among the relatively novel genes demonstrated to be responsive to this O2 level, we noted a
significant transcriptional potentiation of jagged 1 (Jag1) [26] and pre-proenkephalin (Penk-rs) [27]. Significant downregulation of several transcripts linked to functional hypoxia was also observed, e.g. aurora kinase B [28] and uncoupling protein 2 [29]. In addition, the lipid raft associated protein, flotilin-1, was also noted to be down regulated at the 4% O2level relative to 20% O2. At
the 9% O2 tension, markers of functional hypoxia were again
evident,i.e.carbonic anhydrase 3, prostacyclin synthase andHig-1 (Table S3). In addition to these factors, we also demonstrated a profound upregulation of the WNT1 inducible signaling pathway protein 2 (Wisp2) [30] and basigin (Bsg) [31]. With regards to the downregulated factors at the 9% O2 tension level, we noted a
strong chronological timing component, as Per1, Per2 and Cry1 were all significantly downregulated. The heatshock/immune function gene,Schlafen-3was also significantly downregulated.
Multiple oxygen tension-dependent transcriptional activity relationships
We have demonstrated that the O2responsive genesets, at our
[image:5.612.59.556.345.678.2]three experimental tensions, indicate significant changes in both classical and novel oxygen-sensitive factors in the primary cortical astrocytes. We next investigated the relationships between the identities of the genes uniquely regulated, or regulated by more than one oxygen tension using Venn diagram analysis. The resultant proportional Venn diagram for the gene set intersections between the specific oxygen tension-regulated dataset is depicted in Figure 2A. The gene identities in the respective unique (A, B, C) and intersected subsets (D, E, F, G) are listed in Table S4. Using this simple Venn diagram separation, it was evident that for each experimental oxygen tension, a relatively unique overall tran-scriptomic phenotype existed (Figure 2A). For example, at each specific experimental oxygen tension the majority of the significantly regulated transcripts were unique to that oxygen
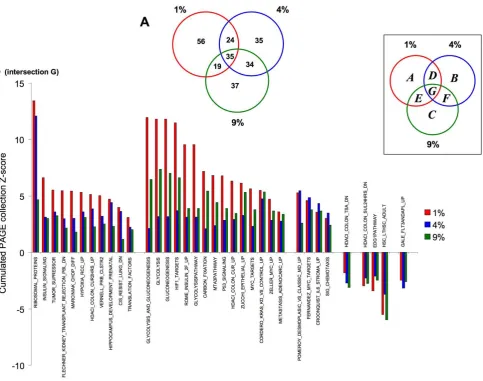
Figure 2. Venn diagram analysis of oxygen tension-dependent transcriptional responses in primary astrocytes. (A) Three-way proportional Venn diagram for transcriptional responses (compared to ambient 20% O2) for 24 hour exposure to 1% (red circle), 4% (blue circle) and
9% (green circle) ambient oxygen tension. The intersection subsets (A–G) are specified in the associated boxed key. (B) Oxygen tension-dependent variations in transcriptional regulation of multi-tension responsive genes from intersection G (1% O2, red; 4% O2, blue; 9% O2, green).
tension, i.e. 63.2%, 54.2% and 56.4% of the transcripts were uniquely regulated at 1%, 4% or 9% O2respectively (Figure 2A,
sets A, B, C according to associated key). This primarily unique oxygen tension response reinforces the highly distinguished PCA clustering observed in Figure 1A. The number of shared (between at least two individual tensions) significantly-regulated transcripts between the three experimental oxygen tensions were relatively similar (Figure 2A). The smallest intersection set was the group of transcripts common to all the experimental oxygen conditions (Figure 2A).
With respect to the analyses of the genes compartmentalized into the respective intersections, we rationalized the subsets into the following hypothetical groups. Specific subsets of transcripts may regulate astrocyte responsiveness to broad-range dynamic changes in ambient oxygen tensions: ‘multi-tension’ responsive genes (Figure 2A, intersection G: altered in response to 1%, 4% and 9% O2 relative to 20% O2); ‘low tension-responsive’ genes (Figure 2A,
Table S5, intersection D: significantly regulated in 1–4% O2);
‘intermediate-tension’ oxygen responsive (Figure 2A, Table S6, intersection F: significantly regulated in 4–9% O2); ‘cross-tension’
responsive (Figure 2A, Table S7, intersection E: significantly regulated in 1–9% O2). In each of the Venn intersections in
Figure 2, the majority of transcripts common to two or more oxygen tensions demonstrated similar directions of regulation (up-or downregulation). The percentage of significantly regulated transcripts identified at all oxygen tensions (Figure 2A, intersection G) that demonstrated diverse polarities of regulation was only 16.7% (10 transcripts out of 60: Figure 2B). Similar percentages of transcripts, common between at least two oxygen tensions but with differing regulation polarities, were observed for the other Venn diagram intersections in Figure 2: 1–4% - 14 out of 128 (10.9%); 1–9% - 28 out of 121 (23.1%); 4–9% - 17 out of 116 (14.6%). Therefore it seemed that reversal of transcriptional regulation in astrocytes between different oxygen tensions is a relatively rare event. The large number of transcripts that are uniquely and significantly regulated at only one O2tension (Figure 2A, sets A, B,
C) may represent discrete functional gene groups that control steady-state cellular function during constant O2 tensions.
Con-versely, the significantly-regulated transcripts in the intersections, D, E, F and G may therefore control dynamic responses to fluctuations in ambient O2tensions.
With respect to the upregulated multi-tension responsive group (Table S4, G: Figure 2B), notable inclusions were the chemokine orphan receptor 1 (Cmkor1), prostacyclin synthase (Ptgis), glyceral-dehyde 3 phosphate dehydrogenase (Gapdh), laminin receptor 1 (Lamr1) and phosphoglycerate kinase 1 (Pgk1). The expression of the chemokine orphan receptor 1 (also known as CXCR7) has recently been demonstrated to be controlled by oxygen levels in the central nervous system [32]. However, ours is the first demonstration of coherent oxygen tension-mediated regulation of this transcript in rat cortical astrocytic cells. As with our previous global transcription analysis (Tables S1, S2, S3), we noted that a specifically upregulated ribosomal activity signature was present in this specific intersection (ribosomal protein L21,Rpl21: Figure 2B). Among this multi-tension group we also noted that there were multiple hypoxia-related factors that demonstrated divergent pola-rities of transcript regulation between 1-4-9% O2 tensions, e.g.
adrenomedullin (Adm) [33,34], Mdm2 (mouse double minute 2) [35],Tnfrsf11b(tumor necrosis factor receptor superfamily, mem-ber 11b) [36] and Nedd9 (neural precursor cell expressed, developmentally down-regulated 9) [37] (Figure 2B). In addition to these hypoxia-associated factors, several other novel transcripts demonstrated this divergent regulatory behavior, e.g. Dspg3 (der-matan sulphate proteoglycan 3) and the neuronally-responsive
obesity-related gene Mtch2 [38]. Interestingly, two factors de-monstrated an upregulation at 4% O2but downregulation at the
other oxygen tensions, i.e. the neurotrophin receptor signaling modulator Ndr4 (Ndrg4) [39,40] and the hypoxemia-associated Gstp1(glutathione s-transferase pi 1) [41]. Our data also suggest the presence of entirely novel astrocytic oxygen-responsive factors, such as Tec tyrosine kinase (Tec) [42], nidogen 2 (Nid2) [43], tweety (Ttyh1) [44] and tenomodulin (Tnmd) [45].
Thelow tension-responsive genesets (regulated at both 1 and 4% O2: Table S5) demonstrated a significant divergence of functional
output, as the upregulated genes in this subset were again pro-foundly dominated by ribosomal factors,i.e.59.1% of upregulated shared transcripts were ribosomal genes (e.g.Rpl41, Rps8,Rpl29, Rps27 etc.), while there were no downregulated ribosomally-related transcripts. Among the upregulated transcripts there were also factors associated with prolyl amino acid metabolism and neuro-degeneration such asPin1(peptidyl prolylisomerase). The down-regulatedlow tension-responsive transcripts were more functionally diverse than the corresponding upregulated subset,i.e.significant downregulation of genes controlling G protein-coupled receptor function (Gprasp1-GPCR-associated sorting protein-1, Gpr23-G protein-coupled receptor23, Gpr51-G protein-coupled receptor 51), cell viability (Sesn1-sestrin-1,Tsn-translin), cell signaling (Stk6/ Aurka-serine/threonine kinase 6, Ptgds-prostaglandin d-synthase), and perhaps most importantly considering the primary functions of astrocytes, cell to cell communication/junction formation (Aqp1 -aquaporin,Gjb2-gap junction membrane channel protein beta 2, Vezt-vezatin,Dcn-decorin).
The intermediate tension-responsive subsets (regulated at both 4 and 9% O2: Table S6) also demonstrated a significant enrichment
of ribosomally-connected upregulated transcripts (17% of upre-gulated transcripts were ribosomally-associated). In addition to the multiple ribosomal transcripts, several factors directly linked to hypoxic environments,e.g. carbonic anhydrase (Ca3), lipocalin 2 (Lcn2) [24] and biglycan (Bgn) [46] were significantly upregulated in this subset. Along with these transcripts we noted a significant upregulation in latexin (Lxn), a specific inhibitor of zinc-dependent metallocarboxypeptidases, and the growth factor Gdf10. Within the downregulatedintermediate tension-responsive geneset there were several genes involved in maintenance of endothelial function (Esm1-endothelial cell-specific molecule 1: Edg2-lysophosphatidic acid receptor) and a series of genes controlling cell surface receptor expression (Arl6ip6-ADP-ribosylation-like factor 6-interacting pro-tein 6, Sorl1-sortilin-related receptor, P2rxl1-purinergic receptor P2X-like 1,Tfr-transferrin,Dnai2-dynein).
The cross-tension responsive gene subset (regulated at both 1% and 9% O2: Table S7) was again strongly divided between up and
peripheral tissues such as the heart [47], was downregulated in the cortical astrocytes. However, it should be noted that in the Westberg study [47], the stanniocalcin transcriptional upregula-tion was induced by a hypoxic precondiupregula-tioning acupregula-tion, rather than a chronic exposure, as in our paradigm. Amongst the downreg-ulated transcripts in thecross-tensionsubset (Table S7), there were functional groups involved with transcriptional regulation (Zfp426 -zinc finger protein 426, -zinc finger,Morc2-CW-type with coiled-coil domain 1, Zfp36-zinc finger protein 36), protein trafficking (Snx14-sorting nexin 14,Srpr-signal recognition particle receptor) and structural/connective component regulators (Adamts9-A dis-integrin-like and metalloprotease (reprolysin type) with thrombos-pondin type 1 motif 9,Srrm2-serine/arginine repetitive matrix 2, Fbn2-fibrillin 2, Agrn-agrin). Downregulation of several receptor-related factors linked to the amelioration of cell damage or hypoxic stress was also observed in the cross-tension subset, e.g. aryl hy-drocarbon receptor (Ahr), which was recently linked to hypoxic regulation of carbonic anhydrases [48]. In addition to downreg-ulation of this receptor we also noted reductions in the levels of the latrophilin (Lphn1) and platelet-derived growth factor (PDGF) (Pdgfra) receptors. It has been previously shown thata-latrotoxin, the active component in black widow spider venom, can selectively stimulate astrocytic cells, inducing death [49], therefore Lphn1 downregulation would be beneficial in times of stress. G protein-coupled receptors can transactivate PDGF receptors [50], and GPCR ligands such as angiotensin appear to control astrocyte growth via PDGF receptors [51]. Therefore, during periodic hypertension or ischemic stress, alterations in PDGF receptor sig-naling may control astrocyte proliferation or activation of down-stream transcription factors such as myc. Reinforcing this concept, was our observation that N-myc downstream-regulated 4 (Ndr4) was also significantly downregulated in thiscross-tensionsubset.
Parametric geneset enrichment analysis
To fully exploit the depth of transcriptomic information contained within any specific geneset, it is crucial to perform as great a functional correlational analysis between individual genes as possible. It is clear that concerted gene group responses underpin multiple and diverse areas of biology [15,52]. Therefore computational analysis and clustering of genes into specific and unbiased functional groups is vital to fully appreciate the subtleties of transcriptional responses to environmental or experimental per-turbations and place a physiological relevance to the experimental regulation of individual genes.
To investigate higher-order transcriptional functionality, para-metric geneset enrichment analysis (PAGE) was performed using the MSigDB gene collections (http://www.broad.mit.edu/gsea/ msigdb/index.jsp). Significant gene population of a given PAGE geneset collection is created by the inclusion of multiple genes ($2 per PAGE pathway collection: p#0.05) with the resultant z ratio scores being summated to create a total PAGE pathway collection overall Z-score. Therefore signaling pathway groups, possessing many co-upregulated genes will possess a strong positive Z-score, and those significantly populated by multiple correlated downreg-ulated genes will possess a negative Z-score. The complete signi-ficantly-populated PAGE pathway collection diagrams generated by the three specific O2tension genesets (compared to 20% O2)
are represented in Figure S1, and summarized in Tables S8, S9, S10 (Figure S1A-1% O2, Table S8; Figure S1B-4% O2, Table S9;
Figure S1C-9% O2, Table S10). To reduce the inherent
com-plexity of multiple PAGE analyses, we grouped related functional pathways (10 highest-scoring) to highlight their specific relation-ship to the divergent oxygen tensions (Figure 3). PAGE pathways that demonstrated significant (p#0.05) transcript population were
grouped into functional areas controlling: oxygen tension res-ponses (Figure 3A); receptor-mediated processes (Figure 3B); energy metabolism (Figure 3C); neurophysiology and pathology (Figure 3D); cytokine physiology (Figure 3E) and transcriptional/ translational activity (Figure 3F). Demonstrating the strongin vivo physiological correlation of our astrocytic culture conditions, we identified multiple oxygen-responsive pathways strongly repre-sented in our datasets (Figure 3A: MENSE HYPOXIA UP, HYPOXIA REVIEW, HYPOXIA REG UP, HYPOXIA FIBRO UP, HIF1 TARGETS). In addition to the positive cumulative pathway Z-scores of these sets, we also observed a negative score (indicative of multiple down-regulated genes operating in a concerted man-ner) for PAGE collections typically downregulated with hypoxia (MANALO_HYPOXIA_DN). While hypoxia and oxidative stresses may be considered biophysical phenomena, many of the func-tional effects of such conditions appear to bear signaling simi-larities to receptor-mediated effects [12]. In line with this, a strong linkage of the oxygen tension-modulated sets was observed with receptor functions (Figure 3B), including G protein coupled (GPCRS_CLASS_A_RHODOPSIN_LIKE,CXCR4PATHWAY), inte-grin-related (ST_INTEGRIN_SIGNALING_PATHWAY) and recep-tor tyrosine kinase receprecep-tors (EPHA4PATHWAY). Oxidative stresses may disrupt cellular energetics by causing a mechanistic shift away from mitochondrial oxidative phosphorylation to other forms of cellular energy production [11]. Indeed, we observed a strong clustering of upregulated energy-regulatory pathways associated with alternative energy production mechanisms (Figure 3C: GLYCOLYSIS_AND_GLUCONEOGENESIS,PPARAPATHWAY), with a concomitant down-regulation of the mitochondrial oxidative phosphorylation functions (ELECTRON_TRANSPORT,MOOTHA_ VOXPHOS, MITOCHONDRIA_PATHWAY). As oxidative and hypoxic events are often associated with the aging process and pathology [2,7,8,11] we extracted PAGE pathways associated with these functions (Figure 3D). We noted that there was strong positive transcript population of age-related pathways (AGED_MOUSE_ CORTEX_UP, ALZHEIMERS_DISEASE_UP), with a coherent negative population of converse pathways ( ALZHEIMERS_DISEA-SE_DN, AGEING_BRAIN_DN). In addition to oxidative events, nervous system aging has also been strongly associated with attenua-tion of funcattenua-tional stem cell capacity [53]. In accordance with this, we noted that hypoxic conditions downregulated transcripts controlling the upregulation of stem cell populations (Figure 3D; STEM_CELL_COMMON_DN, STEMCELL_EMBRYONIC_UP), indicating a potential ‘pro-aging’ phenotype of the datasets. Interestingly, we also noted that there were several other aging– related groups (HG PROGERIA DN,OLDAGE DN: Table S9, Table S10) that were profoundly populated (with negative cumulative Z-scores) suggesting that an effect of higher oxygen tension may be to prematurely age cell populations.
synthetic (RIBOSOMAL_PROTEINS,TRNA_SYNTHETASES) and stress-response pathways (STRESS_P53_SPECIFIC_UP), cellular development pathways were inhibited (negative transcript popu-lation of SHH_UP) and cell cycle inhibitory pathways were antagonized (SMITH_HTERT_DN) (Figure 3F).
We next analyzed the transitional relationships of PAGE col-lections between oxygen tensions (Figure 4), in a similar manner to the primary gene transcripts. The Venn diagram distribution of the PAGE pathway collections demonstrated a greater functional similarity, compared to gene transcripts, between PAGE collections across the different O2 tensions. Hence, the
percentages of PAGE collections unique to each tension were lower than those for the gene distribution (Figure 2A) (1% O2
-41.8%; 4% O2-27.3%; 9% O2-29.6%), suggesting a degree of
functional convergence between datasets. The specific PAGE
[image:8.612.61.542.60.455.2]collections found in the annotated intersections (Figure 4, A–G) are listed in Table S11. Thelow tensionresponsive PAGE group (Table S11, D) was primarily composed of growth factor and developmental PAGE collections (HIPPOCAMPUS DEVELOP-MENT POSTNATAL,EGF HDMEC UP,IFN BETA GLIOMA DN, ST INTEGRIN SIGNALING PATHWAY). The intermediate tension responsive group (Table S11, F) again was interestingly devoid of energetic, hypoxic or ribosomal pathways, yet possessed a strong representation of cytoskeletal pathways (RHOPATHWAY, SIG REGULATION OF THE ACTIN CYTOSKELETON BY RHO GTPASES). Thecross-tensionresponsive group (Table S11, E) also failed to demonstrate any strong ribosomal or energy regulation bias but did contain several pathways linked to cellular signaling (P38MAPKPATHWAY, CALCINEURIN NF AT SIGNALING, PTDINSPATHWAY).
Figure 3. Focused MSigDB PAGE pathway collection analysis of oxygen tension-dependent gene transcription.(A) Oxygen-tension related PAGE gene pathway collections generated by the multiple oxygen tension environments. (B) Receptor signaling-related PAGE gene pathway collections generated by the multiple oxygen tension environments. (C) Energy regulation-related PAGE gene pathway collections generated by the multiple oxygen tension environments. (D) Aging- related PAGE gene pathway collections generated by the multiple oxygen tension environments. (E) Cytokine-related PAGE gene pathway collections generated by the multiple oxygen tension environments. (F) Translation and stress-response-related PAGE gene pathway collections generated by the multiple oxygen tension environments. The magnitude of the specific pathway collection cumulative z-scores are indicated in the scale at the bottom of each histogram (A–F). Filled color bars indicate PAGE collections populated with genes with a positive cumulated z-score, striped bars indicate PAGE collections populated with genes with a negative cumulated z-score. Each PAGE pathway collection group was significantly populated by at least two separate genes with a co-probability of p#0.05.
In sharp contrast to the primary gene distribution (Figure 2A), there were proportionately a greater number ofmulti-tensionPAGE collections common between all three experimental oxygen tensions (Table S11, G). Out of these, many were directly related to hypoxic responses, ribosomal activity or glucose regulation, suggesting that the astrocytes may possess several transcriptomic ‘programs’ that can coherently respond across a wide range of ambient oxygen tensions. In a profound contrast to thismulti-tension group, the other major intersections of upregulated pathways did not share such a diverse functional ‘signature’. The specific transitional nature of PAGE collection population for this multi-tensionset is depicted in Figure 4B. Multiple PAGE collections in this intersection-G (31% ofmulti-tension PAGEs) demonstrated an ascending increase of Z-score with reduced oxygen tension (e.g. RIBOSOMAL PROTEINS, INSULIN SIGNALING, TUMOR SUP-PRESSION, HYPOXIA RCC UP). However the most consistent oxygen tension-dependent trend of regulation, was increased Z scores at 1% or 9% O2, pivoting around the 4% O2level (43% of
themulti-tensionPAGEs in intersection G). This pattern of PAGE regulation included important pathways involved in energy
regulation (GLYCOLYSIS AND GLUCONEOGENESIS, GLYCOLY-SIS PATHWAY, CARBON FIXATION), cell growth and develop-ment (P53 SIGNALING,MYC TARGETS,METASTASIS ADENO-CARC UP) and classical hypoxia-related factors (HIF1 TARGETS). As there seemed to be important transitional changes,e.g.pivoting around 4% O2, in signaling pathways (composed of multiple,
functionally-related transcripts) between the diverse oxygen environments we decided to evaluate the importance of these transitional regulatory patterns usingk-meansclustering [55] across the multiple O2tensions.
Morphometric analysis of oxygen tension transitional responses in primary cortical astrocytes
Hierarchicalk-meansclustering was performed using the primary transcriptomic datasets generated from the three different oxygen tension conditions compared to the 20% control O2. Simultaneous
[image:9.612.70.554.59.440.2]clustering of all three experimental datasets, using DIANE-6.0/ SAS-JMP7.0, into clusters that possessed similar directions of transcription changes across the three experimental oxygen tensions (relative to 20% O2) generated 40 specific gene clusters
Figure 4. Venn diagram analysis of oxygen tension-dependent transcriptional PAGE gene collection population in primary astrocytes.(A) Three-way proportional Venn diagram for transcriptional responses (compared to ambient 20% O2) for 24 hour exposure to 1% (red
circle), 4% (blue circle) and 9% (green circle) ambient oxygen tension. The intersection subsets (A–G) are specified in the associated boxed key. (B) Oxygen tension-dependent variations in transcriptional regulation of multi-tension responsive genes from intersection G (1% O2, red; 4% O2, blue; 9%
O2, green).
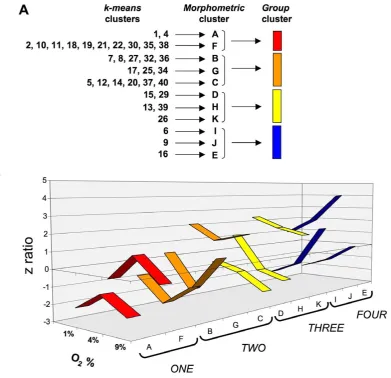
(Figure 5A, Table S12). These 40 k-means clusters were highly divergent with respect to the number of significantly-regulated genes contained within them,i.e.ranging between only one gene to 197 genes (Figure 5B). The average number of transcripts in each cluster was 40.967.98 (standard error of mean). Due to this high diversity ofk-meansclusters present within the transcript datasets, we chose to simplify the multiplek-meansclusters through pattern analysis. The initial 40 clusters were therefore first contracted into multiple, morphometrically-classed clusters (morphometric clus-ters: A–K), based on the transitional gene regulation polarity across the O2tensions, and then into color-coded, larger group
[image:10.612.66.550.292.651.2]clusters (ONE-TWO-THREE-FOUR) (Figure 6A, B). The oxygen tension transitional patterning of these morphometric and group clusters, across the experimental oxygen tensions, is depicted in Figure 6B. Hence group cluster ONE demonstrates transcript elevation at 4% O2compared to 1% and 9% O2. Group cluster
TWO demonstrates transcript reduction at 4% O2compared to
1% and 9% O2. Group cluster THREE represents consistent
potentiation of transcription with increasing hypoxia, while group cluster FOUR demonstrates the opposite pattern to cluster
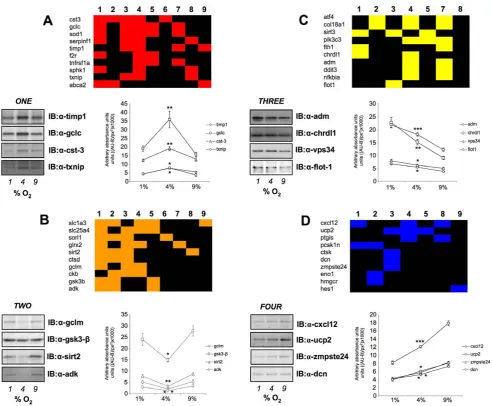
THREE. To demonstrate the strong morphometric relationship of all the original 40k-meansclusters that were compressed into the group clusters ONE-FOUR, we averaged (6 standard error) the mean z ratios across the three experimental tensions for all the genes in the k-means clusters (Figure 7A–D). This analysis demonstrated a strong and significant coherency of the four distinct group clusters of oxygen-sensitive transcripts. We addi-tionally performed western blot analysis, for the gene products of exemplars from each group cluster (ONEtoFOUR), upon protein lysates from astrocytes exposed to the various oxygen tensions, to confirm the transcriptional variation seen with our array data (Figure 7E–I). Each of the exemplar gene products assessed (c-fos, Calr,Vim, Calm) demonstrated a similar oxygen tension response pattern of protein expression, when compared to the group cluster mean gene transcript regulation (Figure 7E–I).
Physiological and phenotypic characterization of oxygen-tension sensitive astrocyte transcriptome clusters
To create a generalized assessment of the physiological signaling significance of the specific group clusters (and regulated genes
Figure 5. K-means clustering analysis of oxygen tension-dependent transcriptional responses in rat primary astrocytes. (A) HierarchicalK-meansclustering of gene transcriptional responses in astrocytes to 24 hour exposure to 1, 4 or 9% O2conditions relative to the
transcriptional expression levels at 20% O2tension.K-meansclustering attempts to group together transcriptional activity with similar trends across
the multiple O2tensions. Colored blocks and the associated dendrogram structure indicate the gross nature of the identified hierarchicalk-means
functional activity clusters. (B) Histogram represents the numbers of significantly regulated genes in the most distinct gene transcriptional activity clusters numbered 1 to 40. Hierarchical clustering was performed and mathematically assessed using DIANE 6.0/JMP across the three oxygen tensions.
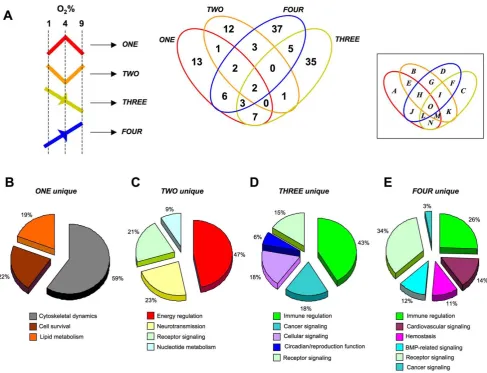
therein) identified within the astrocyte datasets (ONEtoFOUR), we performed an unbiased canonical signaling pathway analysis (Ingenuity Pathway Analysis v. 8.5). Venn diagram delineation of the significantly populated (p#0.05, at least two genes per pathway) canonical pathways demonstrated that the four group clusters contained primarily distinct signaling functions, with only a small degree of cross-over (Figure 8A: Table S13). Clustering of the significantly-regulated signaling pathways unique to group cluster ONE (Table S14), were primarily concerned with cytos-keletal architecture control, cell death/survival control and lipid metabolism (Figure 8B). The pathways unique to group cluster TWO (the morphometric inverse of group cluster ONE), unsur-prisingly demonstrated a distinct signaling phenotype, i.e. the signaling pathways were associated with energy regulation, nucleo-tide metabolism and inhibitory neurotransmission (Figure 8C: Table S14). As with group clusters ONE and TWO, groups THREEandFOURwere characterized by their opposite oxygen tension-regulated behavior. Superficially however, we noted some similarities in the signaling pathway output of these groups, i.e. both involved cellular signaling pathways associated with immune regulation and receptor signaling (Figure 8D, E). The specific predicted nature of the immune regulation and receptor signaling
[image:11.612.69.461.61.439.2]pathways however demonstrated a significant functional diver-gence (Table S14). For example, the receptor signaling profile of cluster THREE consisted of glucocorticoid, endothelin-1, angiopoietin, erythropoeitin, neurotrophin and estrogen receptor signaling, while the receptor profile in group FOUR consisted of dopamine, melatonin, glutamate, chemokine (Cxcr4), insulin-like growth factor-1, corticotropin-releasing hormoneandandrogenreceptor signaling instead (Table S14). The largest gross functional differences observed between group clusters THREE and FOUR involved the significantly larger representation of cancer-related pathways in group THREE, compared toFOUR, as well as the presence of hemostatic, bone-metabolism and cardiovascular signaling groups specifically in group clusterFOUR. It therefore appeared that, along with their morphometric divergences,i.e.group clusters ONE/TWOversus THREE/FOUR, their predicted signaling profile was quite distinct as well. In general terms it appeared that group clustersONEand TWO were more strongly associated with more physiological processes associated with astrocytes, while group clustersTHREE andFOURwere more linked to pathology-associated actions. This partitioning may be due to morphometric basis of the dynamic responsiveness of these groups,i.e. ONEandTWOdemonstrate bi-modal regulation and a fulcrum around 4% O2, whileTHREE
Figure 6. Clustering compression for primary oxygen tension transitionalk-meansanalysis.(A) Specific description of compression of k-meansclusters into morphometric clusters (A–K) and eventually four group clusters (ONE-FOUR). (B) Numerical z ratio comparisons of individual morphometric clusters that comprise the larger group clustering (ONE-FOUR).
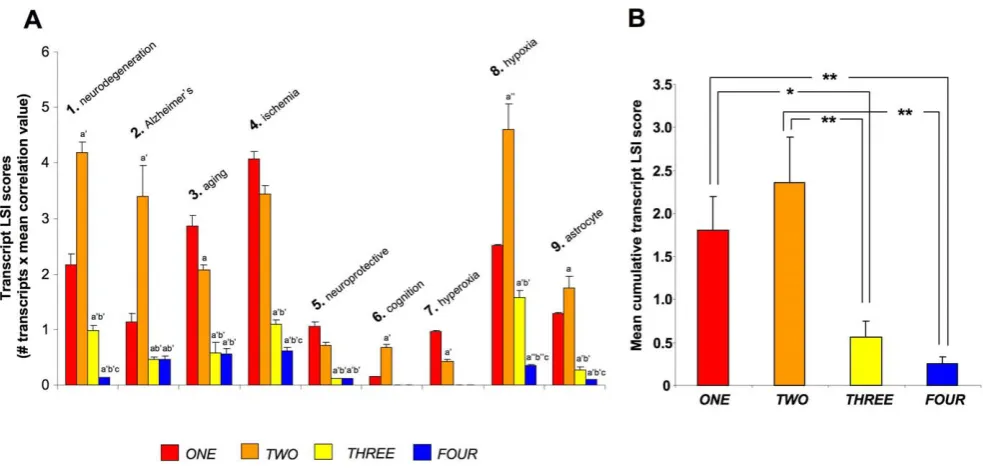
and FOUR seem merely responsive to progressive and non-fluctuating changes in oxygen tension. To test this hypothesis we utilized GeneIndexer to perform latent semantic indexing (LSI), a bioinformatic process that allows multidimensional correlation of user-defined ‘interrogation’ terms with the significantly regulated transcripts within a dataset [11,12,17]. Using LSI we interrogated the transcripts contained in the four group clusters (ONEtoFOUR) with terms related to potential astrocyte functions as well as neurological activity (terms 1–9: Figure 9). LSI correlation scores for genes in the group cluster lists with the input interrogation terms were only considered if they were.0.1 (i.e.demonstrating implicit correlation). Two-way matrices of the implicitly correlated
[image:12.612.71.551.62.521.2]transcripts within the group clusters (indicated with colored blocks in the matrix) with the specific input interrogation terms are depicted in Figure S2 (ONE), Figure S3 (TWO), Figure S4 (THREE) and Figure S5 (FOUR). The ten most highly correlated (greatest LSI correlation score across multiple interrogation terms) transcripts from each group cluster LSI matrix are indicated in Figure 9 (9A-ONE, 9B-TWO, 9C-THREE, 9D-FOUR), along with specific western blot protein validation of multiple significantly-regulated transcripts from each group cluster. Each of the gene products assessed, from the four group clusters, demonstrated similar oxygen tension response patterns to their original group cluster designation. Interestingly, multiple examples of the Figure 7. Astrocyte oxygen tension-dependent transcript group cluster structure.Panels (A) (groupONE), (B) (groupTWO), (C) (group THREE) and (D) (groupFOUR) represent the mean 6standard error, group cluster z ratios generated fromk-meansclustering across the three experimental oxygen tensions. (E) Coomassie-stained gel demonstrating equal total protein loading from astrocyte cultures exposed to the multiple oxygen tensions. Representative western blots for exemplar proteins from each group are depicted and additionally quantified in panels (F–I). Protein expression is represented via measurement of immunoreactive absorbance units with background subtraction per square pixel ((AU-B)/px2). Statistical
transcripts, that were in the top ten highest correlations to the input GeneIndexer interrogation terms (Figure 9A–D), also formed key nodes within the most statistically reliable, functional gene networks created using the Ingenuity Pathway Analysis (IPA) network-creating algorithm (Figure S6; Table S15). This may suggest that the LSI analysis has extracted highly relevant and functionally co-related genes in each of the group clusters. For example, in clusterONE, bothCst-3andTimp1were in the top ten of LSI correlations and were present in the highest ranking functional interaction network (Figure 9A, Figure S6A). In cluster TWO, both Adk and Sirt2 were identified by both techniques (Figure 9B, Figure S6B). For cluster THREE, we co-identified three separate transcripts using combined LSI and IPA-network analysis,i.e. Vps34/Pik3c3,Ddit3 andCol18a1 (Figure 9C, Figure S6C). With respect to group cluster FOUR, using both LSI and IPA network analysis, we co-identified Dcn, Cxcl12 and Ucp2 (Figure 9D, Figure S6D).
In agreement with our previous analyses, the general predicted functions of the highest scoring gene networks (generated using IPA algorithms) also displayed a variance between clustersONE/ TWOandTHREE/FOUR. ClustersONEandTWOdemonstrated
a functional linkage, as both were associated with physiological homeostatic and synthetic regulatory mechanisms (top predicted network functions:ONE-cellular assembly and organization, cel-lular function and maintenance, protein synthesis: TWO-cellular development, protein synthesis, carbohydrate metabolism) (Figure S6; Table S15). In contrast, the highest scoring gene interaction networks present in clustersTHREEandFOUR, were more closely associated with pathology and homeostatic disruption (Top pre-dicted network functions: THREE-metabolic disease, renal and urological disease, cell death: FOUR-endocrine system disorders, cellular assembly and organization, metabolic disease) (Figure S6; Table S15).
[image:13.612.63.551.59.432.2]To further investigate these potential gross functional differ-ences in the four group clusters we compared, using a novel methodology, the cumulative cluster transcript LSI scores. Cu-mulative transcript LSI scores were calculated as follows: the number of implicitly correlated transcripts in each group cluster linked to a specific interrogation term (Table S16), were multiplied by the mean correlation score of the transcripts implicitly associated with the input interrogation term (Table S17). It was evident from this comparison that clusters ONE and TWO Figure 8. Canonical signaling pathway analysis of group cluster composition. (A) Four way Venn diagram analysis of significantly populated canonical signaling pathways populated by group clusters ONE, TWO, THREEandFOUR. (B–E) Proportional pie charts created from multiple associated canonical signaling pathwayhybridscores generated by the group cluster-unique (B-ONE unique;C-TWOunique;D-THREE unique;E-FOURunique) signaling pathways populated by at least two genes with a co-probability of at least#0.05. Associated percentage values indicate the relative distribution of the respective pathway scores for each unique group cluster.
demonstrated a much stronger association with astrocyte-related functions as well as neurological activities, compared to group clusters THREE and FOUR (Figure 10A). Averaging across the multiple transcript/interrogation term correlations, we demonstrat-ed that group clusters ONE and TWO possessed a statistically significantly greater cumulative transcript LSI score compared clustersTHREEandFOUR(Figure 10B). Therefore it seems that the group clusters characterized by bi-modal sensitivities to oxygen tension, that pivot around 4% O2, appear to be more associated
with physiological responses when compared to theTHREE/FOUR uni-modal clusters. These findings may suggest that distinct, and physiologically specific, transcriptional programs can be elicited by subtle differences in the dynamic nature of oxygen tension modu-lation in astrocytes. Therefore, from our transcriptional-transitional
profile analysis, it appears that cortical astrocytes potentially possess multiple modes of response to their ambient oxygen tensions and that these can entrain distinct, functional activities mediated by diverse, yet synergistic, cellular signaling systems.
Discussion
[image:14.612.60.553.52.458.2]In this study we have investigated, in a multidimensional manner, how alterations in ambient oxygen tension can affect the transcriptional activity of primary rat astrocytes. With the appli-cation, and transition between, multiple ambient oxygen tension environments, we have noted that primary cortical astrocytic cells generate considerable transcriptomic changes. Many of the pat-terns of transcriptional activity suggest the presence of underlying Figure 9. Latent Semantic Indexing analysis of group clusters ONE, TWO, THREE, FOUR with astrocytic and neurophysiological activities.Significantly regulated transcripts from the four respective group clusters (ONE-FOUR) were individually analyzed by latent semantic indexing (LSI) using GeneIndexer with the following user-defined interrogation terms: 1-neurodegeneration; 2-Alzheimer’s; 3-aging; 4-ischemia; 5-neuroprotective; 6-cognition; 7-hyperoxia; 8-hypoxia; 9-astrocyte. (A) Block matrix of the ten highest LSI correlating genes from groupONEaccording to each interrogation term (numbered 1–9 atop the block). Four selected genes were verified from each group cluster LSI block. The quantitative and statistical analysis of at least three separate westerns for each chosen protein is indicated in each panel. Statistical significance of the variation of the 1% and 9% datapoints from the 4% O2datapoint is demonstrated in a manner similar to that previously performed (Figure 7A–D). This similar form of statistical analysis was
subsequently performed for panels B–D. (B) Block matrix of the ten highest LSI correlating genes from groupTWO. (C) Block matrix of the ten highest LSI correlating genes from groupTHREE. (D) Block matrix of the ten highest LSI correlating genes from groupFOUR. Input interrogation terms not implicitly correlating with any significantly regulated transcripts in panels (C) and (D) were omitted from the matrix. Statistical significance was estimated with a Student’s t-test using GraphPad Prism version 5.02 (GraphPad Software Inc.).p#0.05 = *,p#0.01 = **,p#0.001 = ***.
‘programs’ of co-regulated transcripts, that are differentially sen-sitive to multiple levels of ambient oxygen tension.
Astrocytes form a specific population of glial cells that not only create part of the blood brain barrier, but also represent a point of control of the global cerebral vascular blood flow. Astrocytes are often found in close intimate contact with microvessels in the brain and their ability to release vasodilatory or vasoconstrictory factors in response to neuronal activity allows them to divert away, or increase perfusion of blood to different areas of the brain [4]. Additionally, in response to local vascular injury it would be beneficial to reduce the flow to that region if there is considerable vascular damage. In the converse scenario, astro-cytes may also be required to increase perfusion to areas of the brain that may be temporarily ischemic. With respect to these functional attributes it is not surprising that astrocytes have been demonstrated to be exquisitely sensitive to ambient oxygen tensions [56]. We have exposed primary cortical rat astrocytes to multiple levels of ambient oxygen tension in our experimental paradigms,i.e.1%, 4%, 9% and the standard atmospheric oxy-gen tension, 20% O2. These levels were selected as we considered
4% O2 to potentially represent physiological normoxia for the
CNS [1,5], and so 1% O2 represents relative CNS hypoxia,
elative hyperoxia was examined at 9% O2(considered normoxic
in other tissues) and 20%, which is the standard condition for tissue culture. We have demonstrated that there are highly significant, and contextually intricate, variances in the transcrip-tomic responses of cortical astrocytes at these different oxygen tensions. This finding is crucial with respect to many of the current experimental conditions employed by the majority of research groups. Thus,in vitroculture of neurons and astrocytes is commonly conducted using humidified atmospheres of 95% air, 5% CO2,i.e.20% O2, clearly a hyperoxic situation compared to
in vivo‘‘normoxia’’. Thus, we contend that there will be profound
differences in cellular physiology between cells maintained at the ambient oxygen tension and oxygen tensions more likely to occur in the central nervous tissue.
With regards to specific transcriptomic changes induced by different oxygen environments, relative to the standard 20% O2
culture condition, we noted the profound downregulation ofGjb2 (gap junction membrane channel protein beta 2), in response to 1% O2exposure. This gene encodes for the protein connexin 26
which has been linked to congenital deafness that is often induced by congenital anoxia [57]. Interestingly, with respect to the involvement of hypoxic conditions in potential neurodegenerative mechanisms, we detected a profound downregulation of the beta amyloid binding precursor (Bbp) [58] and the neuronal regener-ation-related protein (Nrep) [59] with exposure to 1% O2. The
modulation of expression of the lipid raft marker, flotillin-1, may also be important both for synaptic transmission (post-synaptic densities are commonly associated with lipid-rich areas) and organization/control of amyloid precursor protein metabolism, as the Ab-forming gamma secretase enzyme complex is also enriched in lipid raft areas [60]. In addition, flotillin-1 was also recently identified as a functional binding partner for the reversible oxygen binding protein neuroglobin [61].
Correlating to the oxygen tension-modulated alteration of clock-related transcripts,Per1,Per2andCry1and those linked to protein chaperoning and immune function (e.g. Schlafen-3) (downregulated at 9% O2 compared to 20% O2 control: Table S3) we also
[image:15.612.61.553.53.289.2]observed a significant population of many cell cycle/cancer-related and immune-cycle/cancer-related canonical signaling pathways (Table S14), suggesting strong causative links between oxygen tension exposure in astrocytes and potential cancer/cell development/cell cycle regulatory issues [62]. Indeed, a re-entry into the cell cycle of even post-mitotic neurons has been suggested as a potential pro-neurodegenerative mechanism [63].
Figure 10. Comparative analysis of group cluster gene correlation scores to astrocytic and neurophysiological activity terms.(A) Representation of the mean transcript LSI score for the four group cluster genesets analyzed with nine separate LSI GeneIndexer interrogation terms. The numerical value of each bar was calculated by the multiplication of the number of implicitly correlated genes for each group cluster (ONE-FOUR )-interrogation term (1–9) pair, with the number of implicitly-correlated genes present for each group cluster-)-interrogation term pair. Statistical significance is indicated as follows:TWO,THREE,FOURcompared toONE,p#0.05 = a,p#0.01 = a9,p#0.001 = a0;THREE,FOUR, compared toTWO, p#0.05 = b,p#0.01 = b9,p#0.001 = b0;FOURcompared toTHREE,p#0.05 = c,p#0.01 = c9,p#0.001 = c0. (B) Mean cumulative transcript LSI scores (6
standard error) for all of the nine interrogation terms for each complete group cluster. Statistical significance was estimated with a Student’s t-test using GraphPad Prism version 5.02 (GraphPad Software Inc.).p#0.05 = *,p#0.01 = **,p#0.001 = ***.
When investigating transcripts that demonstrated cross-oxygen tension regulation patterns, we noted several factors that could functionally control neurological functions via their responsivity to ambient oxygen conditions. In our observedlow tension-responsive set (Table S4), we identified the upregulation of peptidyl proly-lisomerase gene (Pin1), which has been strongly implicated in modification of the pathology of Alzheimer’s disease [60,63]; connective tissue growth factor (Ctgf) whose expression and effects upon cellular morphology and rearrangement are oxygen sensitive [64] and metallothienein (Mt1a), that has been previously shown to control anti-apoptotic mechanisms induced by anoxic/hypoxic conditions [65]. In our observed intermediate tension-responsive set (Table S4, F), several other important neurological factors were revealed, e.g. latexin (Lxn) and growth differentiation factor 10 (Gdf10) were both seen to be upregulated in this subset. Latexin, a zinc-dependent metallocarboxypeptidase, has recently been dem-onstrated to possess the capacity to form long-lasting and highly-stable multioligomeric highly-stable structures in response to stress, in a similar manner to beta-amyloid protein [66], while Gdf10 (a controller of cellular development, also known as bone morpho-genic protein 3B) expression is positively regulated by both Sox-9 and hypoxic mechanisms [67].
Performing PAGE analysis, to generate a higher order of appre-ciation of the oxygen-dependent transcriptomic responses, we were able to appreciate the broader picture of the functional relevance of the multiple genetic observations recorded. One interesting finding was the clear demonstration of a protein synthetic response ‘pivot’ for cortical astrocytes, (Figure S1B, compared to S1A and S1C). In addition to this protein synthetic pivot, a strong tumor-suppressor and cytokine-related functional phenotype was dominant at the 4% O2tension (Figure 3). Importantly, this oxygen tension may indeed
be indicative of the true normoxic condition in central nervous astrocytes [1]. We selected 4% O2 as an experimental oxygen
tension since the majority of brain tissue normally exists at or below this level: 1% O2therefore represents hypoxia to most nervous tissue
whilst 9% O2 may represent small arteriolar levels and 20% O2
represents levels experienced by most cells in conventional tissue culture. Using morphometric-based clustering of the transcriptomic data (Figures 6, 7), we were able to further characterize important response profiles of the astrocytes in a manner that indicates a potentially wide degree of functional sensitivity in these cells. It was interesting to note that each of the larger morphometric group clusters we statistically identified (ONE, TWO, THREE, FOUR), when analyzed for their potential cell signaling activity, demon-strated relatively unique phenotypes (Figure 8). The two most different, from a signaling perspective, were interestingly the two ‘pivoting’ groups (ONEandTWO). GroupONE(and the regulated transcripts therein) seemed likely to manage cytoskeletal dynamics and lipid metabolism, which could potentially indicate a strong role of these genes in modulating neurotransmission in the central nervous system [60,61]. Group TWO, also possessing a similar regulation polarity ‘pivot’ around the 4% O2tension, was primarily
linked to energy regulation and inhibitory mechanisms in neuro-transmission (e.g.GABA receptor signaling, Table S14). As with our previous data, it appears that astrocytes display a form of ‘stability sensor’ for 4% O2, and thus coordinate distinct signaling pathways
dependent on any subsequent change in ambient O2tension with
unique and diverse genetic programs (Figures 9, 10).
Therefore, using successive unbiased clustering techniques, we have identified four morphometrically-distinct transcription ‘programs’ in cortical astrocytes (ONE-FOUR) (Figure 6). As we have seen, these four transcript clusters presented two distinct morphometric patterns, i.e. those with a transcriptional polarity pivot around the 4% O2tension (presumed normoxic: (ONEand
TWO) and those with a uni-modal transcriptional progression (THREEand FOUR) (Figure 7). A simple interpretation of such transcription models may suggest that the bi-modal groups represent ‘programs’ of transcripts important for homeostasis of the astrocytic function, while the uni-modal programs indicate responses to continuous or uncontrolled oxidative changes in the CNS. Potentially reinforcing this hypothesis we found, with application of multiple and diverse bioinformatic techniques, that the bi-modal clusters (ONE and TWO) actually demonstrated a functional homeostatic and physiological phenotype (Figures 8, 10) while the uni-modal clusters (THREE and FOUR) possessed a more pathology-related phenotype. Therefore it may be likely that rather than regulating individual transcripts randomly across multiple oxygen environments, astrocytes needing to regulate local vascular tone and neuronal activity, possess concerted transcrip-tional ‘programs’ that are engaged in a transitranscrip-tional-activity- transitional-activity-dependent manner. Such clustering of transcriptional responses would likely aid rapid minute-to-minute control of complex cellular functions such as release of vasoconstrictory agents and neuroprotective behavior. Analysis of the nature of the specific transcripts clustered together in these different group clusters, indicated several potentially interesting aspects to the oxygen tension regulation of cortical astrocyte function. For example, in cluster ONEand TWO respectively, we confirmed the presence and regulation of both Gclc (glutamate-cysteine ligase catalytic subunit) and Gclm (Glutamate-cysteine ligase modifier subunit). These two factors have both recently been intricately implicated in astrocytic stress response mechanisms involving the Nrf2 signaling pathway [68]. The silent mating type information regulation 2, homolog (Sirt2), confirmed in clusterTWO, has been previously demonstrated to play a crucial role in stress response activities associated with aging [69].Sirt2has also been recently implicated in oxygen tension-related homeostasis, through a regulatory control of the 14-3-3 scaffolding protein and the apoptosis-related factorBad[70]. In addition, we identified and confirmed, in cluster THREE, the regulation profile of chordin-like 1 (Chrdl1).Chrdl1is a bone morphogenetic protein-4 antagonist [71], that has also been demonstrated to act as a regulator of blood vessel dynamics and angiogenesis in retinal pericytes [72]. The progressive increase of expression ofChrdl1with ascending hypoxia, therefore may also indicate a similar role in cortical astrocytic tissue. In clusterFOUR we found that Cxcl12 expression was successively reduced by increasing hypoxia. The chemokine CXC motif, ligand 12 (Cxcl12), also known as stromal cell-derived factor 1, is a member of the secreted small cytokine family that is considered to be a strong developmental factor in the central nervous system. With respect to its astrocytic activity, Cxcl12 has also recently been implicated in cytotoxic pathways in astrocytes linked to NF-kB and cyclooxygenase-2 [73], suggesting a potentially complex functional role for this protein in the CNS.
While our data has assisted in generating a broader appreciation of the dynamic astrocyte responses to ambient oxygen tensions, we have also demonstrated that gross significant changes can be created, between potentially physiological-CNS oxygen tensions, and the cell culture standard of 20% O2. We repeatedly identified