All Numbers Are Not Equal: An
Electrophysiological Investigation of
Small and Large Number Representations
The Harvard community has made this
article openly available.
Please share
how
this access benefits you. Your story matters
Citation
Hyde, Daniel Charles, and Elizabeth S. Spelke. 2009. All numbers
are not equal: An electrophysiological investigation of small and
large number representations. Journal of Cognitive Neuroscience
21(6): 1039-1053.
Published Version
doi:10.1162/jocn.2009.21090
Citable link
http://nrs.harvard.edu/urn-3:HUL.InstRepos:10269045
All Numbers Are Not Equal: An Electrophysiological
Investigation of Small and Large
Number Representations
Daniel C. Hyde and Elizabeth S. Spelke
Abstract
& Behavioral and brain imaging research indicates that human
infants, humans adults, and many nonhuman animals repre-sent large nonsymbolic numbers approximately, discriminating between sets with a ratio limit on accuracy. Some behavioral evidence, especially with human infants, suggests that these representations differ from representations of small numbers of objects. To investigate neural signatures of this distinction, event-related potentials were recorded as adult humans pas-sively viewed the sequential presentation of dot arrays in an adaptation paradigm. In two studies, subjects viewed suc-cessive arrays of a single number of dots interspersed with test arrays presenting the same or a different number; numeri-cal range (small numerinumeri-cal quantities 1–3 vs. large numerinumeri-cal
quantities 8–24) and ratio difference varied across blocks as continuous variables were controlled. An early-evoked compo-nent (N1), observed over widespread posterior scalp locations, was modulated by absolute number with small, but not large, number arrays. In contrast, a later component (P2p), observed over the same scalp locations, was modulated by the ratio dif-ference between arrays for large, but not small, numbers. De-spite many years of experience with symbolic systems that apply equally to all numbers, adults spontaneously process small and large numbers differently. They appear to treat small-number arrays as individual objects to be tracked through space and time, and large-number arrays as cardinal values to be compared and manipulated. &
INTRODUCTION
From an early age, humans and other animals represent the approximate numerical magnitude of large sets of objects, with a ratio limit on precision (see Feigenson, Dehaene, & Spelke, 2004 for a review). It is not clear, however, whether this ability extends to small sets of objects and allows representations of numerical magni-tude in the small-number range (3 or less). Behavioral studies suggest that sets of one, two, or three objects are represented differently from larger sets, both for human infants (e.g., Xu, 2005) and for adults (e.g., Mandler & Shebo, 1982). Nonetheless, the interpretation of these studies is controversial, as other evidence supports a common representation of small and large numerical sets in human infants (Brannon, 2002), human adults (e.g., Cordes, Gelman, & Gallistel, 2001), and nonhuman animals (e.g., Brannon & Terrace, 1998). The present ex-periments attempt to address this controversy through electrophysiological studies of human adults’ spontane-ous response to number.
Research in cognitive psychology and neuroscience has revealed a consistent signature of numerical cognition; the size of a detectable difference is a constant proportion of the original stimulus value (see Dehaene, 2007). For
example, functional magnetic resonance imaging (fMRI) experiments using an adaptation paradigm revealed a bilateral increase in BOLD signal of the intraparietal sulci in response to change in number, but not in shape, that was proportional to the ratio of change between adap-tation and test number (Piazza, Izard, Pinel, Le Bihan, & Dehaene, 2004). Furthermore, the activation patterns were observed across the same ratio changes of different numbers providing neural evidence of ratio dependent numerical encoding in accord with Weber’s law. Similar findings have been observed using a variety of behavioral and neuroimaging paradigms (Ansari, Dhital, & Siong, 2006; Cantlon, Brannon, Carter, & Pelphrey, 2006; Cordes et al., 2001; Whalen, Gallistel, & Gelman, 1999; although see Shuman & Kanwisher, 2004), but ratio dependency has yet to be tested in the small-number range.
Although a variety of brain response measures has been used to investigate numerical cognition, event-related potentials (ERPs), in response to numerical tasks, are especially well established, allowing great sensitivity to processing over time (Dehaene, 1996). ERP studies have shown a second posterior positivity (P2p), peaking around 250 msec over posterior electrode sites within the parieto-occipito-temporal junction, associated with numerical representation, estimation, and comparison processes (Libertus, Woldorff, & Brannon, 2007; Pinel, Dehaene, Riviere, & Le Bihan, 2001; Temple & Posner,
1998; Dehaene, 1996). Nevertheless, a ratio effect similar to that observed with fMRI (Ansari et al., 2006; Piazza et al., 2004) has yet to be shown electrophysiologically. Follow-ing from the cited work, ratio dependency would most likely be observed as a systematic modulation of P2p amplitude in the large-number range. If small and large nonsymbolic numbers share a common representational format, moreover, then small-number changes of the same ratio should evoke similar patterns of P2p modulation.
Alternatively, it has been proposed that small num-bers of objects are represented by parallel mechanisms of object-directed attention, such that spatial attention is recruited to the specific locations of the objects to be tracked (see Feigenson et al., 2004 for a review). On this view, arrays of three objects are not represented as a set with cardinal valuethreebut rather as an object x and an object y and an object z, each in distinct locations.If this hypothesis is correct, therefore, the brain response to small numbers may not be modulated by differences in cardinal values across arrays, but rather by the abso-lute number of objects in each array. This prediction is supported by fMRI work showing that in multiple object-tracking tasks, the BOLD response in brain areas asso-ciated with spatial attention increases as the number of objects to be tracked increases (Culham, Cavanagh, & Kanwisher, 2001; Culham et al., 1998).
Other research lends support for the differential role of attention in small-number compared to large-number processing. A recent experiment using fMRI found heightened BOLD signal in the temporal–parietal junc-tion for small nonsymbolic number comparisons and sup-pression of this region for large-number comparisons (Ansari, Lyons, van Eimeren, & Xu, 2007). The authors interpreted these results as evidence of stimulus-driven attention for small- but not large-number comparison tasks. Similarly, a recent ERP study found that the first negative component (N1) was reliably modulated by cardi-nal value for nonsymbolic arrays containing 1 to 4 objects, but not for arrays containing 6 to 10 objects (Libertus et al., 2007). An extensive literature suggests that N1 is modu-lated by the distribution of spatial attention (see Luck, 2005b; Hillyard & Anllo-Vento, 1998; Hillyard, Teder-Sa¨leja¨rvi, & Mu¨nte, 1998; Hillyard, Mangun, Luck, & Heinze, 1990, for reviews), consistent with the thesis that arrays with small numbers of objects are processed by a distinct system of object-directed attention. Nevertheless, the authors attributed these differences to sensory pro-cessing differences between the arrays presented rather than to distinct systems of numerical processing. More-over, although Ansari et al. (2007) employed proper controls to equate individual dot area, total cumulative area, and overall perimeter within blocks of small-number and within blocks of large-number comparisons, overall area was many times larger in large-number conditions compared to small-number conditions, consistent with a sensory explanation for the differing findings with small and large numbers.
The present experiments test more focused predic-tions stemming from the two systems of number hy-pothesis (Feigenson et al., 2004). First, if a small array of objects evokes spatial attention to individuals, the mag-nitude of the early attentional response (N1) to nu-merical arrays should scale with the absolute number of objects in the arrays, in the small- but not the large-number range. Second, if large-large-number arrays sponta-neously evoke summary representations of numerical magnitude to be compared and manipulated, the mag-nitude of the neural response to numerical changes, reflected in P2p amplitude, should scale with the ratio size of the change in the large- but not the small-number range. Two experiments tested these predictions by re-cording scalp potentials as subjects viewed a stream of dot arrays in an adaptation paradigm.
EXPERIMENT 1
Adult participants viewed a succession of arrays of dots while scalp potentials were measured continuously by means of a 128-channel geodesic sensor net. On sepa-rate blocks of trials, subjects were presented with either small or large numerical values (1, 2, and 3 or 8, 16, and 24). Within each block, one context number was presented on about 87% of the trials, interspersed with other numbers within the same range. Participants were asked to attentively view arrays on a computer screen in order to answer posttest questions; number was never mentioned as a dimension of interest. Analyses focused on the electrophysiological response to the infrequent test arrays, both in relation to and regardless of the numerical context in which they were presented.
Methods
Participants
Fifty-seven adult subjects (18–29 years) were recruited from the Cambridge, Massachusetts, community through posters and a Web-based study pool. Participants were offered either class credit or paid $15 for their partici-pation. Data from 9 of the 57 subjects were rejected (7 for excessive artifacts; <50% artifact-free trials in at least one experimental condition; 1 as a result of equip-ment malfunction during recording; 1 as a result of ex-perimenter error in setup). Data from the remaining 48 participants were used for analysis.
Procedure
condi-tion) or a different number of dots (number change test condition). Displays were presented for 250 msec1and separated by an interstimulus interval during which a blank gray screen appeared for a random duration between 900 and 1800 msec. This stimulus jitter was applied to reduce overlap in the ERP response to suc-cessive images (Luck, 2005a) and to reduce as much as possible the repetitive nature of the stimuli. A small white fixation cross was present during both the dis-plays and the interstimulus intervals. This method of stimulus presentation is very similar to previously con-ducted adaptation studies of numerical cognition (Izard, Dehaene-Lambertz, & Dehaene, 2008; Cantlon et al., 2006; Piazza et al., 2004). No overt response was required of participants, who were not told the experiment fo-cused on number. Participants simply were instructed to pay close attention to the displays in order to answer questions about them after the session. Breaks were given throughout the experiment and subjects were re-minded to maintain close attention during stimulus pre-sentation. Informal, open-ended posttest questioning probed participants’ encoding of the displays and ideas about the purpose of the experiment.
Design
Each subject was randomly assigned to one of three possible conditions. Each condition contained a block of adaptation to a small number of dots and an adapta-tion block to a large number of dots with correspond-ing ratio changes. Order of presentation (small-number
block first or large-number block first) was counterbal-anced across subjects. In the large-number blocks, par-ticipants were adapted to displays of 8, 16, or 24 dots with occasional test displays of 8, 16, and 24 dots. In the small-number blocks, participants were adapted to one, two, or three with occasional test displays of one, two, and three dots (see Figure 1). The order of test display presentations was random, with the constraint that a test display appeared every fourth to sixth trial.
A total of 450 trials was presented in each block for a total of 900 total trials per subject. Each of the three test conditions was presented 30 times for a total of 90 test trials per adaptation block, 180 test trials per subject. This means subjects viewed adaptation trials 80% of the time and test trials 20% of the time. Because one third of the test trials contained the same number of dots as the adaptation trials, approximately 13% of all trials contained a deviant number of dots.
Displays
[image:4.612.187.559.462.734.2]Stimuli were images of solid white dots on a gray background with a small centered fixation cross. All im-ages were created using Adobe Illustrator software. The images of dot arrays were constructed so as to control for continuous parameters other than the number of dots eliciting systematic effects. The controls, described below, are based on those originally devised by Xu and Spelke (2000), and used in a variety of studies of nu-merical cognition (e.g., Wood & Spelke, 2005; Brannon, Abbott, & Lutz, 2004).
Adaptation images were individually created, contain-ing 1, 2, 3, 8, 16, or 24 dots within a 12.25 12.25-cm envelope area. Element density, therefore, correlated positively with number of dots. Individual dot positions were selected pseudorandomly for each display with the constraint that individual dots did not overlap. Individual dots were the same size within each array and varied across arrays. Five different dot sizes were used within each adaptation number condition, vary-ing from diameters of 2.34 to 5.24 cm for 1-dot arrays, 1.65 to 3.70 cm for 2-dot arrays, 1.35 to 3.03 cm for 3-dot arrays, 0.83 to 1.85 cm for 8-dot arrays, 0.59 to 1.31 cm for 16-dot arrays, and 0.48 to 1.07 cm for 24-dot arrays. On average, individual dot size was scaled across adap-tation number conditions such that arrays with, say, eight dots had an average individual dot size that was twice the area of the average individual dot size of arrays with 16 dots. Therefore, on average, the total summed area and brightness of displays between the adaptation numerosities were equated across the different numer-ical values and individual dot size varied inversely with number in the adaptation displays.
Those properties that varied in the adaptation dis-plays (individual dot size and density) were equated in test displays and the properties that were equated in the adaptation displays varied in the test displays (total cumulative area and brightness). Small-number test dis-plays (arrays with 1, 2, or 3 dots) consisted of individual dots 2.87 cm in diameter and densities of .013 dots/cm2. Large-number test displays contained individual dots 1 cm in diameter and densities of 0.106 dots/cm2. Thus, total cumulative area and total image size/total envelope area, which were equated in the adaptation displays, scaled positively with number in the test arrays.
Controls were also implemented between small (1–3) and large (8–24) numbers, where total cumulative dot area was equated between small- and large-number con-ditions, but individual dot size varied (average dot size was larger for small numbers) between small and large numbers.
Data Acquisition and Processing
An EGI system was used to record the ongoing EEG from 128 scalp locations using a geodesic sensor net (Electrical Geodesics, Eugene, OR) as subjects passively viewed dot arrays. Signals were recorded 250 samples per second. Recordings were low-pass filtered at 40 Hz. Test trials were segmented into experimental conditions based on 200 msec of recording before and 700 msec of recording after each stimulus presentation. Trials con-taining artifacts (eye blink, eye movement, head move-ment, or excessive noise) and/or more than 10 bad channels were detected and rejected by computer algo-rithm. The remaining artifact-free trials were averaged for each of the experimental conditions for each subject. Finally, data were re-referenced and baseline corrected
to 200 msec before stimulus onset. A grand average for each cardinal value as well as for each of the ratio con-ditions (no change, small change, medium change, and large change) within the small- and large-number ranges was created for visualization and inspection purposes.
Data Analysis
Through visual inspection of the average waveform, guided by previous studies of numerical cognition (Pinel et al., 2001; Temple & Posner, 1998; Dehaene, 1996), we identified three time windows of interest corre-sponding to the major observed ERP components: P1 (75–139 msec), N1 (139–199 msec), and P2p (175– 250 msec). Given the established role of the parietal lobe in both tasks of numerical cognition and spatial attention (Piazza et al., 2004; Dehaene, Piazza, Pinel, & Cohen, 2003; Culham et al., 1998, 2001) and our in-spection of the electrophysiological scalp topography, we focused our analyses over posterior regions. To char-acterize the components conservatively, we averaged across an electrode group that included pairs of bilat-eral scalp sites over widespread parieto-occipito-temporal regions (POT): left POT junction electrodes 59, 60, 65, 66, 67, 70, 71; and right POT junction electrodes 78, 84, 85, 86, 90, 91, 92. As seen in Figure 2, these scalp site groupings closely overlapped with POT groupings from previous ERP studies of number processing (Pinel et al., 2001; Temple & Posner, 1998; Dehaene, 1996).
First, we examined the effects of cardinal value on both the mean amplitude and peak latency of the ERP response to small and large test numbers on two early posterior components (P1, N1 defined above) for the average response over POT region (defined above). Test trials2 of each cardinal value (1, 2, 3, 8, 16, 24) were averaged across all subjects, creating experimental con-ditions that included test trials of each cardinal value in every context (e.g., 1 in the adaptation context of 1, 2, and 3). Responses to different numbers were compared using a repeated measures ANOVA with number range (large and small) and cardinal value (lowest value, mid-dle value, highest value) as within-subject factors.
(L-MC); large number–large change (L-LC) (content of each condition is displayed in Table 1). Organized in this way, every subject received six of the eight experi-mental conditions and all subjects received a no-change test condition for both large and small numbers. Thus, 48 subjects contributed to the no-change test condi-tions, whereas 32 subjects contributed to each of the other test conditions.
Given the unbalanced nature of the design, along with the unequal samples between experimental conditions, we employed a linear mixed-model analysis to the aver-age P2p amplitude between 175 and 250 msec post-stimulus onset averaged over bilateral posterior parietal sites.3The mixed-model analysis (Cnaan, Laird, & Slasor, 1997) could most efficiently take into account between-subject and between-block variability as random effects, while testing our manipulations of the repeated within-subject fixed effects of number range (small or large) and ratio change (no change, small change, medium change, large change).
Results
Early Processing (P1)
[image:6.612.187.558.63.472.2]The ERP response revealed a significant main effect of numerical range on mean amplitude of the P1
Figure 2. Map of 128-channel geodesic sensor net. Electrode groupings used for averaging and analysis reported here and those groupings used in previous experiments are identified (Temple & Posner, 1998; Dehaene, 1996). (Original figure modified with permission from www.egi.com.)
Table 1. Ratio Changes Included in Each Experimental Condition
Small-number Changes Large-number Changes
S-NC S-SC S-MC S-LC L-NC L-SC L-MC L-LC
1–1 – 1–2 1–3 8–8 – 8–16 8–24
2–2 2–3 2–1 – 16–16 16–24 16–8 –
[image:6.612.319.557.605.694.2](75–139 msec), with small numbers eliciting greater pos-itive amplitudes than large numbers [F(1, 47) = 13.18,
p = .001]. In addition, a main effect of number range on latency was observed such that P1 peaked earlier for large numbers than for small numbers [F(1, 47) = 24.08,
p < .001]. A main effect of cardinal value on latency was also observed within each range [F(2, 94) = 21.72,
p < .001], with P1 peak latency decreasing as number increased for both small and large numbers.
Effects of Cardinal Value on N1
The analysis of N1 revealed a different pattern. A signifi-cant main effect of cardinal value [F(2, 94) = 8.86, p< .001] and a significant Number range by Cardinal value
interaction [F(2, 94) = 29.40, p< .001] were observed in mean amplitude of the N1 (140–175 msec). Post hoc analysis revealed a significant linear contrast for small numbers [F(1, 47) = 49.54,p< .001] with mean N1 am-plitude becoming more negative as cardinal value in-creased. In contrast, a significant linear contrast in the opposite direction for large numbers [F(1, 47) = 4.78,
[image:7.612.59.553.281.675.2]p= .033] was observed with amplitude becoming more positive as cardinal value increased for large numbers (see Figure 3). On the latency measure, main effects of num-ber range [F(1, 47) = 55.18,p< .001] and cardinal value [F(2, 94) = 10.07, p < .001] were observed with small numbers eliciting an N1 that peaked later compared to large numbers and with both small and large numbers showing a decrease in latency with an increase in number.
Effects of Ratio Change on P2p Amplitude
Although the early components (P1, N1) revealed no ef-fects of ratio, the P2p response revealed significant main effects for number range [F(1, 227.994) = 43.857,p < .001], ratio change [F(3, 232.686) = 2.841, p = .039], and a significant Number range by Ratio change inter-action [F(3, 227.994) = 2.939, p = .034]. In the large-number range, no-change test conditions elicited the highest P2p amplitude and P2p amplitude became more negative as change ratio between adaptation and test number increased regardless of the specific adaptation and test numbers themselves. Importantly, P2p ampli-tude was not modulated by ratio change for the small-number conditions (see Figure 4).4
Discussion
Experiment 1 yielded two main findings. First, early neg-ative scalp potentials (N1) over the posterior cortex re-vealed effects of numerical range and cardinal value, regardless of context. Specifically, the magnitude of the N1 increased as cardinal value increased for small, but not large, sets of objects. This finding accords with previous studies suggesting processing of small numbers differen-tially recruits attention compared to processing of large numbers (Ansari et al., 2007; Libertus et al., 2007).
[image:8.612.64.559.259.667.2]Second, the later rising P2p (175–250 msec) revealed an effect of numerical ratio change for large but not for small numbers. Specifically, P2p amplitude decreased as the ratio of change between adaptation and test number
increased in the large-number range, but not in the small-number range. This finding with large small-numbers accords with previous research using fMRI (Ansari et al., 2006). The contrasting findings with small numbers provide the first neurophysiological evidence for separate processing mechanisms in the small- and large-number ranges.
Nevertheless, we cannot rule out an alternative inter-pretation of this experiment: The observed processing differences may be due to differences in the individual dot sizes presented in the numerical displays, rather than differences in numerical range. In Experiment 1, as in Ansari et al. (2007), larger dots were presented in the small-number range so as to control for a host of con-tinuous quantities in the test arrays. Thus, differences in dot size, rather than in set size, may account for the pro-cessing and/or representational differences observed in Experiment 1. Experiment 2 tested this possibility.
EXPERIMENT 2
Experiment 2 replicated Experiment 1 using a different design and stimuli (after Piazza et al., 2004), both to test the generality of the effects observed with large numbers and to rule out the above alternative explanations for the effects observed with small numbers. Specifically, we equated individual dot size across small and large nu-merical displays and then tested for the specific effects of cardinal value and ratio observed in Experiment 1.
Methods
Participants
Eighteen adult subjects were recruited from the Cam-bridge, Massachusetts, community via posters and a Web-based psychology study pool. Data from two of the participants were eliminated because of excessive artifacts (<50% artifact free trials in at least one experimental con-dition). Sixteen participants made up the final dataset.
Procedure
The procedure was identical to Experiment 1 except that the interstimulus interval was shortened and varied ran-domly from 750 to 1500 msec. Given the components of interest all occurred well before the end of the in-terstimulus interval in Experiment 1, the interval was shortened in an effort to reduce the total duration of the experiment while maintaining a reasonable number of test trials per condition for each subject.
Design
In contrast to the mixed design of Experiment 1, Experi-ment 2 used a 2 4 within-subjects experimental de-sign with the factors of number range (small numbers
and large numbers) and ratio change (no change, small change, medium change, and large change). The levels of ratio change were created by grouping test trials ac-cording to ratio of change between the number of dots in the adaptation displays to the number of dots in the specific test display as in Experiment 1 (see Table 1).
In Experiment 2, each subject completed all six blocks that involved adaptation to the numbers 1, 2, 3, 8, 16, and 24. Blocks were divided into small-number blocks (1–3) and large-number blocks (8–24). All small-number or all large-small-number blocks were presented first and order of presentation was counterbalanced across participants.
The three small-number blocks and the three large-number blocks presented the same context (1, 2, 3, 8, 16, 24) and test numbers (1, 2, 3, 8, 16, 24) as in Ex-periment 1. A total of 1800 images were presented to each subject. In an effort to reduce the length of the ex-periment, fewer test trials per condition were presented. Each test number was presented 20 times per block (30 in Experiment 1). A total of 360 test trials were pre-sented to each subject: 120 no change, 80 small change, 80 medium change, and 80 large change test conditions. In an effort to equate the number of trials potentially contributing to the average, the last five no-change test trials in each of the six blocks were dropped from the analysis.
Displays
Data Acquisition and Processing
Our protocol for EEG recording and data processing was identical to that used in Experiment 1.
Analysis
We focused our analyses to test for the two signature phenomena observed in Experiment 1: increasing mag-nitude of the early N1 component based on cardinal value of displays in the small-number range and modu-lation of P2p based on ratio change for large numbers. In addition, we also tested for earlier processing differ-ences (P1). The effects of cardinal value and number range were statistically assessed by comparing mean P1 (85–155 msec) and N1 (167–215 msec) amplitude and peak latency for the average response over the POT region with a repeated measures ANOVA as in Experi-ment 1. And, we assessed the effects of ratio change on the time window characterizing the rising P2p (215– 265 msec) by using a 24 within-subjects repeated mea-sures ANOVA with the factors of number range (small or large) and ratio change (no change, small change, me-dium change, large change).
Time windows best characterizing the major compo-nents (defined above) showed high overlap with those identified in Experiment 1. Slight differences in compo-nent latency were observed and most likely due to the changes in interstimulus timing between experiments. Scalp topography was also highly similar to that observed in Experiment 1 and in previous research (Libertus et al., 2007; Pinel et al., 2001; Temple & Posner, 1998; Dehaene, 1996). However, we did notice a slightly dorsal–lateral shift in the scalp topography of the posterior compo-nents. To best characterize the observed components in this group of subjects, we defined the clusters comprising posterior activation slightly differently for Experiment 2, although they overlap highly with those of Experiment 15 (see Figure 2).
Results
Early Processing (P1)
Analysis of the first positivity revealed a significant main effect of number range [F(1, 15) = 4.76,p= .045], with small numbers showing a greater P1 amplitude than large numbers. A significant interaction between num-ber range and cardinal value [F(2, 30) = 3.41,p= .046], with amplitude increasing as cardinal value increased for small numbers and decreasing as cardinal value in-creased for large numbers, was also observed. However, post hoc testing revealed neither the small-number nor the large-number trend to show a significant lin-ear contrast. An analysis of P1 latency again revealed a main effect for number range [F(1, 15) = 42.29, p < .001], with small-number test trials eliciting slower
posi-tive peaks than large-number test trials during this time window.
Effects of Cardinal Value on N1
We again observed a significant interaction between num-ber range and cardinal value on mean N1 amplitude [F(2, 30) = 3.38, p = .048]. Post hoc tests revealed a significant linear contrast with increasing component magnitude (more negative mean amplitude) with in-creasing cardinal value for small numbers [F(1, 15) = 6.52,p= .022], but not for large numbers (see Figure 5). Again, we observed a main effect of number range on N1 latency, with small-number trials eliciting negativities slower to peak than large-number trials [F(1, 15) = 23.92,
p< .001].
Effects of Ratio Change on P2p Amplitude
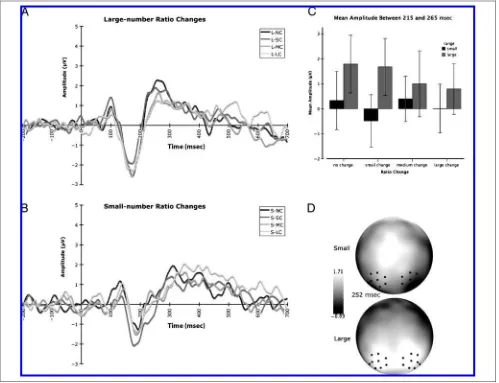
The analysis of the later evoked response (P2p) revealed a significant main effect for number range [F(1, 15) = 16.962, p = .001] and a significant Number range by Ratio change interaction [F(3, 45) = 3.365, p = .027]. Examination of the mean P2p amplitudes for each of the ratio change conditions revealed a significant linear contrast [F(1, 15) = 7.64, p = .014] within the large-number block where no-change test conditions elicited the greatest positivity and mean P2p amplitude sys-tematically decreased as ratio of adaptation to test num-ber increased (see Figure 6). In contrast, this pattern of attenuation according to ratio was not observed with matched ratio changes within the small-number range [F(1, 15) = 0.002,p= .962]. Instead, we observed medium-change test conditions to elicit the greatest positivity during this time frame, closely followed by the no-change test condition. The small-change test condi-tion elicited the lowest average amplitude over this time window (see Figure 6).
Discussion
The results of Experiment 2 replicate the two principal findings of Experiment 1. First, after equating individual item size across large and small test images, we again observed an increase in the amplitude of the early N1 with an increase in cardinal value for small numbers, but not for large numbers. Moreover, small numbers elic-ited slower peaking P1 and N1 components compared to large numbers.
although large nonsymbolic number representations are ratio dependent, representations of a small number of objects are not.
GENERAL DISCUSSION
Neural Responses to Changes in Number
These data replicate previous fMRI findings of a parietal response to numerical changes, with a greater response to changes at narrower numerical ratios (Ansari et al., 2006). Furthermore, the findings extend previous find-ings in three respects. First, the present studies used pas-sive viewing of nonsymbolic numerical displays whose numerical content was never described or highlighted. Despite the absence of any behavioral task or overt
[image:11.612.60.552.63.468.2]re-sponse, our results are nearly identical to those involv-ing voluntary comparison of symbolic and nonsymbolic quantities (Libertus et al., 2007; Temple & Posner, 1998; Dehaene, 1996). In all cases, small ratio changes elicit higher P2p amplitudes than do large ratio changes. This finding suggests that adults automatically engage in spontaneous processes of representing and comparing numerosities in the large-number range, without being instructed to do so. In fact, in almost all cases, subjects were not even aware the studies were about number and reported attending to other visual features of the dis-plays such as spatial arrangement. This observation sug-gests that distance/ratio dependency effects are truly a result of numerical computations, not task difficulty or decision-related factors, as there was no task presented and no decision to be made.
Second, the scaling of the electrophysiological re-sponse to ratio extended to the no-change test condi-tion, with a ratio difference of zero. This finding contrasts with the findings of experiments using sym-bolic stimuli (Naccache & Dehaene, 2001), probably be-cause the exact equality of two symbolic large-number arrays can easily be determined, whereas the exact equality of two nonsymbolic numbers cannot. It is pos-sible that each successive numerical presentation gen-erated an automatic and spontaneous comparison process in the mind: a search for numerical differences that terminated quickly and easily when the differences were large but required more processing when the dif-ferences were small or nonexistent.
Participants may not have been actively engaged in numerical comparisons, as they did not report number as a variable of interest when probed as to the purpose of the experiment. But, their scalp potentials,
neverthe-less, revealed that numerical comparison was occurring. This finding accords with neuropsychological research of patients with impairments to language and symbolic numerical processing such as L. E. C. (Lemer, Dehaene, Spelke, & Cohen, 2003). When presented with an ap-proximate number task L. E. C. claimed to have lost all ability to process number and predicted that he would fail at tasks of numerical comparison with arrays con-taining large numbers of dots. When given such tasks and asked to guess, however, he performed well above chance and comparable to healthy controls, suggesting awareness need not be requisite for approximate nu-merical comparisons to occur (Lemer et al., 2003).
[image:12.612.62.561.296.679.2]Whatever its explanation, the ratio-dependent pattern of results obtained in these experiments is very similar both to the tuning curves observed by fMRI researchers using a similar passive task (Piazza et al., 2004) and re-cordings from individual neurons in response to number
in nonhuman primates (Nieder & Miller, 2003). The sim-ilarity can be more easily seen by reversing the actual direction of change (increasingly more negative as ratio increased) and graphing the inverse of the mean P2p amplitude across both experiments (Figure 7).6Just as observed by Piazza et al. (2004), there is greater change from baseline (no change) as the numerical ratio of change increases. Thought of in this way, differences in the nature of the signal of ERP and fMRI results in re-sponse to number can be reconciled. However, further spatial analyses and source localization with ERP, possi-bly combined with other techniques, such as fMRI, are needed to understand the nature of the component re-ferred to as the second posterior positivity (P2p).
Third and most important, our findings provide evi-dence that the numerical representation processes, engendered spontaneously for large numbers, are not engaged in the same way when adults view small num-bers.7The neural response to test displays of small num-bers is not modulated by the relationship of the cardinal value of a test display to that of the context display. Thus, our experiments provide the first evidence that the ratio dependence of large-number comparisons is not observed spontaneously for small-number comparisons.
Why do small-number comparisons fail to show a ratio effect as observed with large numbers in our data? Two potential explanations for this failure can be rejected based on our design and findings. First, the difference between the ratio effect for large and small numbers is not attributable to other, nonnumerical differences be-tween the large- and small-number displays. All quanti-tative properties of the displays were equated across the small- and large-number displays in Experiment 1 except for item size. In Experiment 2, item size was
equated and the contrasting effects of ratio were still found. Moreover, similar findings were observed across both experiments that varied in the methods employed to control for continuous variables. The set-size (large or small) modulation of the ratio effect, therefore, is ro-bust over a host of stimulus and factors.
Second, the difference is not attributable to a floor ef-fect in the neural response to small numbers. Although responses to small numbers were not modulated by ratio, they were modulated by a different numerical prop-erty: cardinal value independent of numerical context. The neural response to number scaled positively with cardinal value during early time windows characterizing the N1 for small numbers, but not for large numbers.
The double dissociation between the numerical in-formation modulating electrophysiological responses to large versus small numbers supports the theory, here-tofore based primarily on behavioral evidence with in-fants and nonhuman primates, that small-number arrays evoke parallel representations of individual objects, whereas large-number arrays evoke summary represen-tations of approximate cardinal values. Just as brain ac-tivity increases with increases in the number of objects that must be tracked (Culham et al., 2001) or individu-ated (Xu, in press), brain activity in the presence of small numbers may spontaneously engage these tracking mech-anisms and serve as the basis of representations of small numbers.
Nevertheless, this conclusion must be qualified. Al-though small numbers did not engage ratio-dependent summary representations in the present passive viewing studies, it remains possible that they would engage such processes if participants were primed with large numbers and then asked to make comparisons between large and small numbers or explicitly told to compare numerosity across sets.8To be sure, these adult subjects are capable of forming summary representations of small cardinal val-ues, and of comparing one cardinal value to another. Our findings suggest only that such processes are spon-taneously engaged for large numbers and not for small numbers.
Implications for a Theory of Number Representation
Based on the present results, it is possible that early spatial attention is deployed differentially based on the number of objects in the set. This explanation fits nicely with the idea that a limited number of items can be individuated or tagged as what has been termed ‘‘object files’’ (Sears & Pylyshyn, 2000; Scholl & Pylyshyn, 1999). From the object files perspective, the small-number sys-tem is not a ‘‘number syssys-tem’’ per se, but a syssys-tem for keeping track and encoding features of individuals in par-allel (Feigenson & Carey, 2003).
[image:13.612.55.293.494.692.2]Both our results and others (e.g., Culham et al., 1998, 2001) raise the question why activation scales with the
Figure 7. Inverse of ratio change results reported in Experiments 1 and 2. The values were derived by standardizing the mean P2p
amplitudes (Tscores) for each subject and then computing the
number of objects presented in the small-number range. It is important to note that our data within the small-number range do not show a positive relationship be-tween N1 latency and cardinal value indicative of a serial process, but an amplitude increase without latency dif-ferences that may reflect the degree to which we must split our attention in parallel (Pylyshyn & Storm, 1988). We suggest the N1 amplitude effect most likely reflects subprocesses within the system of object representa-tion and attentive object tracking. Recent neuroimaging research suggests that multiple and distinct parietal pro-cesses are at work in the representation of a small num-ber of objects (Xu, in press), including a process of individuation that scales with the number of objects in the array and a process of identification that does not scale with number (see also Pylyshyn, 2003). The N1 ef-fect observed in the small-number range might reflect this individuation process.
Further, our results provide evidence against views that propose one system of representations spanning the all numbers (Cordes et al., 2001; Gallistel & Gelman, 2000). First, early component amplitude increased with cardi-nal value for small sets and not for large sets. In some cases, the opposite pattern of modulation was observed for large sets. Furthermore, small sets were found to evoke slower peaks over a variety of components com-pared to large sets of objects. An accumulator or iterative model of numerical representation (e.g., Gallistel, 1990) would predict greater amplitude and/or latency with in-creases in cardinal value, but this was not the case. In fact, no case was observed in which amplitude or latency was increased as cardinal value increased for arrays containing large numbers.
Large numbers did, however, elicit greater P2p am-plitudes than small numbers, although amplitude was not modulated by cardinal value but by ratio of change. The results of Piazza, Giacomini, Le Bihan, and Dehaene (2003) indirectly support this finding. In a counting task, no brain region was observed to show greater activation for enumeration of the subitizing range (1–3) compared to conditions of four or greater. Widespread brain re-gions, however, showed greater activation for numbers 4–7 compared to 1–3. Our finding of greater positive am-plitude over posterior sites for large compared to small numbers is congruent with these findings.
It is important to note that the actual nature and origin of the latent component being labeled P2p in the small-number range cannot be fully characterized by these data. For purposes of analysis, it was used in com-parison to the P2p component in the large-number range. In our analysis, we assumed it to be the same underlying component as observed in the large-number range, but the spatial resolution of the current method does not allow a distinction between spatially adjacent cortical regions. It is just as plausible to assume that the underlying neural mechanism driving small-number representations is distinct from that driving the
positiv-ity in the large-number range. Although further investi-gation combined with source localization techniques is needed to find the neural locus of these components, either explanation supports the proposed idea that a small number of items are represented differently than a large number of items.
Experiments 1 and 2 used different methods to con-trol for continuous parameters other than number. In particular, the small-number arrays in Experiment 1 (but not in Experiment 2) consisted of larger objects, and the successive arrays presented changes in object size that were more predictable in Experiment 1 than in Experi-ment 2.9 These differences were associated with some differences in the ERP response. In Experiment 1, we ob-served a significant effect of cardinal value on latency of P1 and N1 for both large and small numbers, such that peak latency decreased as number increased. We also observed a significant effect of cardinal value on N1 am-plitude, such that amplitude increased with cardinal value for small numbers and significantly decreased for cardinal value with large numbers. In Experiment 2, in contrast, there was no effect of cardinal value on P1 or N1 latency and no effect of cardinal value on N1 ampli-tude in the large-number range. These findings suggest that early processing is not driven completely by the num-ber of objects in an array, but is also influenced by other continuous parameters and presentation sequences.9
Despite these differences, the present experiments show the same two distinct signatures of small- and large-number processing: signatures that are not tied to other continuous stimulus parameters. When presented with small-number arrays, adults appear to spontaneously fo-cus on individual objects, with neural responses that scale with the number of objects to be attended. Faced with large-number arrays, in contrast, adults appear to focus spontaneously on cardinal values and to compare succes-sive values over time. Thus, the automatic, foundational systems of numerical cognition observed in young in-fants and other nonhuman primates appear to be present in human adults despite years of formal numerical and mathematical training.
Acknowledgments
We thank Susan Carey, Veronique Izard, and Charles Nelson for their helpful comments and feedback at various stages of this project. We also thank Ana Franco, Jeff Reardon, and Amy Yoshitsu for their help with data collection.
Reprint requests should be sent to Daniel C. Hyde, Department of Psychology, Harvard University, 1120 WJH, 33 Kirkland Street, Cambridge, MA 02138, or via e-mail: dchyde@fas.harvard.edu.
Notes
2. We also conducted the same comparisons of cardinal value using an average of adaptation trials instead of test trials and found similar results.
3. No hemispheric differences were observed.
4. To investigate whether a ratio-dependent magnitude repre-sentation occurs later for small numbers we conducted a sec-ond analysis on a later time window (250–350 msec) for just the small-number ratio changes. This analysis also failed to show a main effect of ratio change [F(3, 83.772) = 0.852,p= .469]. 5. Left POT electrodes: 52, 53, 59, 60, 61, 64, 65, 66, 67; Right POT electrodes: 78, 79, 85, 86, 87, 91, 92, 93, 96.
6. Mean P2p amplitudes for all subjects in both experiments were first standardized by converting them toTscores which essentially sets the mean to 50 and the standard deviation to 10 (T= 50 + (Z scorestandard deviation)).Tscores were used so that the range of values would all be positive. Then the inverse of theT scores was computed (1/x) for visualiza-tion as displayed in Figure 7.
7. Interestingly, our results contrast with the observations of a recent ERP experiment suggesting similar signatures of small-number and large-number change detection in infants (Izard et al., 2008). However, comparisons between Izard et al. and our experiments are difficult for three reasons. First, the between-subjects design used in their experiment did not al-low them to test for the effects of different ratio changes of the same number range nor for the effects of the same ratio changes in different number ranges. Second, the comparisons of large and small numbers were made over a later time win-dow than one might expect, given our data on the early effects of small numbers. Third, they only tested for number change (averaged over increasing and decreasing cardinal values) and not for the effects of cardinal value alone.
8. Although sufficient priming in one domain could transfer to representing, say, a small number using the system of large-number representation, we did not find evidence of this in our study. The same general N1 and P2p trends were observed when only the first block (large or small) was analyzed. 9. Although individual dot size varied in adaptation images and was equated in test images in both experiments, subjects in Experiment 1 were only exposed to five object sizes per adaptation block, whereas those in Experiment 2 were ex-posed to a continuum of many more dot sizes. As a result, subjects in Experiment 1 might have encoded all the item sizes within a block and tracked this over the experiment, rendering item size a relevant dimension of the images. In contrast, subjects in Experiment 2, exposed to many more item sizes, may not have focused on item size.
REFERENCES
Ansari, D., Dhital, B., & Siong, S. C. (2006). Parametric effects of numerical distance on the intraparietal sulcus during passive viewing of rapid numerosity changes.
Brain Research, 1067,181–188.
Ansari, D., Lyons, I. M., van Eimeren, L., & Xu, F. (2007). Linking visual attention and number processing in the brain: The role of the right temporal–parietal junction in the small and large non-symbolic number comparison.Journal of Cognitive Neuroscience, 19,
1845–1853.
Brannon, E. M. (2002). The development of ordinal numerical knowledge in infancy.Cognition, 83,223–240. Brannon, E. M., Abbott, S., & Lutz, D. (2004). Number bias
for the discrimination of large visual sets in infancy.
Cognition, 93,B59–B68.
Brannon, E. M., & Terrace, H. S. (1998). Ordering of the numerosities 1–9 by monkeys.Science, 282,746–749.
Cantlon, J. F., Brannon, E. M., Carter, E. J., & Pelphrey, K. A. (2006). Functional imaging of numerical processing in adults and 4-y-old children.PLOS Biology, 4,e125. Cnaan, A., Laird, N. M., & Slasor, P. (1997). Using the
general linear mixed model to analyze unbalanced repeated measures and longitudinal data.Statistics in Medicine, 16,2349–2380.
Cordes, S., Gelman, R., & Gallistel, C. R. (2001). Variability signatures distinguish verbal from nonverbal counting in both large and small numbers.Psychological Bulletin and Review, 8,698–707.
Culham, J. C., Brandt, S. A., Cavanagh, P., Kanwisher, N. G., Dale, A. M., & Tootell, R. B. H. (1998). Cortical fMRI activation produced by attentive tracking of moving targets.Journal of Neurophysiology, 88,2657–2670. Culham, J. C., Cavanagh, P., & Kanwisher, N. G. (2001).
Attention response functions: Characterizing brain areas using fMRI activation during parametric variations of attentional load.Neuron, 32,737–745.
Dehaene, S. (1996). The organization of brain activations in number comparison: Event-related potentials and the additive-factors method.Journal of Cognitive Neuroscience, 8,47–68.
Dehaene, S. (2007). Symbols and quantities in parietal cortex: Elements of a mathematical theory of number representation and manipulation. In P. Haggard & Y. Rossetti (Eds.),Attention and performance: XXII. Sensori-motor foundations of higher cognition. Cambridge, MA: Harvard University Press.
Dehaene, S., Izard, V., & Piazza, M. (2005).Control over non-numerical parameters in numerosity experiments. Unpublished manuscript (available at www.unicog.org). Dehaene, S., Piazza, M., Pinel, P., & Cohen, L. (2003).
Three parietal circuits for number processing.Cognitive Neuropsychology, 20,487–506.
Feigenson, L., & Carey, S. (2003). Tracking individuals via object-files: Evidence from infants’ manual search.
Developmental Science, 6,568–584.
Feigenson, L., Dehaene, S., & Spelke, E. S. (2004). Core systems of number.Trends in Cognitive Sciences, 8,
307–314.
Gallistel, C. R. (1990).The organization of learning. Cambridge, MA: Bradford Books/MIT Press.
Gallistel, C. R., & Gelman, R. (2000). Non-verbal numerical cognition: From reals to integers.Trends in Cognitive Sciences, 4,59–65.
Hillyard, S. A., & Anllo-Vento, L. (1998). Event-related brain potentials in the study of visual selective attention.
Proceedings of the National Academy of Sciences, U.S.A., 95,781–787.
Hillyard, S. A., Mangun, G. R., Luck, S. J., & Heinze, H. J. (1990). Electrophysiology of visual attention. In E. R. John, T. Harmony, L. Prichep, M. Valdez, & P. Valdez (Eds.),
Machinery of the mind(pp. 186–205). Boston: Birkhausen. Hillyard, S. A., Teder-Sa¨leja¨rvi, W. A., & Mu¨nte, T. F. (1998).
Temporal dynamics of early perceptual processing.
Current Opinion in Neurobiology, 8,202–210. Izard, V., Dehaene-Lambertz, G., & Dehaene, S. (2008).
Distinct cerebral pathways for object identity and number in human infants.PLOS Biology, 6,e11.
Lemer, C., Dehaene, S., Spelke, E. S., & Cohen, L. (2003). Approximate quantities and exact number words: Dissociable systems.Neuropsychologia, 41,1942–1958. Libertus, M. E., Woldorff, M. G., & Brannon, E. M. (2007).
Electrophysiological evidence for notation independence in numerical processing.Behavioral and Brain Functions, 3,1. Luck, S. J. (2005a).An introduction to the event-related
Luck, S. J. (2005b). The operation of attention-millisecond-by-millisecond-over the first half second. In H. Ogmen & B. G. Breitmeyer (Eds.),The first half-second: The microgenesis and temporal dynamics of unconscious and conscious visual processes(pp. 187–206). Cambridge, MA: MIT Press. Mandler, G., & Shebo, B. J. (1982). Subitizing: An analysis
of its component processes.Journal of Experimental Psychology: General, 111,1–21.
Naccache, L., & Dehaene, S. (2001). The priming method: Imaging unconscious repetition priming reveals an abstract representation of number in the parietal lobes.
Cerebral Cortex, 11,966–974.
Nieder, A., & Miller, E. K. (2003). Coding of cognitive magnitude: Compressed scaling of numerical information in the primate prefrontal cortex.Neuron, 37,149–157. Piazza, M., Giacomini, E., Le Bihan, D., & Dehaene, S.
(2003). Single-trial classification of parallel pre-attentive and serial attentive processes using functional magnetic resonance imaging.Proceeding of the Royal Society of London, Series B, Biological Sciences, 270,1237–1245. Piazza, M., Izard, V., Pinel, P., Le Bihan, D., & Dehaene, S.
(2004). Tuning curves for approximate numerosity in the human intraparietal sulcus.Neuron, 44,547–555. Piazza, M., Pinel, P., Le Bihan, D., & Dehaene, S. (2007).
A magnitude code common to numerosities and number symbols in human intraparietal cortex.Neuron, 53,293–305.
Pinel, P., Dehaene, S., Riviere, D., & Le Bihan, D. (2001). Modulation of parietal activation of semantic distance in a number comparison task.Neuroimage, 14,1013–1026. Pylyshyn, Z. W. (2003).Seeing and visualizing: It’s not
what you think. Cambridge, MA: MIT Press.
Pylyshyn, Z. W., & Storm, R. W. (1988). Tracking multiple independent targets: Evidence for a parallel tracking mechanism.Spatial Vision, 3,179–197.
Scholl, B. J., & Pylyshyn, Z. W. (1999). Tracking multiple items through occlusion: Clues to visual objecthood.
Cognitive Psychology, 38,259–290.
Sears, C. R., & Pylyshyn, Z. W. (2000). Multiple object tracking and attentional processing.Canadian Journal of Experimental Psychology, 54,1–14.
Shuman, M., & Kanwisher, N. (2004). Numerical magnitude in the human parietal lobe: Tests of representational generality and domain specificity.Neuron, 44,557–569.
Temple, E., & Posner, M. I. (1998). Brain mechanisms of quantity are similar in 5-year-old children and adults.
Proceedings of the National Academy of Sciences, U.S.A., 95,7836–7841.
Whalen, J., Gallistel, C. R., & Gelman, R. (1999). Nonverbal counting in humans: The psychophysics of number representation.Psychological Science, 10,130–137. Wood, J. N., & Spelke, E. S. (2005). Chronometric studies
of numerical cognition in five-month-old infants.
Cognition, 97,23–39.
Xu, F. (2005). Categories, kinds, and object individuation in infancy. In L. Gershkoff-Stowe & D. Rakison (Eds.),
Building object categories in developmental time
(pp. 63–89). Papers from the 32nd Carnegie Symposium on Cognition. Mahwah, NJ: Erlbaum.
Xu, F., & Spelke, E. S. (2000). Large number discrimination in 6-month-old infants.Cognition, 74,B1–B11.