MethylViewer: computational analysis and
editing for bisulfite sequencing and
methyltransferase accessibility protocol
for individual templates (MAPit) projects
Carolina E. Pardo
1, Ian M. Carr
2, Christopher J. Hoffman
1, Russell P. Darst
1,
Alexander F. Markham
2, David T. Bonthron
2and Michael P. Kladde
1,*
1
Department of Biochemistry and Molecular Biology, University of Florida Shands Cancer Center Program in Cancer Genetics, Epigenetics and Tumor Virology, 2033 Mowry Road., Box 103633, Gainesville,
FL 32610-3633 and 2Leeds Institute of Molecular Medicine, University of Leeds, Leeds, UK
Received June 12, 2010; Revised July 22, 2010; Accepted July 27, 2010
ABSTRACT
Bisulfite sequencing is a widely-used technique for examining cytosine DNA methylation at nucleotide resolution along single DNA strands. Probing with
cytosine DNA methyltransferases followed by
bisulfite sequencing (MAPit) is an effective tech-nique for mapping protein–DNA interactions. Here, MAPit methylation footprinting with M.CviPI, a GC
methyltransferase we previously cloned and
characterized, was used to probe hMLH1chromatin
in HCT116 and RKO colorectal cancer cells.
Because M.CviPI-probed samples contain both CG and GC methylation, we developed a versatile, visually-intuitive program, called MethylViewer, for
evaluating the bisulfite sequencing results.
Uniquely, MethylViewer can simultaneously query cytosine methylation status in bisulfite-converted sequences at as many as four different user-defined motifs, e.g. CG, GC, etc., including motifs with de-generate bases. Data can also be exported for stat-istical analysis and as publication-quality images.
Analysis of hMLH1 MAPit data with MethylViewer
showed that endogenous CG methylation and ac-cessible GC sites were both mapped on single mol-ecules at high resolution. Disruption of positioned
nucleosomes on single molecules of the PHO5
promoter was detected in budding yeast using M.CviPII, increasing the number of enzymes
avail-able for probing protein–DNA interactions.
MethylViewer provides an integrated solution for primer design and rapid, accurate and detailed analysis of bisulfite sequencing or MAPit datasets from virtually any biological or biochemical system.
INTRODUCTION
Methylation of cytosine bases is a commonly occurring modification of deoxycytidine monophosphate (dCMP) pre-replicatively and of deoxycytidine (dC) in DNA post-replicatively (1–5). Post-replicative methylation of dC in prokaryotic genomes, either of carbon 5 (m5C) or of the exocyclic N4 atom (mN4C), is mediated by site-specific DNA methyltransferases (DNMTs). These modifications protect against degradation by cognate re-striction endonucleases (6).
Many organisms regulate diverse genomic processes through C-5 methylation of CG (CpG) sites (i.e. m5CG) by endogenous DNMTs. These processes include inacti-vation of: gene expression at the level of transcription ini-tiation or elongation, one of two X chromosomes in normal female mammals, either the maternal or paternal copy of a gene (genomic imprinting) and mobility of para-sitic genetic elements, e.g. retrotransposons (1,2,7). Aberrant patterns of DNA methylation are frequently associated with human disorders, aging, carcinogenesis and developmental defects (2,8–12). In addition to CG methylation, land plants, such as Arabidopsis, employ non-CG methylation of transposable elements (1,13–17). Short transposable elements are particularly enriched for m5CHH, where H is a degenerate base equal to A, C or
*To whom correspondence should be addressed. Tel: +1 352 273 8142; Fax: +1 352 273 8299; Email: kladde@ufl.edu; kladde@gmail.com
The authors wish it to be known that, in their opinion, the first two authors should be regarded as joint First Authors.
ßThe Author(s) 2010. Published by Oxford University Press.
T. Ascomycetes, such as the filamentous fungi Ascobolus immersus and Neurospora crassa, 5-methylate dC within repeats in a relatively sequence-independent manner (17,18). Abundant non-CG methylation (m5CHG and m5CHH) has also been reported in undifferentiated human embryonic stem cells (19–24). Non-CG methyla-tion is also found in the genomes of lyticChlorellaviruses that infect and degrade the genome of fresh water
Chlorella-like green algae (25–28). In this case, progeny viral genomes are protected post-replicatively against deg-radation by site-specific introduction of m5C by DNMTs, e.g. M.CviPI (G-m5C) and M.CviPII (m5CCD, m5Cm5CAA and m5Cm5CCG), that they encode (25–28). Bisulfite genomic sequencing (BGS) is a widely used technique for assaying cytosine methylation status in DNA (29,30). Bisulfite ion can quantitatively convert unmethylated C in denatured DNA to U, whereas m5C, mN4C and hm5C resist chemical deamination and thus are retained (31–33). BGS can be used to display these three and perhaps other types of cytosine modification as they are discovered (34). Individual molecules from a PCR product population can be cloned and sequenced, mapping the methylation status of every cytosine along a single DNA strand at nucleotide resolution (29,30).
DNMTs are also effective probes, either as purified enzymes or as transgenes expressedin vivo, for mapping protein–DNA interactions (35–41). DNMTs methylate target sites that are unoccupied by proteins and hence are easily accessed (35–38,42). Conversely, occupancy of DNMT target sites by histones or non-histone proteins protects against methylation and produces a ‘footprint’ at the site of factor interaction (37,42–45). Availability of DNMTs that recognize and methylate cytosines in specific dinucleotide sites, e.g. M.CviPI (GC) and M.SssI (CG) (28,46,47), allows moderate- to high-resolution foot-printing, depending on local site density. Additional enzymes with novel short recognition specificities would increase probing resolution and hence obtainable mapping information.
Combining DNMT probing with BGS provides a powerful non-averaged, single-molecule view of chromatin structure, termed methyltransferase accessibility protocol for individual templates (MAPit) (39–41,48–50). Because a continuous strand of DNA is cloned, i.e. regions are not fragmented by nuclease digestion, multiple methylation events and hence footprints can be detected along a single DNA strand (39–41,48–50). Manual assignment of the methylation status of every C of many sequenced mol-ecules is time consuming, labor intensive and subject to human error. Manual analysis of raw BGS results is there-fore impractical for large-scale projects.
Attempts to alleviate these problems have led to devel-opment of several software programs that deal with indi-vidual steps in the BGS process: (i) primer design (51–53); (ii) alignment of sequenced bisulfite-converted molecules (54–56); and (iii) generation of graphical or text-based outputs (53,54,56–59). Some of these programs require computer literacy beyond that of the typical biomedical researcher. In addition, only one program, CpGviewer (60), which we developed previously, offers a stand-alone solution to the BGS pipeline. However, CpGviewer and
each of the above programs is limited to methylation analysis of CG, or additional sites in plants, CHG, CHH and CNG, where N is any nucleotide and H is either A, C or T. Furthermore, currently available programs are unable to simultaneously analyze and diagram methylation by multiple enzymes, which may vary from one experiment to another, as is often required for MAPit footprinting studies.
We have developed a BGS analysis program, called MethylViewer, which circumvents these and other limita-tions. MethylViewer was written to facilitate analysis of MAPit experiments, and is a substantially improved and more versatile version of CpGviewer (60). A key feature of MethylViewer is that it can simultaneously analyze and distinguish between cytosine methylation in bisulfite-converted sequences at as many as four different, user-defined sequence motifs, including C by itself. The program also has a utility for designing primers for MAPit, directly aligns most common sequencing file formats or processes pre-aligned FASTA files, and gener-ates publication-quality images. Here, the usefulness of MethylViewer is demonstrated by analyzing *.ab1 sequencing files from MAPit analysis of the hMLH1
tumor suppressor gene promoter from colorectal cancer cell lines. Our use as chromatin probe of M.CviPI, which we previously cloned and found methylates GC (28), permitted simultaneous detection of endogenous CG methylation and chromatin accessibility within single mammalian sequences. As such, our data provide the first single-molecule view of chromatin accessibility at an endogenously hypermethylated CpG island. Also, at a well-characterized yeast promoter, we showcase for the first time use of M.CviPII, a CCD DNMT, as anin vivo
chromatin probe. We conclude that MethylViewer is a powerful computational resource for accurate and rapid BGS analysis of complex DNA methylation data sets, including those with methylation at degenerate or multiple sites of any sequence of interest.
MATERIALS AND METHODS
Software development and requirements
Microsoft Visual Studio 2005 was used for programming using the Visual Basic language. The MethylViewer program has been tested only on Microsoft Windows XP, Vista and Windows 7, and requires installation of .NET framework 2.0. The stand-alone graphical user interface program and accompanying documentation are freely available for download at http://dna.leeds.ac.uk/ methylviewer/.
Cell lines, yeast plasmids and strains, growth media and cell culturing
The full-length coding region for M.CviPII (27) was subcloned under control of estrogen induction into a single-copy integration vector as described earlier in Jessen et al. (38). The resulting LYS2-marked plasmid, pCF1439, was digested with R.AscI and R.SalI and integrated as a single copy at the HO locus in budding yeast strain, SCY3854 (MATa leu20 lys20 ura30 pho3::R PHO5HhaI promoter) (39). The PHO5HhaI
promoter contains several single nucleotides substitutions into the wild-type PHO5 promoter that introduced several HhaI sites and was described previously (39). R in this strain is a single copy of the recombinase site for
Zygosaccharomyces rouxii that is a remnant after removal of the marker used to delete the PHO3 coding region (61). The constructed strains CFY4011 and CFY4012 were grown to mid-log phase in rich YPD medium [1% (w/v) yeast extract, 2% (w/v) peptone, 2% (w/v) dextrose] and grown 10 h more in the presence of 100 nM 17b-estradiol to induce M.CviPII expression.
Nuclei isolation and MAPit analysis
Nuclei from HCT116 and RKO cells were isolated from 4–7106 cells at 4C under buffer conditions that preserve the integrity of nuclei and chromatin structure (40). After harvesting, cells were washed twice with phosphate-buffered saline (PBS) and resuspended in 1 cell resuspension buffer [CRB; 20 mM HEPES, pH 7.5, 70 mM NaCl, 0.25 mM EDTA, 0.5 mM EGTA, 0.5% glycerol (v/v), 10 mM DTT, 0.25 mM phenylmethylsulfonyl fluoride]. After pelleting by centrifugation at 1000g, cells were resuspended in cell lysis buffer (CLB; 1CRB plus 0.19% NP-40) for 10 min on ice. Nuclei were then washed twice with CRB and a 2ml aliquot was stained with 4% (w/ v) trypan blue and visualized by light microscopy to confirm their integrity. One million nuclei were resuspended in methylation buffer (MB; 1 CRB plus 160mM S -adenosylmethionine). After pre-warming nuclei to 37C for 5 min, 100 U of M.CviPI (New England Biolabs) were added for 15 min at 37C. Methylation reactions were stopped by adding an equal volume of 2 methylation stop buffer [MSB; 100 mM NaCl, 10 mM EDTA, pH 8.0, 1% SDS (w/v)], and then incubated overnight with 100mg/ ml proteinase K at 50C. DNA was isolated by extraction with phenol:chloroform:isoamyl alcohol (25:24:1) and concentrated by ethanol precipitation.
m5C analysis
Bisulfite conversion of total genomic DNA from yeast and cultured mammalian cells was carried out as described in Darstet al.(62). Briefly, 1–2mg DNA were denatured in alkali for 15 min at room temperature, followed by 5 min at 98C. Saturated sodium metabisulfite solution, pH 5.0 was added directly to each denatured sample, vortexed and incubated in the dark for 4–6 h at 50C. Bisulfite-converted DNA was desalted, desulfonated and purified with the EZ bisulfite DNA clean-up kit (Zymo Research).
Oligonucleotide primers were designed as described in Pardo et al. (41) to avoid as much as possible not only
potential endogenous methylation sites (CG) but also M.CviPI (GC) sites. A 755-bp region encompassing the two transcription start sites (TSS) of hMLH1 was analyzed for DNA methylation. Hot-start PCR was per-formed with HotStar Taq Plus (Qiagen). To minimize stochasticity due to PCR, at least three separate PCR reac-tions were performed for each amplicon and pooled prior to cloning individual products. Oligonucleotides CPO1842 (TaaATaTaAACAaATaATTTCTaaAATaAATa, with G to a transitions) and CPO1843 (GGAGGGAYGAAGAG-Attt, with C to t transitions and one degenerate pYrimidine, i.e. C and T) were used for PCR amplification
of the upper strand of hMLH1 sequences from
bisulfite-converted DNA.
For the yeast experiment, genomic DNA was prepared by the phenol/chloroform extraction method (63) and de-aminated as in (64). DNA methylation was confirmed by McrBC digest (65). PHO5 promoter sequences (500 bp) were amplified from bisulfite-converted DNA with primers WJO766
(ATATATCTCGAGAATATaTCAA-CaTATTTaaAAaTCATCTTATa; 50 XhoI site
under-lined; lower case indicating G to a transitions) and WJO769 (ATATATAAGCTTCAAtATTGGTAATtTtG-AATTTGtTTGtT; 50 HindIII site underlined; lower case indicating C to t transitions).
After purification of PCR products with the QIAEX II gel extraction kit (Qiagen), individual DNA molecules were cloned by either TOPO TA cloning (Invitrogen; hMLH1
sequences) or directionally into pBluescript(Stratagene) digested with R.XhoI and R.HindIII (PHO5 sequences). WhiteEscherichia coli colonies that screened positive for potential recombinant plasmids were inoculated into 100ml
LB medium with 100mg/ml kanamycin (TOPO TA
cloning) or 100mg/ml ampicillin (directional cloning), and incubated overnight at 37C. Plasmid DNA was amplified directly from E. coli cells using TempliPhi rolling circle amplification (GE Healthcare). Cloned inserts in the result-ing sresult-ingle-stranded DNA were subjected to BigDye sequencing and analyzed on an automated 3730 sequencer (Applied Biosystems) at the Interdisciplinary Center for Biotechnology Research at the University of Florida. The
PHO5and hMLH1*.ab1 files can be downloaded using: http://dna.leeds.ac.uk/methylviewer/Example_Files_ hMLH1.zip and http://dna.leeds.ac.uk/methylviewer/ Example_Files_PHO5.zip, and are also available at NAR Online. Note that the wild-type reference sequences should be moved to location on the hard drive outside of the folder containing the *.ab1 files prior to analysis.
Analysis of bisulfite-converted sequences
The alignment algorithm in MethylViewer uses an array of overlapping DNA fragments created from the wild-type reference sequence that can be changed from the 10-bp
default length to word sizes of 6–15 bp via
Analysis>Alignment option>Word size. . .. These words are then used to find regions of 100% homology between the reference sequence and the query sequence. Each region is extended until the ends of the alignment have
minimum number of gaps. Since the sequence of bisulfite-treated DNA may be significantly different from the original sequence, alignments are created between both the original sequence and the theoretical bisulfite-treated reference sequence to ensure that an alignment is created. Similarly, the alignment is also performed against the forward and reverse complement of the native and bisulfite-treated reference sequence to identify the orienta-tion of the cloned DNA.
The reference sequence is scanned for the presence of any methylation sites and this information is superimposed on the alignment to identify the methylation status of each site. This information is then collated for each of the experimental sequences and used to form the interactive grid displayed by MethylViewer as well as other exported images.
RESULTS
MAPit for simultaneous detection of endogenous m5CG and chromatin accessibility in individual mammalian DNA strands
Transcriptional inactivation of the human tumor suppres-sor gene hMLH1 by hypermethylation of the CG island associated with its promoter is a frequent contributor to colon cancer progression (66–68). The hMLH1promoter is active in HCT116 cells where its CG island is hypomethylated (8,68–71). By contrast, the hMLH1 CG island is hypermethylated and the gene is transcriptionally silent in RKO cells. In a recent study, Lin et al. (72) reported that chromatin near the two transcription start sites (TSS), TSSa and TSSb, of active alleles of hMLH1in HCT116 cells was accessible to nucleases and M.SssI at individual promoters within isolated nuclei. Regions upstream of both TSS in this cell line were also shown to be depleted for nucleosomes as assayed by chromatin immunoprecipitation of the globular region of histone H3 in isolated mononucleosomes. However, single-molecule methylation footprinting of the hypermethylated hMLH1promoter in RKO cells using M.SssI was ambigu-ous because the probe has the same specificity for CG as vertebrate DNMTs.
We have overcome this drawback by using as chromatin probe M.CviPI, a DNMT fromChlorella virusNYs-1 that specifically methylates C in GC sites (28). Thus, sequencing cloned, bisulfite-converted molecules after probing mammalian chromatin with M.CviPI should allow clear discrimination between non-overlapping G-m5C and endogenous m5CG within accessible regions of mammalian chromatin. We performed MAPit by probing nuclei isolated from HCT116 and RKO cells that respect-ively express and silence the hMLH1 promoter with 0 or 100 U of M.CviPI. The original *.ab1 sequence files, FASTA alignments of four sequences from each sample, MethylViewer, and other files to familiarize users with the program’s features are available for downloading on the companion website (http://dna.leeds.ac.uk/ methylviewer/download.php). This site also contains detailed instructions for use of the program.
Analysis of mammalian MAPit data with MethylViewer
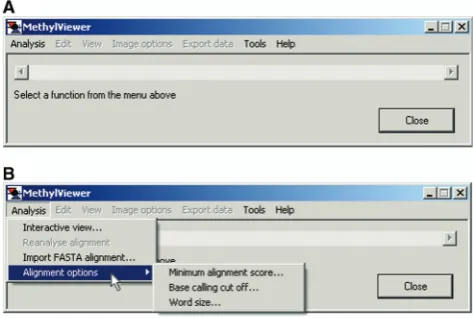
Users are first prompted toSelect a function from the menu above when MethylViewer is executed (Figure 1A). The program supports two different means for analysis of bisulfite-converted sequences (Figure 1B). First, raw sequencing data in either *.txt, *.ab1, or *.scf file format can be aligned without pre-processing by Analysis>Interactive view. . .. A *.txt reference that is the wild-type sequence is required, avoiding the need to generate bisulfite-converted reference sequences in silico. Because MethylViewer can interpret methylation at non-palindromic sites, and DNA strands are no longer complementary after bisulfite conversion, the wild-type reference sequence must be that of the DNA strand that was sequenced. After navigating to and selecting the ref-erence sequence file and the folder containing data files, the program generates the alignment via a local extension algorithm that is similar to BLAST (73).
Analysis>Import FASTA alignment provides a second analysis option (Figure 1B). After clicking on this option, users navigate to a FASTA file in the format shown in Figure 2 that contains sequences pre-aligned by another program. The first entry in this *.txt file must be the wild-type reference sequence of the DNA strand being analyzed to which the bisulfite-converted sequences are aligned.
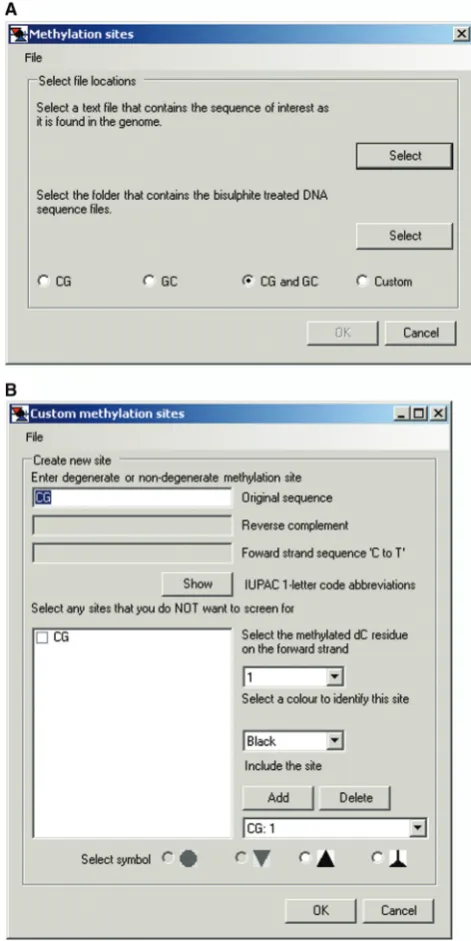
[image:4.612.314.551.70.229.2]Choosing either option in theAnalysismenu launches a floating window for designating the sequences of sites at which methylation is to be scored (Figure 3A). Preset se-lection buttons forCGonly,GConly andCG and GCare provided. Presets for CG only or GC only employ as defaults the usual convention of depicting unmethylated CG or GC as white-filled circles and methylated sites
Figure 1. MethylViewer initial window. The initial window after loading MethylViewer.exe (A) and Analysis>Alignment options
(B). Minimum alignment score. . .can be set with increased stringency from 15 to 50 upon activating the pop-up window. Likewise, users can set the Base calling cut off. . .for the signal threshold (15 to 300) for calling bases in sequencing traces and Word size. . .of the base pair length of the array of overlapping DNA fragments (6 to 15) created from the wild-type reference sequence for use in the BLAST-like local extension algorithm. Clicking the mouse on Interactive view. . .or
(m5CG or G-m5C) as black-filled circles, organized in horizontal rows.
The default setting, CG and GC, facilitates analysis of MAPit data for vertebrate samples that require analysis of methylation status at endogenous CG sites as well as at GC sites probed by M.CviPI exogenously added to nuclei.
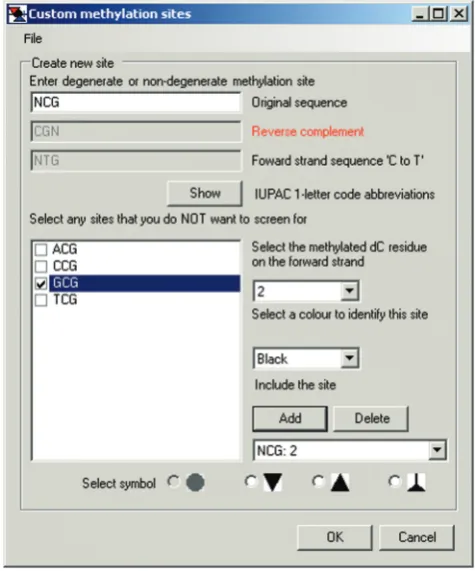
The default symbols and colors can be visualized and changed by clicking theCustompreset button (Figure 3A), which launches the Custom methylation sites floating window (Figure 3B). As usual, CG and m5CG are depicted as white- and black-filled circles, respectively. White- and red-filled inverted triangles are the depictions for GC and G-m5C sites, respectively. Selecting GC: 2in the toggle window under Include the site displays the default settings of methylation of residue 2 and red color (not shown). The options buttons for circle and inverted triangle symbols in theSelect symbolbar at the bottom of the window are gray and unavailable as they have already been designated for scoring CG and GC sites. Overlapping methylation, e.g. at GC and CG sites (G-m5CG), is indicated as gray-filled cells in each grid. This is because they constitute ‘gray areas’ that in principle could have been methylated by either endogenous DNMTs or M.CviPI chromatin probe. This default convention cannot be changed and thus does not appear in the Custom methylation sites window.
Viewing mammalian MAPit data by MethylViewer
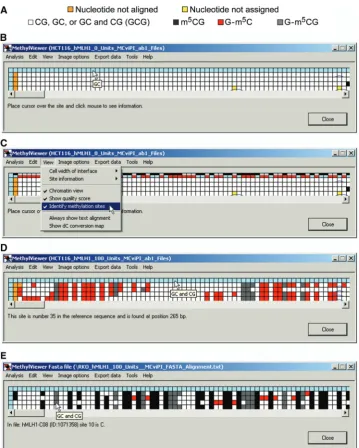
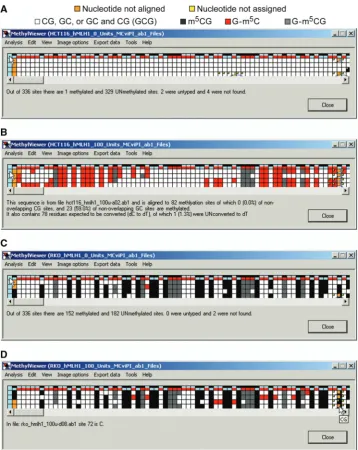
User-defined symbols and colors are drawn in Export data>Save image drawn to scale as discussed further below. Initially, however, MethylViewer processes and shows the methylation status for every C in sites aligned to the reference sequence as an interactive grid composed of color-coded cells as chosen by the user. Figure 4 shows representative BGS grids generated from *.ab1 files of four bisulfite-converted hMLH1 promoter molecules that were amplified, cloned and sequenced from HCT116 and RKO nuclei incubated with either 0 or 100 U M.CviPI. The default CG and GC setting was used for analysis of the 0 U M.CviPI samples so that the number of scored sites and hence grid sizes would be identical to aid comparisons of different samples. MethylViewer can be
executed multiple times to generate as many grids as needed.
[image:5.612.326.562.69.540.2]Rows 2–5 of each grid correspond to residues in DNMT sites in each of the four bisulfite-converted sequences from
Figure 2. FASTA file format. The wild-type sequence and proper strand of the region of interest must appear as the first entry. Names of individual aligned sequences can include any number of alpha-numeric characters; however, the program will reduce the font size of labels in exported images to fit within the allotted space. Users must be certain to erase all non-alpha-numeric characters from the file, except>and<.
Figure 3. Default settings for MAPit methylation footprinting analysis. (A) Methylation sites window activated by clicking on
Analysis>Interactive view. . .or Import FASTA alignment. . .. If the default setting of CG and GC (see keys in Figures 4A and 10D) is acceptable, the user then selects the indicated files as prompted in the window. (B)Custom methylation siteswindow activated by clicking the
the indicated cancer cell line ± M.CviPI. The key in Figure 4A is for grids generated with the default MAPit settings shown in Figure 3B. A key with colors assigned to each methylated site can also be displayed in row 1 of grids by selecting View>Identify methylation sites (Figure 4C). The size of grid cells can be increased via View>Cell width of interface>Large to better visualize assigned colors, especially if more DNMT sites are
[image:6.612.120.480.64.513.2]analyzed. Placing the cursor over any cell in a grid, except for header blue cells in column 1, also displays corresponding site sequence(s) in a small pop-up window (Figure 4B, D and E). If sequencing data files have been analyzed, left-clicking on these header cells (left- or right-clicking for analysis of FASTA files) indicates the site number and position relative to base pair 1 in the wild-type reference sequence (Figure 4D). Cells
representing residues in DNMT sites that sequenced as T are colored white. Cells for non-overlapping methyla-tion that sequenced as C are colored according to the program’s default settings (Figure 4A), or as otherwise designated in Custom methylation sites. With a view toward analysis of large data sets, Analysis>Reanalyse alignment allows analysis of methylation at additional sites while the window is open (Figure 1B).
Data editing
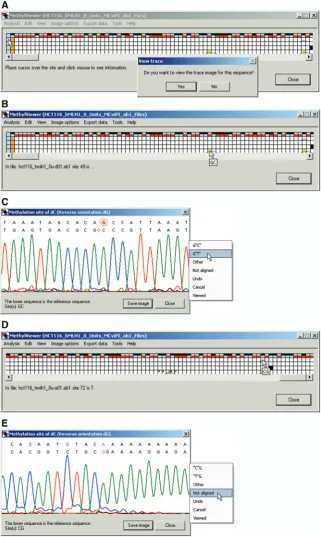
MethylViewer has been written to facilitate accurate analysis of BGS data; a central feature therefore is user-friendly editing of sequences within the interactive grid interface. These capabilities include viewing the quality of both sequencing data and local alignment of sites and flanking sequences, and re-assigning methylation status, if warranted. Cells representing sites in the grid at which local sequencing data could not be aligned to the reference sequence are colored orange (Figure 5A), and cannot be edited. In contrast, residues within sites of mol-ecules that were aligned to the reference sequence but unable to be assigned as C (unmethylated) or T (methylated) appear as yellow cells (Figures 4B and C and 5A and B). This can be due to poor quality sequencing data, the presence of single nucleotide polymorphisms, or mutations that occurred during PCR amplification or cloning. Right-clicking on header blue cells in column 1 for any molecule offers the option in a pop-up window to view the entire ABI trace (not shown) of the sequencing data and examine its quality (Figure 5A).
Left-clicking on any non-header (non-blue) cell in the grid indicates the sequence of a residue, the name of the sequenced file and the site number relative to site 1, the first one aligned (Figure 5B). Nucleotide numbers relative to site 1 associated with yellow grid cells are left blank because their sequence could not be unequivocally determined by MethylViewer. As all residues in DNMT sites should be C or T, residues that sequenced as G or A are also colored yellow (not shown).
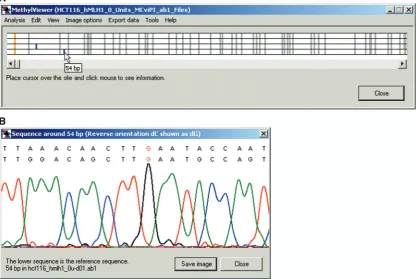
In grids of *.ab1 sequencing files, right-clicking on any non-blue cell allows inspection of both the ABI data trace and alignment between the reference and query sequence around that DNMT site (Figure 5C). This allows users to verify sequencing calls made by MethylViewer as well as to determine if the quality of sequencing data associated with yellow cells merits assigning a specific nucleotide to it. In each sequencing trace, the residue indicated in red corresponds to that clicked on and thus being queried for methylation status (Figure 5C). In this example and throughout, the G rather than C in GC site 49 was queried because the reverse strand was sequenced. It is clear in the fourth analyzed clone that one of the three cytosines inclusive of the C in GC site 49 was deleted (indicated by a blue trace over cells 49 and 50 in row 5 corresponding to sequenced clone 4 of Figure 5B). Therefore, correct alignment between the red G in the reference and A in the query sequence supports assign-ment of site 49 as T or unmethylated. Clicking anywhere within the white area of the sequencing trace launches another pop-up window with several editing options
(Figure 5C). Selection of G‘T’ re-assigns the cell to its proper call of T. Such edited squares are identified by a square in the upper left corner of the original cell in the color scheme originally chosen for the grid (Figure 5D). This square is intermediate in size between the tracking green square and the data cell. If no change to an interrogated cell is warranted, simply closing the ABI trace or selecting Viewed from the pop-up window marks the cell with a small tracking green square in its upper left corner (Figure 5D).
MethylViewer also marked CG site 72 in two molecules with blue traces, because they had deletions of one (row 2) or two (row 5) G residues immediately downstream of the query G (Figure 5D and E). The nucleotide in CG site 72 in row 2 was aligned to the reference and called as T (A in the sequenced reverse strand). However, it is formally possible that this residue was methylated and deleted instead of the downstream G, and thus we elected to change its assignment toNot aligned (Figure 5E).
In grids created from pre-aligned FASTA files, a text alignment of the entire sequence of the reference and query molecule appears on right-clicking non-blue cells. The specific residue represented in the right-clicked cell is demarcated by an asterisk that can be located by scrolling through the alignment.
Edit>Save edited data to file. . . stores all changed nu-cleotides and green tracking squares in *.edi files. Re-opening these files in MethylViewer via Edit>Open edit data file. . .allows return to data editing at one’s convenience.
Viewing bisulfite conversion efficiency and location of non-converted cytidines
produce a full-length text alignment of the reference and query sequences in a scrollable window, with an asterisk marking the clicked on residue (not shown). This is the only option for inspecting alignments of sites in grids derived from FASTA files. As above, the G indicated in red is queried, because it is complementary to the C in the reverse strand that was sequenced.
Single-molecule view of endogenous m5CG and chromatin accessibility by MAPit
Cursory visual inspection of the four edited sample data sets reveals that the hMLH1 fragment contains a m5CG level at the background of bisulfite-conversion in HCT116 cells and dense m5CG in RKO cells (Figure 7, compare black cells in A to C and B to D). In contrast to endogen-ous DNMTs, M.CviPI clearly accessed and methylated more sites at the hMLH1 promoter in HCT116 than in RKO colorectal cancer cells (Figure 7, compare red cells in B to D). These results are consistent with previous findings of epigenetic silencing by hypermethylation of hMLH1in the latter cell line (8,68–71).
A summary breakdown between unmethylated and methylated residues (unedited) for all molecules in a grid is obtained by clicking on the blue cell at the head of row 1 (Figure 7A and C). This function sums the total number of sites scored and the absolute number of unmethylated and methylated sites, including overlapping sites. In the
sample data, each cloned and sequenced 755-bp molecule of the hMLH1 promoter encompasses 84 DNMT sites, including 30 non-overlapping CG, 42 non-overlapping GC and 12 overlapping GCG sites. Thus, each sample grid with four analyzed molecules contains a total of 336 cells or sites.
Further details about individual molecules are obtained by clicking on blue cells that head each row in the grid, excluding row 1 (Figure 7B). This displays the name of the specific sequence file that was scored to obtain that row of data, the total number of sites for which methylation status was assigned, and breakdown of the total number and percentage of methylated non-overlapping sites for each queried DNMT site motif. The total number of residues expected to be converted from dC to dT (not present in selected methylation sites) as well as the number of unconverted dC residues is also tallied. This function is useful as the summary blue header in row 1 sums the total number of unmethylated (or methylated) residues in all queried DNMT sites, even of different sequence. The overall breakdown in methylation of each DNMT site can be summed from each of the individual values. However, this is cumbersome when many mol-ecules have been analyzed.
[image:9.612.105.522.76.355.2]Therefore, in practice, it is simpler to obtain data summaries by querying for methylation of one DNMT sequence motif at a time. Selecting CG in the
Methylation sites window for samples not treated with M.CviPI reveals only 1 of 162 accurately scored CG sites sequenced as C at the hMLH1 promoter in HCT116 cells (Figure 7A). This excludes four sites not aligned with the reference plus the two sites that we judged could not be aligned unequivocally. In contrast to this background level of m5CG (<1%), 150 of 165 of typed CG sites in RKO cells were methylated (91%) (Figure 7C).
To separately determine the frequency of
non-overlapping methylation at CG and GC sites in
samples treated with M.CviPI, custom NCG and
GCN sites, respectively, are scored. This is done by choosing Analysis>Interactive view. . .>Custom or
[image:10.612.120.479.65.516.2]Analysis>Import FASTA alignment>Custom, which ac-tivates the floating window for changing default settings (Figure 8). Default sites (CG and GC) are first removed by clickingDeletetwice. Next, NCG (or GCN) is input under Enter degenerate or non-degenerate methylation site sequence. This automatically displays the four possible NCG (or GCN) sequences under Select any sites that you do NOT want to screen for, and the box for GCG is checked. A toggle window is used toSelect the methylated dC residue on the forward strandthat is being queried for methylation in each DNMT site. Users alsoSelect a color to identify this site from a toggle window and Select symbolat the bottom of the panel to depict each type of
site in an exported image (see below). ClickingAddinputs the site designation and then OK is clicked to load the custom settings and close the window.
Using these settings, MethylViewer generated a grid re-porting methylation of 110 of 115 (96%) scored non-overlapping CG sites at the hMLH1 promoter in RKO cells (grid not shown). This high level of m5CG is similar to the level in the minus M.CviPI sample from RKO cells (96&91%). Moreover, the high level of m5C corresponded to methylation of only 13 of 168 (7.7%) of scored non-overlapping GC sites (GCN with GCG omitted) by M.CviPI, indicating that chromatin is highly inaccessible in epigenetically-silenced copies of hMLH1. In contrast, in HCT116 cells where hMLH1 was essentially unmethylated at endogenous CG sites and actively transcribed, the summary cell in the grid for GCN with GCG omitted indicate a high degree of accessibility to M.CviPI, with 92 of 167 (55%) scored non-overlapping GC sites being methylated.
Data saving options and publication-quality images
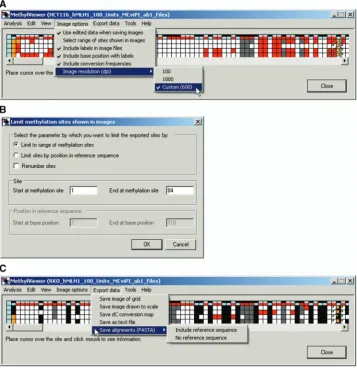
After making and editing an alignment, users can choose from several options to customize information included in exported files via the Image options menu (Figure 9A). These options include: edited data; image resolution; and
bisulfite dC conversion frequencies [(expected number of C residues to convert observed after conversion) / expected100], which are indicated at the right of each diagrammed molecule in exported images. In addition, se-lecting Include labels in image files appends the name of the original sequence data file (or sequence name follow-ing the first>symbol in FASTA files; Figure 2) at the left of each diagrammed molecule and labels DNMT site numbers. Including labels activates the further option Include base position with labels, which places these labels below the DNMT site numbers, if selected. A final option is to Select range of site shown in images (Figure 9B), which allows users to export a subset of the data within a grid to an image. For example, sites not aligned between the reference and query sequences, i.e. orange cells, can be omitted from the exported image. The exported image can retain its original sites numbers or the user can elect toRenumber sites.
Once the desired Image options have been selected, MethylViewer can save data in several formats suitable for publication or further manipulation, using the Export data menu (Figure 9C). Grid images, a text file and scaled images with the user-selected symbols and colors can be exported as bitmap (*.bmp), portable network graphics (*.png) or scalable vector graphics (*.svg) files. Export data>Save as text file provides a detailed, tab-delimited output that summarizes the sequence assigned to each scored DNMT site to facilitate further data analysis. If sequencing files were used to generate the grid, the alignment can also be exported as a text FASTA file, with or without the reference sequence.
Figure 10 shows *.svg images exported by
MethylViewer via Export data>Save image drawn to scale from each edited grid in Figure 7. These images contain symbols representing the methylation status of each DNMT site (see key at bottom of Figure 10D) spaced according to their relative position along the DNA sequence. In addition, overlapping GC and CG, i.e. GCG sites, are indicated by both default symbols, gray-filled circles and gray-filled inverted triangles. Unconverted cytosines at sites excluding designated DNMT motifs (i.e. CG and GC in this example) are indicated by horizontal blue tick marks that intersect each horizontal line representing an individual molecule at their exact position in the sequence. The detailed dC conversion analysis can also be saved to identify se-quences and areas with low conversion efficiencies. Bitmap images with 100, 1000 or a user-defined reso-lution [dots per inch (dpi)] can also be exported as shown in Figure 9A.
[image:11.612.60.298.70.356.2]In MAPit analysis, sites in DNA are methylated and hence accessible to DNMT probe if they are unoccupied by non-histone proteins or are not incorporated into a nucleosome (37–39). Spans of accessibility to M.CviPI were manually added according to a 2:2 definition in which two consecutively methylated GC sites denote ac-cessible regions (48) (Figure 10). By this definition, con-tinuity of these ‘open’ regions is only broken by 2 unmethylated GC sites. We imposed an additional caveat whereby spans of accessibility were broken if two
consecutive G-m5C sites were separated by30 bp. Based on experience, this is a reasonable footprint size for a non-histone protein that could be bound, but is thus un-detectable due to low GC site frequency. G-m5CG is ignored in denoting these accessible regions because it cannot be determined if cytosines in these sequences were methylated by endogenous DNMTs or M.CviPI. Nevertheless, given the near absence of m5CG in HCT116 cells (Figure 10A), it is highly likely that
G-m5CG in Figure 10B was catalyzed by
exogenously-added M.CviPI in addition to stand alone G-m5C (not in GCG sites). This same inference does not apply to RKO cell chromatin probed with M.CviPI in Figure 10D. It can be inferred, however, that most G-m5CG is attributable to endogenous DNMTs due to high-density, stand alone m5CG in the control sample not probed with M.CviPI (Figure 10C).
In HCT116 cells, two spans of consecutive sites were accessible to M.CviPI in each molecule (Figure 10B). Seven of these eight regions were 150 bp in length and thus may correspond to nucleosome-free regions mapped
by accessibility to M.SssI in transcriptionally-active LD419 cells (72). Each pair of M.CviPI-accessible regions flanks a 150 bp protected region, which is inferred to correspond to a single nucleosome of different translational position. Regions upstream and downstream of hyperaccessible regions associated with TSSa and TSSb of the hMLH1promoter in HCT116 cells, respectively, are likely to be protected by nucleosomes; however, their exact positions cannot be inferred in the absence of a defined linker region. Nonetheless, the majority of promoter sequences in these cells was inaccessible to M.CviPI and thus likely occupied by nucleosomes whose precise positions cannot be assigned.
Alignment and user-defined analysis of cytosine methylation of any specific site in bisulfite-converted sequences
[image:12.612.121.479.70.442.2]MethylViewer supports analysis of cytosine modification of any user-defined sequence. Analysis of C methylation in sequences containing degenerate bases is also supported by inputting IUPAC one-letter definitions, which are
provided in a pop-up window upon selecting Custom>Custom methylation sites>Show. As many as four custom user-defined sites can be entered by selecting Add. The program is versatile enough to analyze C methy-lation in any sequence context by entering ‘C’ inCreate new site. Four different symbols and six different colors are available for diagramming methylation of each bisulfite-converted sequence. As in the default CG and GC setting, if more than one site is selected; overlapping methylation is depicted as gray symbols. Custom site
def-initions can be saved by Custom methylation
sites>File>Save as and reloaded by Methylation sites>File>Open.
To demonstrate MethylViewer’s capability to analyze C modification at degenerate, non-palindromic sites, we integrated a single estrogen-inducible copy of the gene encoding M.CviPII into the budding yeast genome. This second DNMT from Chlorellavirus NYs-1 was recently cloned and shown to methylate the first C in CCD sites, where D equals A, G, or T (27). The enzyme was reported to also methylate the first two cytosines in CCAA and CCCG sites. Genomic DNA was isolated from yeast cells incubated with 100 nM 17b-estradiol inducer or ethanol vehicle in rich medium. Following bisulfite con-version, a 500-bp region of thePHO5 promoter, a locus with a well-characterized chromatin structure consisting of five upstream positioned nucleosomes (N1 to N5), was PCR amplified. Three and 17 independent clones from uninduced and estradiol-induced cells, respectively, were sequenced and analyzed by MethylViewer with custom sites of CCD, CCAA and CCCG designated (Figure 11).
As expected, the final scaled *.svg image of site accessi-bility to M.CviPII in thePHO5promoter amplicon shows no cytosines and hence no methylated sites among the three clones from cells where the M.CviPII transgene was uninduced (Figure 11A and B, top panels). In contrast, 91 of 285 (32%) scored CCD sites were methylated in induced cells (Figures 11A and B, bottom panels). Among 85 aligned CCAA sites, 25 were methylated, of which all were modified at the residue overlapping with the CCD specificity; i.e. the first, but not the second, C residue. No CCCG sites are present in the analyzedPHO5 amplicon.
Summing the methylation percentage at each site over the 17 molecules methylated by M.CviPII shows that se-quences in linkers between and at the edges of nucleo-somes exhibited the highest frequencies of methylation (Figure 11C), as we have previously shown (37,38), with two exceptions. The first exception was a high level of m5CCD at site 16, which we have observed on occasion, and is possibly due to maximum curvature in nucleosomal DNA that occurs near this location (74). The second ex-ception was relatively high accessibility to M.CviPII of various spans of sites (2:2 convention broken by separ-ation of m5CCD sites by30 bp), which are occupied by N2 when transcription of thePHO5is repressed. Several accessible patches of varying length were also observed at the edge of N3 and its adjacent linker DNA in a subset of molecules. We conclude that accessibility of chromatin can be probed by M.CviPII and rapidly analyzed and visualized by MethylViewer.
DISCUSSION
MethylViewer is a versatile, user-friendly and intuitive graphical user interface program for processing BGS data. It can either directly process and align raw sequencing files or accept text files with pre-aligned se-quences in FASTA format. An interactive grid of cells is returned that simplifies data editing and visually marks cells that have been edited and inspected for quality of sequencing calls, which are used to infer site methylation status. Viewed and edited cells in the methylation grid can be saved to files that can be opened at a future time and/or exported to images. With the exception of minor further editing to taste, the program also automatically generates publication-quality images of either the grid or standard ‘lollipop’ images that maintain widely accepted conven-tions for representing DNA methylation patterns. Users can also choose to include additional information in images, including the name of the sequence file to assist with data tracking, base pair coordinates of each queried methylation site, and dC bisulfite conversion efficiencies of cytosines not in queried methylation sites. The tab-delimited data in exported text files also make possible further external mathematical manipulations, such as correlation matrices and other statistical analyses. MethylViewer provides a substantial advance over cur-rently available BGS analysis programs, because it permits rapid and accurate interrogation of DNA methylation status of as many as four user-defined sites at a time in any biological system. The capability to specify analysis of multiple methylation sites is ideal for MAPit methylation footprinting that may employ more than one DNMT probe and/or detection of endogenous m5C (Figures 7 and 10). A crucial feature of MethylViewer for MAPit absent from other programs is the generation of scaled images with symbols spaced according to their relative position in the sequence. This allows more accurate place-ment of footprints. The graphical user interface of MethylViewer also constitutes a stand-alone, integrated solution for MAPit projects in that Tools>Bisulfite primer design. . .aids users in designing primers that meet the further challenge of avoiding probed GC sites in addition to endogenous CG sites. Analysis and primer design are also therefore not limited to sites commonly methylated in vertebrates (CG) and plants (CGN, CHG and CHH or CNG) as are other programs (53,54,56–60).
abundant non-CG methylation (m5CHG and m5CHH) (19–24). MethylViewer can also analyze BGS data from organisms, such as Neurospora crassa and Ascobolus immersus, which, respectively, pre-meiotically methylate DNA repeats at C-5 without strict site specificity (18). Lastly, MethylViewer can be used to analyze methylation by BGS that involves replicative incorporation of modified nucleotides, e.g. bacteriophage T4 or potential PCR applications.
We have shown that M.CviPI is as effective as M.SssI for probing chromatin structure of active loci at single-molecule resolution [Figures 7B and 10B; (48,49,72)]. In particular, similar accessibility of mostly nucleosome-length regions (147 bp) to both DNMT probes was found near hMLH1 TSSa and TSSb in the
colorectal cell lines HCT116 and LD419. However, unlike M.SssI, probing accessibility of GC sites with M.CviPI (28) enables simultaneous determination of both chromatin accessibility and endogenous m5CG in mammalian cells (Figures 7 and 10).
Availability of two other DNMTs with short recogni-tion sites in addirecogni-tion to M.SssI, M.CviPI (GC) and M.CviPII (CCD, CCAA and CCCG), significantly in-creases the resolution for mapping chromatin structure. As seen in Figure 11, 17-fold coverage of the PHO5
promoter region probed with M.CviPII was able to detect overall preferential accessibility in linker regions between both N1 and N2 (sites 4, 6 and 7) and N2 and N3 (sites 12–14). Similar patterns of overall acces-sibility of thePHO5promoter and other loci to M.CviPII,
100% Induced_MCviPII_PHO5_06.ab1
100% Induced_MCviPII_PHO5_09.ab1
100% Induced_MCviPII_PHO5_04.ab1
99% Induced_MCviPII_PHO5_07.ab1
100% Induced_MCviPII_PHO5_01.ab1
99% Induced_MCviPII_PHO5_16.ab1
99% Induced_MCviPII_PHO5_02.ab1
99% Induced_MCviPII_PHO5_15.ab1
97% Induced_MCviPII_PHO5_17.ab1
100% Induced_MCviPII_PHO5_10.ab1
100% Induced_MCviPII_PHO5_05.ab1
97% Induced_MCviPII_PHO5_12.ab1
100% Induced_MCviPII_PHO5_03.ab1
99% Induced_MCviPII_PHO5_14.ab1
99% Induced_MCviPII_PHO5_13.ab1
99% Induced_MCviPII_PHO5_08.ab1
100% Induced_MCviPII_PHO5_11.ab1
5 10 15
100% Uninduced_MCviPII_PHO5_1.ab1
100% Uninduced_MCviPII_PHO5_2.ab1
100% Uninduced_MCviPII_PHO5_3.ab1
0 10 20 30 40 50 60 70 80
1 2
3 4
5 6
7 8 9 10 11 12 13
14
15 16 17
100 200 300 400 500
+ 1 N 1 N 2 N 3
UASp1 UASp2
UASm
% Methylation
CCD site TATA
1 3
5
10
15 1
Uninduced M.CviPII
Induced M.CviPII A
[image:15.612.69.560.68.452.2]B C
Figure 11. MethylViewer analyses MAPit data using degenerate DNMT probe. (A) Publication-quality, scaled *.svg image of bisulfite-converted
PHO5sequences obtained from cells with uninduced (top panel) or estrogen-induced (bottom panel) expression of chromatin probe M.CviPII. Colors are as in other figures, except that CCD and m5CCD sites are indicated by filled white and filled purple triangles, respectively. (
M.CviPI and M.SssI have been observed. This demon-strates that single-molecule footprinting is reproducible with different DNMTs in diverse systems (cell types, loci and in vitro-assembled chromatin), and in different laboratories (38,40,41,75,76).
The single-molecule view afforded by MAPit allows one to obtain an accurate picture of how methylation is par-titioned amongst the molecules. A good illustration of this occurred in the region occupied byPHO5N2; sequenced promoter molecules clearly clustered into one subpopulation inaccessible to M.CviPII and another with stretches of accessible sequence. Different lengths of accessible sequence may represent partial or complete dis-assembly of N2 nucleosomes or differential degrees of sliding of the N2 octamer on individual molecules (77). Sites at the edges of positioned nucleosomes may also be accessed by DNMTs due to ‘breathing’ or site exposure at the entry-exit sites (78–80). The two distinct subpopulations may also be indicative promoters that have remodeled or are in the process of remodeling
PHO5 promoter chromatin. The experiment in
Figure 11 was performed on a population of yeast cells grown asynchronously in rich medium, which contains cells that have activated PHO5transcription in M phase and have repressed transcription in G1to early S phase
(81). The MAPit results are thus consistent with
subpopulations of yeast cells containing
transcriptionally-active or -inactive copies of PHO5. Verification of this hypothesis and distinguishing between different possibilities of chromatin remodeling require more extensive MAPit analysis as well as addition-al studies.
In closing, MethylViewer should greatly facilitate efforts of genome-wide analysis of m5C via BGS. We will publicly host our server to the increasing number of researchers studying the role of DNA methylation in epi-genetic regulation who we expect will find MethylViewer a valuable freely available resource.
SUPPLEMENTARY DATA
Supplementary Data are available at http://dna.leeds.ac. uk/methylviewer/.
ACKNOWLEDGEMENTS
The authors thank Christopher A. Fuhrman for construc-tion of pCF1439 and yeast strains CFY4011 and CFY4012. The authors also thank Nancy H. Nabilsi for helpful suggestions of program features and for editing the manuscript.
FUNDING
Cancer Research UK (to A.F.M.); Sir Jules Thorn Award for Biomedical Research (to D.T.B.); National Institutes of Health [grant number CA095525 (to M.P.K.)]; Department of Defense [grant numbers BC062914 and BC087311 (to M.P.K.)]; Bankhead-Coley Florida Cancer Research Program [2009 Bridge Grant (to M.P.K.)].
Funding for open access charge: Start-up funds from the University of Florida Shands Cancer Center, University of Florida College of Medicine.
Conflict of interest statement. The author M.P.K. has indicated that he shares royalties for the M.CviPI enzyme used as chromatin probe in the article with co-inventors.
REFERENCES
1. Goll,M.G. and Bestor,T.H. (2005) Eukaryotic cytosine methyltransferases.Annu. Rev. Biochem.,74, 481–514.
2. Bird,A. (2002) DNA methylation patterns and epigenetic memory.
Genes Dev.,16, 6–21.
3. Raleigh,E.A. and Brooks,J.E. (1998) In De Bruijn,F.J., Lupski,J.R. and Weinstock,G.M. (eds),Bacterial Genomes. Chapman and Hall, New York, pp. 78–92.
4. Feng,T.Y., Tu,J. and Kuo,T.T. (1978) Characterization of deoxycytidylate methyltransferase inXanthomonas oryzaeinfected with bacteriophage Xp12.Eur. J. Biochem.,87, 29–36.
5. Grossman,L. (1981) Enzymes involved in the repair of damaged DNA.Arch. Biochem. Biophys.,211, 511–522.
6. Wilson,G.G. and Murray,N.E. (1991) Restriction and modification systems.Annu. Rev. Genet.,25, 585–627. 7. Bestor,T.H. and Bourc’his,D. (2004) Transposon silencing and
imprint establishment in mammalian germ cells.Cold Spring Harb. Symp. Quant. Biol.,69, 381–387.
8. Feinberg,A.P., Ohlsson,R. and Henikoff,S. (2006) The epigenetic progenitor origin of human cancer.Nat. Rev. Genet.,7, 21–33. 9. Jaenisch,R. and Bird,A. (2003) Epigenetic regulation of gene
expression: how the genome integrates intrinsic and environmental signals.Nat. Genet.,33, 245–254.
10. Jones,P.A. and Baylin,S.B. (2007) The epigenomics of cancer.
Cell,128, 683–692.
11. Robertson,K.D. (2001) DNA methylation, methyltransferases, and cancer.Oncogene,20, 3139–3155.
12. Robertson,K.D. (2005) DNA methylation and human disease.
Nat. Rev. Genet.,6, 597–610.
13. Henderson,I.R. and Jacobsen,S.E. (2007) Epigenetic inheritance in plants.Nature,447, 418–424.
14. Zilberman,D., Gehring,M., Tran,R.K., Ballinger,T. and Henikoff,S. (2007) Genome-wide analysis ofArabidopsis thaliana
DNA methylation uncovers an interdependence between methylation and transcription.Nat. Genet.,39, 61–69. 15. Cokus,S.J., Feng,S., Zhang,X., Chen,Z., Merriman,B.,
Haudenschild,C.D., Pradhan,S., Nelson,S.F., Pellegrini,M. and Jacobsen,S.E. (2008) Shotgun bisulphite sequencing of the
Arabidopsisgenome reveals DNA methylation patterning.Nature,
452, 215–219.
16. Feng,S., Cokus,S.J., Zhang,X., Chen,P.Y., Bostick,M., Goll,M.G., Hetzel,J., Jain,J., Strauss,S.H., Halpern,M.E.et al. (2010) Conservation and divergence of methylation patterning in plants and animals.Proc. Natl. Acad. Sci. USA,107, 8689–8694. 17. Zemach,A., McDaniel,I.E., Silva,P. and Zilberman,D. (2010)
Genome-wide evolutionary analysis of eukaryotic DNA methylation.Science,328, 916–919.
18. Selker,E.U. (1990) Premeiotic instability of repeated sequences in
Neurospora crassa.Annu. Rev. Genet.,24, 579–613.
19. Kouidou,S., Agidou,T., Kyrkou,A., Andreou,A., Katopodi,T., Georgiou,E., Krikelis,D., Dimitriadou,A., Spanos,P., Tsilikas,C.
et al. (2005) Non-CpG cytosine methylation of p53 exon 5 in non-small cell lung carcinoma.Lung Cancer,50, 299–307. 20. Laurent,L., Wong,E., Li,G., Huynh,T., Tsirigos,A., Ong,C.T.,
Low,H.M., Kin Sung,K.W., Rigoutsos,I., Loring,J.et al. (2010) Dynamic changes in the human methylome during differentiation.
Genome Res.,20, 320–331.
21. Latham,T., Gilbert,N. and Ramsahoye,B. (2008) DNA methylation in mouse embryonic stem cells and development.
Cell Tissue Res.,331, 31–55.
methyltransferase 1 is required forde novoestablishment of a complex pattern of non-CpG methylation.PLoS One,2, e1136. 23. Lister,R., Pelizzola,M., Dowen,R.H., Hawkins,R.D., Hon,G.,
Tonti-Filippini,J., Nery,J.R., Lee,L., Ye,Z., Ngo,Q.M.et al. (2009) Human DNA methylomes at base resolution show widespread epigenomic differences.Nature,462, 315–322. 24. Hawkins,R.D., Hon,G.C., Lee,L.K., Ngo,Q., Lister,R.,
Pelizzola,M., Edsall,L.E., Kuan,S., Luu,Y., Klugman,S.et al. (2010) Distinct epigenomic landscapes of pluripotent and lineage-committed human cells.Cell Stem Cell,6, 479–491. 25. Nelson,M., Burbank,D.E. and Van Etten,J.L. (1998)Chlorella
viruses encode multiple DNA methyltransferases.Biol. Chem.,
379, 423–428.
26. Nelson,M., Zhang,Y. and Van Etten,J.L. (1993) DNA
methyltransferases and DNA site-specific endonucleases encoded byChlorellaviruses.EXS.,64, 186–211.
27. Chan,S.H., Zhu,Z., Van Etten,J.L. and Xu,S.Y. (2004) Cloning of CviPII nicking and modification system fromChlorella virus
NYs-1 and application of Nt.CviPII in random DNA amplification.Nucleic Acids Res.,32, 6187–6199.
28. Xu,M., Kladde,M.P., Van Etten,J.L. and Simpson,R.T. (1998) Cloning, characterization and expression of the gene coding for a cytosine-5-DNA methyltransferase recognizing GpC.Nucleic Acids Res.,26, 3961–3966.
29. Frommer,M., McDonald,L.E., Millar,D.S., Collis,C.M., Watt,F., Grigg,G.W., Molloy,P.L. and Paul,C.L. (1992) A genomic sequencing protocol that yields a positive display of 5-methylcytosine residues in individual DNA strands.
Proc. Natl Acad. Sci. USA,89, 1827–1831.
30. Clark,S.J., Harrison,J., Paul,C.L. and Frommer,M. (1994) High sensitivity mapping of methylated cytosines.Nucleic Acids Res.,
22, 2990–2997.
31. Hayatsu,H. and Shiragami,M. (1979) Reaction of bisulfite with the 5-hydroxymethyl group in pyrimidines and in phage DNAs.
Biochemistry,18, 632–637.
32. Vilkaitis,G. and Klimasauskas,S. (1999) Bisulfite sequencing protocol displays both 5-methylcytosine and N4-methylcytosine.
Anal. Biochem.,271, 116–119.
33. Huang,Y., Pastor,W.A., Shen,Y., Tahiliani,M., Liu,D.R. and Rao,A. (2010) The behaviour of 5-hydroxymethylcytosine in bisulfite sequencing.PLoS One,5, e8888.
34. Klimasauskas,S., Gerasimaite,R., Vilkaitis,G. and Kulakauskas,S. (2002) N4,5-dimethylcytosine, a novel hypermodified base in DNA.Nucleic Acids Res.,2 (Suppl.), 73–74.
35. Singh,J. and Klar,A.J.S. (1992) Active genes in yeast display enhancedin vivoaccessibility to foreign DNA methylases: a novel
in vivoprobe for chromatin structure of yeast.Genes Dev.,6, 186–196.
36. Gottschling,D.E. (1992) Telomere-proximal DNA in
Saccharomyces cerevisiaeis refractory to methyltransferase activityin vivo.Proc. Natl Acad. Sci. USA,89, 4062–4065. 37. Kladde,M.P., Xu,M. and Simpson,R.T. (1996) Direct study of
DNA-protein interactions in repressed and active chromatin in living cells.EMBO J.,15, 6290–6300.
38. Jessen,W.J., Dhasarathy,A., Hoose,S.A., Carvin,C.D., Risinger,A.L. and Kladde,M.P. (2004) Mapping chromatin structurein vivousing DNA methyltransferases.Methods,33, 68–80.
39. Jessen,W.J., Hoose,S.A., Kilgore,J.A. and Kladde,M.P. (2006) ActivePHO5chromatin encompasses variable numbers of nucleosomes at individual promoters.Nat. Struct. Mol. Biol.,13, 256–263.
40. Kilgore,J.A., Hoose,S.A., Gustafson,T.L., Porter,W. and Kladde,M.P. (2007) Single-molecule and population probing of chromatin structure using DNA methyltransferases.Methods,41, 320–332.
41. Pardo,C., Hoose,S.A., Pondugula,S. and Kladde,M.P. (2009) DNA methyltransferase probing of chromatin structure within populations and on single molecules.Methods Mol. Biol.,523, 41–65.
42. Kladde,M.P. and Simpson,R.T. (1994) Positioned nucleosomes inhibit Dam methylationin vivo.Proc.Natl Acad. Sci. USA,91, 1361–1365.
43. Xu,M., Simpson,R.T. and Kladde,M.P. (1998) Gal4p-mediated chromatin remodeling depends on binding site position in
nucleosomes but does not require DNA replication.Mol. Cell. Biol.,18, 1201–1212.
44. Vyhlidal,C., Samudio,I., Kladde,M.P. and Safe,S. (2000) Transcriptional activation of transforming growth factoraby estradiol: requirement for both a GC-rich site and an estrogen response element half-site.J. Mol. Endocrinol.,24, 329–338. 45. Samudio,I., Vyhlidal,C., Wang,F., Stoner,M., Chen,I., Kladde,M.,
Barhoumi,R., Burghardt,R. and Safe,S. (2001) Transcriptional activation of deoxyribonucleic acid polymeraseagene expression in MCF-7 cells by 17b-estradiol.Endocrinology,142, 1000–1008. 46. Nur,I., Szyf,M., Razin,A., Glaser,G., Rottem,S. and Razin,S.
(1985) Procaryotic and eucaryotic traits of DNA methylation in spiroplasmas (mycoplasmas).J. Bacteriol.,164, 19–24.
47. Renbaum,P., Abrahamove,D., Fainsod,A., Wilson,G., Rottem,S. and Razin,A. (1990) Cloning, characterization, and expression in
Escherichia coliof the gene coding for the CpG DNA from
Spiroplasmasp strain MQ-1 (M.SssI).Nucleic Acids Res.,18, 1145–1152.
48. Fatemi,M., Pao,M.M., Jeong,S., Gal-Yam,E.N., Egger,G., Weisenberger,D.J. and Jones,P.A. (2005) Footprinting of mammalian promoters: use of a CpG DNA methyltransferase revealing nucleosome positions at a single molecule level.
Nucleic Acids Res.,33, e176.
49. Gal-Yam,E.N., Jeong,S., Tanay,A., Egger,G., Lee,A.S. and Jones,P.A. (2006) Constitutive nucleosome depletion and ordered factor assembly at theGRP78promoter revealed by single molecule footprinting.PLoS Genet.,2, e160.
50. Pondugula,S. and Kladde,M.P. (2008) Single-molecule analysis of chromatin: changing the view of genomes one molecule at a time.
J. Cell. Biochem.,105, 330–337.
51. Li,L.C. and Dahiya,R. (2002) MethPrimer: designing primers for methylation PCRs.Bioinformatics,18, 1427–1431.
52. Aranyi,T. and Tusnady,G.E. (2007) BiSearch: ePCR tool for native or bisulfite-treated genomic template.Methods Mol. Biol.,
402, 385–402.
53. Ordway,J.M., Bedell,J.A., Citek,R.W., Nunberg,A.N. and Jeddeloh,J.A. (2005) MethylMapper: a method for high-throughput, multilocus bisulfite sequence analysis and reporting.Biotechniques,39, 464–472.
54. Bock,C., Reither,S., Mikeska,T., Paulsen,M., Walter,J. and Lengauer,T. (2005) BiQ Analyzer: visualization and quality control for DNA methylation data from bisulfite sequencing.
Bioinformatics,21, 4067–4068.
55. Rohde,C., Zhang,Y., Jurkowski,T.P., Stamerjohanns,H., Reinhardt,R. and Jeltsch,A. (2008) Bisulfite sequencing Data Presentation and Compilation (BDPC) web server–a useful tool for DNA methylation analysis.Nucleic Acids Res.,36, e34. 56. Xu,Y.H., Manoharan,H.T. and Pitot,H.C. (2007) CpG
PatternFinder: a Windows-based utility program for easy and rapid identification of the CpG methylation status of DNA.
Biotechniques,43, 334–342.
57. Grunau,C., Schattevoy,R., Mache,N. and Rosenthal,A. (2000) MethTools–a toolbox to visualize and analyze DNA methylation data.Nucleic Acids Res.,28, 1053–1058.
58. Singal,R. and Grimes,S.R. (2001) Microsoft Word macro for analysis of cytosine methylation by the bisulfite deamination reaction.Biotechniques,30, 116–120.
59. Hetzl,J., Foerster,A.M., Raidl,G. and Mittelsten-Scheid,O. (2007) CyMATE: a new tool for methylation analysis of plant genomic DNA after bisulphite sequencing.Plant J.,51, 526–536. 60. Carr,I.M., Valleley,E.M., Cordery,S.F., Markham,A.F. and
Bonthron,D.T. (2007) Sequence analysis and editing for bisulphite genomic sequencing projects.Nucleic Acids Res.,35, e79. 61. Roca,J., Gartenberg,M.R., Oshima,Y. and Wang,J.C. (1992) A
hit-and-run system for targeted genetic manipulations in yeast.
Nucleic Acids Res.,20, 4671–4672.
62. Darst,R.P., Pardo,C., Ai,L., Brown,K.D. and Kladde,M.P. (2010) Bisulphite sequencing of DNA.Curr. Protoc. Mol. Biol.,Chapter 21, Unit 7.9.1–16.
63. Adams,A., Gottschling,D.E., Kaiser,C.A. and Stearns,T. (1997)
64. Shiraishi,M. and Hayatsu,H. (2004) High-speed conversion of cytosine to uracil in bisulfite genomic sequencing analysis of DNA methylation.DNA Res.,11, 409–415.
65. Stewart,F.J., Panne,D., Bickle,T.A. and Raleigh,E.A. (2000) Methyl-specific DNA binding by McrBC, a
modification-dependent restriction enzyme.J. Mol. Biol.,298, 611–622.
66. Bronner,C.E., Baker,S.M., Morrison,P.T., Warren,G., Smith,L.G., Lescoe,M.K., Kane,M., Earabino,C., Lipford,J., Lindblom,A.
et al. (1994) Mutation in the DNA mismatch repair gene homolog hMLH1is associated with hereditary nonpolyposis colon-cancer.Nature,368, 258–261.
67. Esteller,M., Levine,R., Baylin,S.B., Ellenson,L.H. and Herman,J.G. (1998)MLH1promoter hypermethylation is associated with the microsatellite instability phenotype in sporadic endometrial carcinomas.Oncogene,17, 2413–2417. 68. Veigl,M.L., Kasturi,L., Olechnowicz,J., Ma,A.H.,
Lutterbaugh,J.D., Periyasamy,S., Li,G.M., Drummond,J., Modrich,P.L., Sedwick,W.D.et al. (1998) Biallelic inactivation of hMLH1by epigenetic gene silencing, a novel mechanism causing human MSI cancers.Proc. Natl Acad. Sci. USA,95, 8698–8702. 69. Esteller,M., Corn,P.G., Baylin,S.B. and Herman,J.G. (2001) A
gene hypermethylation profile of human cancer.Cancer Res.,61, 3225–3229.
70. Esteller,M. (2007) Cancer epigenomics: DNA methylomes and histone-modification maps.Nat. Rev. Genet.,8, 286–298. 71. Herman,J.G. and Baylin,S.B. (2003) Mechanisms of disease: gene
silencing in cancer in association with promoter hypermethylation.
N. Engl. J. Med.,349, 2042–2054.
72. Lin,J.C., Jeong,S., Liang,G., Takai,D., Fatemi,M., Tsai,Y.C., Egger,G., Gal-Yam,E.N. and Jones,P.A. (2007) Role of nucleosomal occupancy in the epigenetic silencing of the
MLH1CpG island. Cancer Cell,12, 432–444.
73. Altschul,S.F., Gish,W., Miller,W., Myers,E.W. and Lipman,D.J. (1990) Basic local alignment search tool.J. Mol. Biol.,215, 403–410.
74. Luger,K., Mader,A.W., Richmond,R.K., Sargent,D.F. and Richmond,T.J. (1997) Crystal structure of the nucleosome core particle at 2.8 A˚ resolution.Nature,389, 251–260.
75. Hoose,S.A. and Kladde,M.P. (2006) DNA methyltransferase probing of DNA-protein interactions.Methods Mol. Biol., 338, 225–244.
76. Kladde,M.P., Xu,M. and Simpson,R.T. (1999) DNA methyltransferases as probes of chromatin structurein vivo.
Methods Enzymol.,304, 431–447.
77. Dechassa,M.L., Sabri,A., Pondugula,S., Kassabov,S.R.,
Chatterjee,N., Kladde,M.P. and Bartholomew,B. (2010) SWI/SNF has intrinsic nucleosome disassembly activity that is dependent on adjacent nucleosomes.Mol. Cell,38, 590–602.
78. Polach,K.J. and Widom,J. (1995) Mechanism of protein access to specific DNA sequences in chromatin: a dynamic equilibrium model for gene regulation.J. Mol. Biol., 254, 130–149. 79. Polach,K.J. and Widom,J. (1996) A model for the cooperative
binding of eukaryotic regulatory proteins to nucleosomal target sites.J. Mol. Biol.,258, 800–812.
80. Li,G. and Widom,J. (2004) Nucleosomes facilitate their own invasion.Nat. Struct. Mol. Biol.,11, 763–769.
81. Pondugula,S., Neef,D.W., Voth,W.P., Darst,R.P., Dhasarathy,A., Reynolds,M.M., Takahata,S., Stillman,D.J. and Kladde,M.P. (2009) Coupling phosphate homeostasis to cell cycle-specific transcription: mitotic activation ofSaccharomyces cerevisiae PHO5by Mcm1 and Forkhead proteins.Mol. Cell. Biol.,29, 4891–4905.
![Figure 11. MethylViewer analyses MAPit data using degenerate DNMT probe. ((82); upstream activating sequences at which Pho4 binds [red-filled circles labeled UASp1 and UASp2 as mapped by Vogel and Hinnen (83)]; thecompound Mcm1-Fkh site [cyan-filled rectangl](https://thumb-us.123doks.com/thumbv2/123dok_us/7997299.207684/15.612.69.560.68.452/methylviewer-analyses-degenerate-upstream-activating-sequences-thecompound-rectangl.webp)
