Changes in peripheral blood immune cell composition
in osteoarthritis
F. Ponchel
*, A.N. Burska, E.M.A. Hensor, R. Raja
a, M. Campbell
b, P. Emery, P.G. Conaghan
Leeds Institute of Rheumatic and Musculoskeletal Medicine&NIHR-Leeds Musculoskeletal Biomedical Research Unit, Leeds University of Leeds, Leeds, UK
a r t i c l e i n f o
Article history:
Received 29 December 2014 Accepted 29 June 2015
Keywords: OA
Blood cell composition Cell subsets/phenotype Ageing
s u m m a r y
Objectives: Immune age-related abnormalities may synergise with osteoarthritis (OA) pathology. We explored whether abnormalities in the blood immune cell composition are present in OA, beyond defects typically associated with ageing.
Design: Blood was collected from 121 healthy controls (HC) and 114 OA patients. Synovial biopsies were obtained from another 52 OA patients. Flow cytometry was used to establish the frequencies of lineage subsets, naïve, memory and regulatory T and B-cells, cells with an abnormal phenotype related to inflammation (IRC) and memory-like CD8þT-cells. Multivariate analysis of covariance (MANCOVA) was used to determine whether the relative subset frequencies differed between HC and OA, controlling for age.
Results:Expected histology and T/B-cell infiltration were observed.
Following age adjusted analysis, we confirmed the lack of age association in HC for CD4þ, B, NK and NKT cells but a negative trend for CD8þT-cells. In OA, CD4þT-cell and B-cell frequency were lower compared to HC while CD8þT-cell frequencies were higher. CD8þmemory-like cells were more likely to be found in OA (odds ratio¼15). Increased CD8þIRC frequencies were also present in OA. The relationship between age and CD4þor CD8þnaïve T-cells in HC were changed in OA while the age relationships with memory cells were lost. The increase in CD4þTreg with age was also lost in OA. B-cells showed limited evidence of disturbance.
Conclusions: Immune dysfunction may be present in OA beyond what appears related to ageing; this requires further investigation.
©2015 The Authors. Published by Elsevier Ltd and Osteoarthritis Research Society International. This is an open access article under the CC BY license (http://creativecommons.org/licenses/by/4.0/).
Introduction
Ageing is a complex phenomenon involving several human systems, simultaneously interacting at different levels1. It affects cells, tissues and whole organs; it diminishes homeostasis and increases vulnerability2. Many pathways, including the immune
system (IS), have been shown to be involved in ageing and age-related diseases3,4. In the very elderly, infectious disease is the primary cause of death, highlighting the importance of the adaptive IS. Acquired immune responses decline with age, with poor responses to vaccination, increased susceptibility to infec-tion, higher prevalence of certain cancers associated with viral infection or emerging pathogens5,6. In addition, there is increased intrinsic difficulty in dealing with common pathogens, notably herpes zoster or cytomegalovirus (CMV). Paradoxically, this decline is accompanied by an increase in auto-reactivity and the generation of autoantibodies7,8. In addition, a wide range of etiological factors contribute to increased low-grade infl amma-tion (known as inflammageing) including chronic antigenic burden, decreased production of sex steroids, subclinical disor-ders such as atherosclerosis, asymptomatic bacteriuria, as well as cellular senescence of immune cells3,4,6. The inflammatory *Address correspondence and reprint requests to: F. Ponchel, Leeds Institute of
Rheumatic and Musculoskeletal Medicine, St James University Hospital, Clinical Science Building, L5, R 5.25, LS9 7TF, Leeds, UK. Tel: 44 (0) 1132065673.
E-mail addresses:F.Ponchel@leeds.ac.uk (F. Ponchel),A.N.Burska@leeds.ac.uk
(A.N. Burska), E.M.A.Hensor@leeds.ac.uk (E.M.A. Hensor), rafi@rocketmail.com
(R. Raja),campbetm@hotmail.com(M. Campbell),P.Emery@leeds.ac.uk(P. Emery),
P.Conaghan@leeds.ac.uk(P.G. Conaghan).
aCurrent address: Rheumatology and Immunology Department, Christchurch
Hospital, Private Bag 4710, Christchurch 8140, New Zealand.
b Current address: Department of Physical Medicine and Rehabilitation, Eli-sabeth-Bruyere Hospital, 43 Bruyere Street, K1N 5C8 Ottawa, Ontario, Canada.
http://dx.doi.org/10.1016/j.joca.2015.06.018
response in ageing therefore represents a major potential contributor to age-related conditions.
Osteoarthritis (OA) is strongly age-related9, with evidence of radiographic OA highly prevalent in individuals over the age of 60, though clinically symptomatic OA occurs in a smaller per-centage10. Many of the age-related and inflammation-prone pathways may be involved in OA. Certain abnormalities of the IS including change in T-cell reactivity11, development of auto-antibodies12, telomere shortening13and activation of infl amma-tory mechanisms14 have been reported in OA15. Biomechanical stresses have been proposed as a source of immune stimulation in OA16,17and another hypothesis proposes that collagen break-down reveals neo-antigens leading to T/B-cell responses18. Products of cartilage/bone degradation promote persistent low grade inflammation and synovitis both increasingly recognised as important symptoms of OA19. Innate immune responses to calcium crystal deposition have also been reported to activate the inflammasome pathway20.
We hypothesized that the complex interplay between the musculoskeletal system and IS may be in part responsible for the development of the clinical syndrome of OA. The aims of this study were therefore to determine if abnormalities in the blood immune cell composition were associated with OA, beyond the defects related to age. We investigated lineage composition for CD4þand CD8þ T-cells, B-cells, NK-cells and CD56þ T-cells (subsequently referred to as NKT-cells) and phenotyped T-cells and B-cells further for naïve, memory and regulatory subsets as well as for two other cell populations: IRC and memory-like cells.
Materials and methods
Patients
Blood samples (EDTA 4 ml) were collected from 121 healthy controls (HC) and 114 patients with OA, and arthroscopically-obtained synovial tissue biopsies from a separate 52 OA patients. The studies were approved by the local Research Ethics Committee and all participants gave written an informed consent.
The HC were recruited from Leeds University staff to specifically include a wide range of age in order to establish reference ranges for healthy ageing. Particular attention was given to excluding HC with any joint symptoms.
The OA blood samples were collected from patients recruited from two main sources. Firstly patients from primary and second-ary care clinics were recruited into clinical studies where ACR OA clinical criteria were required for inclusion (n ¼74); a baseline blood specimen was obtained in these participants. Secondly pa-tients in a secondary care orthopaedic clinic who had been referred for joint replacement and had radiographic OA were sampled (n¼40). The included patients had OA at different anatomical sites, with the majority having knee OA but over half having OA in at least two anatomical locations (Table Iprovides detailed numbers). De-mographic and clinical characteristics were recorded in the OA patients: age, sex, height and weight, calculated BMI and anatom-ical location of joint(s) affected by OA (summarised inTable I).
Synovial tissue samples were obtained from patients with ACR clinical OA and evidence of cartilage loss during knee arthroscopy, using 3.5 mm grasping biopsy forceps under direct vision using a Hopkins 2.7 mm 300 arthroscope. A Visual Analogue Score (VAS) was used as a parameter of macroscopic joint inflammation. Scoring was based on the visual inspection of vessels and hyper-emia in the synovial membrane21. Synovial biopsies were taken from areas of macroscopic synovitis. Age and sex were recorded for these patients (Table I).
Tissue sample processing
Tissue for light microscopy wasfixed in 10% neutral buffered formalin. Sections were then dewaxed in xylene and ethanol, then washed in water and stained with Mayers Haematoxylin and counterstained in 1% aqueous Eosin Y after which they were dehydrated in ethanol cleared in xylene and mounted in DPX.
The paraffin embedded sections were dewaxed in Access Super solution (Menarini diagnostics) then stained. Staining was per-formed using standard X-Cell plus staining kit (Menarini di-agnostics) with modification according to individual primary antibody host species according to manufacturer's instructions. Incubation were with primary monoclonal antibody anti CD3 (rabbit monoclonal clone SP7 Abcam cat ab16669 (1:200), anti CD68 (Rat monoclonal Abcam ab53444, 1:100) and anti CD20 (M-20 Goat polyclonal Santa Cruz sc-7735, 1:(M-200)). The slides were then counterstained in haematoxylin.
Flow cytometry
8-colours flow-cytometry was performed using standard pro-tocols for cell surface and intracellular staining to establish the frequencies of: CD4þand CD8þT-cells (CD3þCD4þand CD3þCD8þ), B-cells (CD19þ), NK (CD56þCD3-) and NKT-cells (CD56þCD3þ). CD4þand CD8þT-cells with a naïve (CD45RBhighCD45RAþCD62Lþ) and memory (CD45RBlowhCD45RACD62L) phenotypes were subsequently analysed as well as cells with an abnormal phenotype (Inflammation Related Cells, IRC: CD45RBhigh CD45RAþCD62L) identified in inflammatory arthritis in relationship with CRP22. An additional CD8þT-cell population with a memory-like phenotype (CD45RBlowCD45RACD62Lþ) was also present in some but not all samples (see Supplementary Figures). Regulatory T-cells (CD3þCD4þCD25highFoxp3þCD127low) were identified in a sepa-rate panel. B-cell analysis included a phenotyping panel for naïve (CD19þCD27CD38high), memory (CD19þCD27þCD38low), and pu-tative regulatory-B-cells defined as transitional T2 cells (CD19þCD38highCD24high), which are known to include regulatory B-cells in human even if not only those, the intracellular expression of IL-10 remaining the defining feature of Breg. A population of Pre-plasma cells (PPC: CD19þCD27þCD38high) could be identified in some sample but not all. All antibody clones used are described in Supplementaryfile Table S1with gating strategies exemplified in Figure S1(A, B, C, D).
Table I
Descriptive characteristics of the studied groups
HC (n¼121)
Mean age in years(SD), range 44.0 (12.7), 19-71
Sex M/F 37/85
OA biopsies (n¼52)
Mean age in years(SD), range 57 (13.5), 30-89
Sex M/F 32/82
OA (n¼114)
Mean age in years(SD), range 64 (10.9), 48-85
Sex M/F 32/82
Mean BMI, (range)* 30 (21e50)
Mean symptom duration in years, (range)* 10 (1e35)
Family history (n)* 46
Anatomical localisation (n)y
knee 76
hip 30
hand 32
foot 13
ankle 2
*BMI was available for 96 OA patients, while symptom duration and family
history were recorded for 62 patients.
Statistical analysis
Comparison between tissue architecture groups in synovial bi-opsies was performed using ManneWhitney U-test and Spear-man's correlation coefficient.
Following appropriate transformation of variables where necessary to an approximate Gaussian distribution, we used multivariate analysis of covariance (MANCOVA) to determine whether the relative subset frequencies differed between HC and OA, controlling for age. This approach was chosen to account for the inter-relationships between frequencies therefore we ran separate models for lymphocyte lineages (including NK, NKT, CD8þT-cells, CD4þT-cells, B-cells), CD4þT-cell phenotypes (naïve, memory and IRC), CD8þ T-cell phenotypes (as for CD4þ) and B-cells (naïve, memory and putative T2/Breg). Age-adjusted between-groups differences were first calculated assuming the association with age was the same in both groups. An interaction term between age and group was then added to verify whether this assumption was reasonable. If the interaction was significant at the 10% level, changes with age were presented separately for HC and OA.
In the case of Treg cells, linear regression was used, according to the same analysis strategy. Memory-like CD8þT-cells and PPC were analysed separately as not detected in all samples,first using lo-gistic regression to identify age-adjusted between-group differ-ences in the odds of them being present, followed by linear regression restricted to patients in whom the cells were detected. Analyses were conducted in SPSS 21.0.0.1 and Stata 13.1.
Results
Synovial tissue
In 26 of the OA synovial tissue biopsies, a VAS was available and ranged from 3 to 80 with a median at 35, suggesting quite high inflammatory scores. Synovitis was evaluated using a scoring sys-tem21,23 utilising thickness of the lining layer, infiltration of
immune cells in the stromal compartment of the synovial mem-brane and their higher organisation in aggregates or germinal centre-like structures. The score ranged from 0 to 8 with a median of 2.5. VAS was directly associated with the synovitis score (rho¼ þ0.493,P¼0.012).
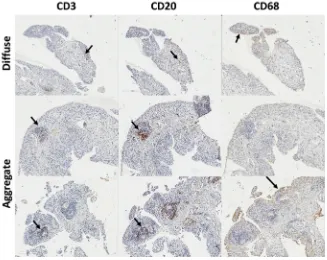
In 13 samples, the histological appearance of the tissue was normal (synovitis score of 0). In half of the samples (28/52), T-cells (CD3) and B-cells (CD20) could be identified, suggesting diffuse infiltration and this was associated with intermediate VAS (9e70) and synovitis histological scores (0.5e5). In 10 cases formation of small lymphocyte aggregates could be observed (Fig. 1), VAS range 6e80, and synovitis scores 2.5e6. The presence of an ectopic germinal centre-like structure was only seen in one sample (VAS 72, synovitis score 8).
Differences in immune cell composition between HC and OA
Lymphocyte lineages
When all immune cell lineages were considered simultaneously, there was an overall association with age (P¼0.008) but having adjusted for age there was no evidence of a difference between HC and OA (F(4,195)¼1.14,P¼0.338). Assuming the association with age was the same in both groups, looking at the age-adjusted re-sults for individual lineages (Table II), there were no differences in the levels of each lineage between HC and OA, consistent with the non-significant overall test. However, when an interaction term was added to the multivariate model, the association with age differed between OA and HC (P¼0.001;Fig. 2). This interaction remained statistically significant (P¼0.010) when the analysis was restricted to individuals aged 48 or above (the minimum age in the OA group).
[image:3.595.130.457.461.721.2]Looking at individual lineages (Fig. 2), there was no association with age in HC for NK and NKT-cells, whilst their frequencies were higher in OA patients with increasing age. For CD4þT-cells and B-cells there was no association in HC, but frequencies were lower in OA patients. For CD8þT-cells the trends were in opposite directions,
Fig. 1.Lineage cell detection in OA synovial tissue. IHC for T-cells (CD3) B-cells (CD20) and macrophage (CD68) in three typical OA biopsies with diffuse, aggregates or germinal
with older HCs having lower frequencies (negative trend) whilst older OA patients had higher frequencies (positive trend).
CD4þT-cell phenotypes
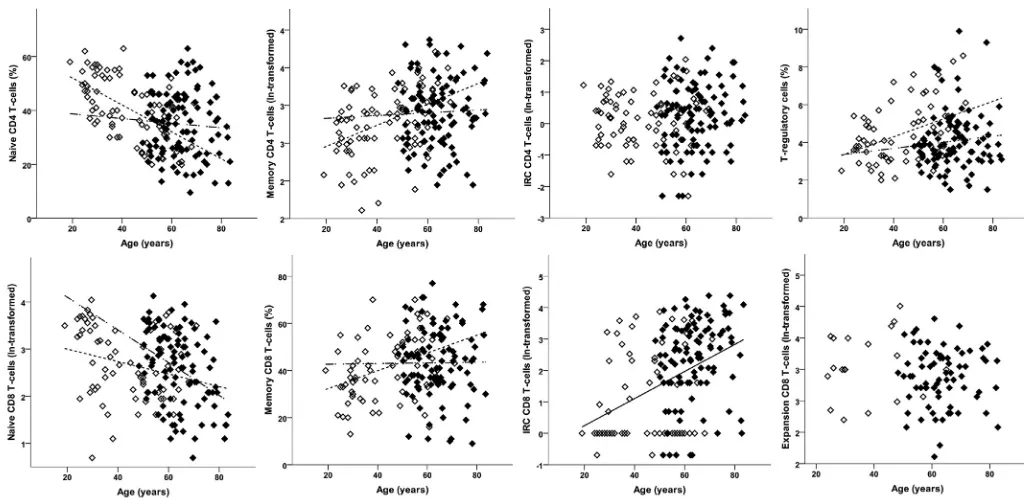
Using the same strategy, proportions of naive, memory and IRC CD4þ T-cells considered simultaneously and having adjusted for age revealed no apparent difference between groups (F(3,177)¼0.30, P¼0.824), and the association with age was significant whenfixed in both groups (F(3,177)¼7.56,P<0.001).
Looking at each phenotype individually, consistent with the overall result and current knowledge22frequencies did not differ between the HC and OA: naïve CD4þT-cell frequencies reduced with age, memory CD4þT-cell frequencies increased, whilst CD4þ IRC frequencies did not vary with age (Table II). There was a sig-nificant interaction with age in the multivariate analysis (F(3,176)¼3.18,P¼0.026).
Looking at each CD4þ T-cell phenotype individually, known positive (memory) and negative (naïve) age associations were observed in HC (Table IIandFig. 3), but neither of these subsets was associated with age in OA patients.
With respect to CD4þregulatory T-cells, having adjusted for age, the OA patients had comparatively fewer Treg than HC (Table II,
Fig. 3). When the age effect wasfixed in both groups, the frequency of Treg was higher in older individuals; however the association with age differed, being positive in HC but absent in OA patients (Fig. 3).
CD8þT-cell phenotypes
Memory like CD8þ T-cells were not present in all individuals (n¼90 combing HC and OA) and were therefore analysed sepa-rately. These cells were more likely to be found in OA patients (71.7%; 71/99) than in HC (26.0%; 19/73) having adjusted for age [OR¼14.91 (5.40, 41.18);P<0.001]. The odds of memory-like cells being present decreased with age [OR¼0.97 (0.94, 1.00);P¼0.037] but there was no evidence that this association differed between HC and OA (P¼0.233). In patients with memory-like cells present, the proportion of memory-like cells did not differ between HC and OA (Table II).
When frequencies of naive, memory and IRC CD8þT-cells were assessed in simultaneous analysis, evidence of age-adjusted be-tween-group differences (F(3,167)¼8.30,P<0.001) and an associ-ation with age (F(3,167)¼10.02,P<0.001) were observed.
Looking at individual phenotypes and having adjusted for age, OA patients tended to have more naïve and IRC CD8þT-cells relative Table II
Differences in immune cell relative frequencies between HC and OA patients obtained from multivariate analyses
Age-adjusted results assuming association with age is the same in HC and OA
Allowing age association to differ between HC and OA
HC OA Difference between groups Association with age HC OA
Interac-tion
Mean (95% CI) Pvalue Change per year (95% CI)
Pvalue Change per year (95% CI)
Change per year (95% CI)
Pvalue
Lymphocyte lineage Age mean, SD (range)
n¼93
44.8, 12.1 (19e69)
n¼108
64.2,8.9 (48e85)
NK, mean % 14.92 12.97 1.95 (4.70, 0.79) 0.162 0.12 (0.03, 0.22) 0.011 0.01 (0.11, 0.13) 0.31 (0.16, 0.46) 0.003 NKT, mean % 4.47 4.49 0.02 (1.88, 1.91) 0.987 0.09 (0.02, 0.15) 0.010 0.07 (0.02, 0.15) 0.12 (0.02, 0.23) 0.025 CD8, mean % 21.16 19.62 1.54 (4.78, 1.69) 0.3480.03 (0.14, 0.09) 0.6320.12 (0.26, 0.03) 0.11 (0.07, 0.29) 0.051 CD4, mean % 49.29 51.53 2.24 (1.76, 6.24) 0.2710.12 (0.26, 0.02) 0.087 0.06 (0.12, 0.23) 0.41 (0.63,0.19) 0.001 B-cells, mean % 10.16 11.40 1.23 (0.45, 2.92) 0.1490.06 (0.12, 0.00) 0.0380.02 (0.09, 0.06) 0.13 (0.23,0.04) 0.066 CD4 T-cells
Age mean, SD (range)
n¼81
43.1, 13.4 (19e69)
n¼101
63.8, 8.9 (48e83)
Naïve, mean % 36.44 38.19 1.75 (2.74, 6.25) 0.4430.35 (0.50,0.21) <0.0010.50 (0.68,0.32) 0.09 (0.33, 0.16) 0.008 Memory, mean % 17.98* 16.79* 0.93 (0.78, 1.11)y 0.444 0.97 (0.39, 1.55)z 0.001 1.40 (0.68, 2.12)z 0.24 (1.80, 1.34)z 0.048
IRC, mean % 1.19* 1.27* 1.07 (0.73, 1.57)y 0.723 0.41 (0.85, 1.70)z 0.520 N/A N/A 0.167
Regulatory T-cells Age mean, SD (range)
n¼104
41.8, 12.7 (19e69)
n¼114
63.9, 9.0 (48e83)
Treg, mean % 4.84 3.37 1.17 (1.72,0.63)<0.001 0.04 (0.02, 0.06) <0.001 0.05 (0.03, 0.08) 0.02 (0.01, 0.05) 0.073 CD8 T-cells
Age mean, SD (range)
n¼73
43.9, 13.8 (19e71)
n¼99
63.87 8.9 (48e83)
Naïve, mean % 11.52* 15.81* 1.37 (1.01, 1.86)y 0.0412.08 (3.06,1.09)z<0.0011.31 (2.54,0.07)z3.41 (5.00,1.80) 0.042 Memory, mean % 44.13 41.16 2.97 (8.59, 2.67) 0.300 0.25 (0.06, 0.43) 0.010 0.38 (0.15, 0.61) 0.01 (0.30, 0.32) 0.064
IRC, mean % 3.19* 9.10* 2.85 (1.68, 4.85)y <0.001 2.03 (0.25, 3.84)z 0.025 N/A N/A 0.518
n¼19 n¼71
Expansion if present, mean %
22.03* 17.55* 0.80 (0.55, 1.16)y 0.2280.09 (0.97, 1.17)z 0.862 N/A N/A 0.869
B-cells
Age mean, SD (range)
n¼44
40.4, 12.9 (31e65)
n¼106
62.1, 8.8 (48e83)
Naïve, mean % 69.36 67.87 1.49 (8.89, 5.91) 0.691 0.45 (0.23, 0.68) <0.001 0.69 (0.37, 1.00) 0.23 (0.08, 0.54) 0.044
Memory, mean % 22.22* 21.99* 0.99 (0.73, 1.34)y 0.9461.72 (2.62,0.81)z<0.001 N/A N/A 0.260
Breg, mean % 1.63* 1.93* 1.18 (0.79, 1.77)y 0.4120.38 (1.59, 0.84)z 0.535 N/A N/A 0.179
n¼21 n¼47
Pre-plasma if present, mean %
0.80* 0.40* 0.50 (0.25, 1.00)y 0.0500.94 (3.01, 1.18)z 0.378 N/A N/A 0.990
*Geometric mean.
y Ratio OA: HC.
to HC (Table II). The proportion of memory CD8þT-cells did not differ between groups. However, a significant interaction between age and group in the multivariate analysis (F(3,166)¼3.67,P¼0.014) which persisted in patients aged 48 and over (F(3,128) ¼ 3.59, P¼0.016) suggested that the extent of between-group differences was not consistent at all ages.
Naive CD8þT-cell frequencies reduced with age (Fig. 3) as ex-pected in HC22and in OA, but the negative trend with age was
steeper in OA patients (Table II). In HC there was a positive asso-ciation with age for memory CD8þT-cell (as previously reported22), which was absent in OA patients (Fig. 3). Trends with age did not differ significantly for IRC or memory CD8þT-cell.
[image:5.595.111.472.68.293.2]It is worth noting that the proportion of CD8þT-cell that were defined as IRC exceeded 1% in almost all of the OA patients (92.0%; 92/100) compared to only 38.7% (29/75) of the HCs. In the majority of HCs the proportion was at or around 1%, suggesting that this may
Fig. 3.CD4þand CD8þT-cell subset phenotypes in HC and OA. Percentage of CD4þT-cell (top) and CD8þT-cell (bottom) subsets in HC (open symbols) and OA (black symbols).
[image:5.595.34.546.353.602.2]Lines depict significant age relationship with subset. The non-broken line represents the relationship when similar in HC and OA, dotted line for relationship in HC only and dash-dot line for OA only.
Fig. 2.Lineage blood cell composition in HC and OA. Percentage of each cell subset lineage is represented as % total lymphocytes in HC (open symbols) and OA (black symbols). Lines
be the‘normal’level in health. Using logistic regression to model the odds of IRC CD8þT-cells being elevated above 1% in OA and controlling for age, odds were 14-fold higher (OR¼14.3; 95% CI 5.0 to 40.7; P < 0.001); there was no indication that the odds of elevated IRC were associated with age (P¼0.331) or that an age association differed by group (P¼0.848).
B-cell phenotypes
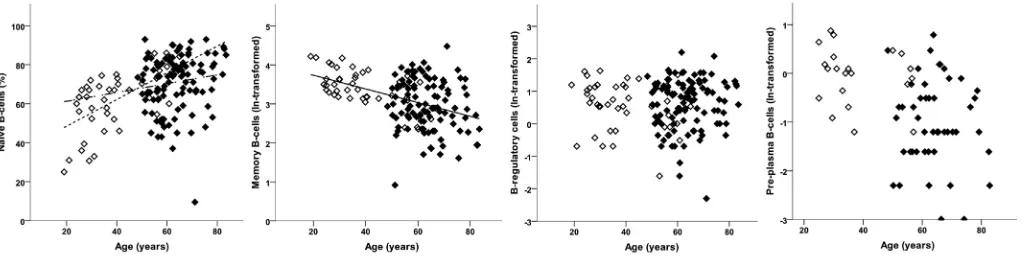
PPC were relatively rare and were investigated separately. The proportion of individuals with detectable PPC did not differ be-tween HC (47%; 21/44) and OA (44%; 47/106) and after adjusting for age (OR¼0.95 (0.33, 2.71);P¼0.924). In people with PPC, there was a borderline-significant difference between the groups, with OA patients having relatively fewer PPC than HC (Table II). There was no evidence to suggest that PPC frequency was associated with age (P¼0.378) or that this (lack of) association differed between the groups (P¼0.990).
Considering naive, memory and T2/Breg simultaneously, there was an association with age (F(3,145)¼6.50,P<0.001) but no evi-dence of differences between OA and HC (F(3,145)¼0.55,P¼0.646). Looking at individual phenotypes, naive B-cell frequencies tended to be higher in older individuals (Fig. 4) whilst memory B-cell frequencies tended to be lower. T2/Breg frequencies did not vary with age (Table II,Fig. 4). There was evidence of an interaction between age and group in the multivariate analysis (F(3,144)¼3.25, P¼0.024); however, only naïve B-cells showed a difference in the age association between the HC and OA. There was a relatively higher naïve-cell frequency with age (positive trend), but this as-sociation was weaker in OA to the extent that the confidence in-terval crossed 0.
Clinical correlate to immune cell blood composition
In a subgroup of patients (with reported duration), longer OA duration was associated with the loss of CD4þ T-cells (n ¼62, rho¼ 0.297,P¼0.025). In the 46 patients who reported a family history of OA, there was a more profound loss of total CD4þ/CD8þ T-cells (P¼0.077). A trend between CD4þIRC (but not CD8þ) fre-quency and disease duration was observed (n¼62,rho¼ þ0.248, P¼0.058).
For the majority of patients, we had data on the predominant joints diagnosed with OA (Table I). CD4þIRC were more frequent in patients with hip (P¼0.002, median 1.3% (range 0.1e8.0) for no hip vs 2.9% (0.5e7.9) with hip) and foot (P¼0.023, median 1.1% (range 0.1e8.0) vs 2.3% (0.8e5.6) OA). Higher CD4þIRC frequencies were also observed in patients with knee OA although with only 12 pa-tients with no knee OA, significance was low (P¼0.300, median 0.8% (range 0.1e2.8) vs 2.0% (0.1e12.7). These data suggest that OA
in large joints may be an important determinant of the presence of CD4þIRC in the blood. We observed no further association between demographic and clinical parameters or anatomic OA localisation for the B-cell subsets/phenotypes.
Discussion
Immunosenescence in the elderly encompasses many mecha-nisms resulting in compromised immune function and subsequent increased susceptibility to infection, cancer and autoimmune dis-eases. This novel, though preliminary, analysis of the immune cell composition of the blood of OA patients showed that several line-ages and sub-phenotypes of T and B-cells were affected in OA beyond what appears directly related to ageing and may therefore reflect additional immune dysfunction related to the OA process itself. We proceeded to an age adjusted analysis that confirmed lack of age association in health for NK, CD4þT-cells, B-cells and NKT cells but a trend for lower frequency for CD8þT-cells with ageing. In OA, CD4þT-cell and B-cell frequency were lower while CD8þT-cell frequency was higher compared with HC. With respect to cell phenotyping, the main differences observed were associated with the CD8þT-cells: memory-like cells were 15-fold more likely to be found in OA independent of age; reduction in naïve cell frequency with age was more accentuated in OA; while the relationship be-tween age and memory CD8þT-cells observed in health was lost in OA. The odds of increased IRC frequency were also much increased in OA compared to health. In CD4þT-cells, the reduction in naïve and increase in memory and Treg subsets with age previously re-ported in HC22were lost in OA. Finally B-cells showed evidence of a limited disturbance in the age relationship for naïve cells but no change for memory B-cells and T2/Breg, nor for the presence of PPC. As a general comment, because the extent of the differences between groups could vary with age, interpreting the estimated between-group differences in cell frequency should be done with caution, as it is difficult to determine whether this is a true obser-vation without longitudinal data, especially data including people who develop OA with time. Were these overall differences to be confirmed, this could be interpreted as a shift in overall blood composition in OA, but as the proportion of one subset/phenotype cannot change without affecting at least one other, it is difficult to identify which specific lineage/subset drives this difference be-tween the groups. Despite these limitations, to our knowledge, these data are thefirst report that the immune cell composition of the blood of OA patients is affected beyond what would be expected during ageing.
[image:6.595.49.561.66.194.2]In health, minor alterations in B lymphocytes were reported in ageing and the loss of cell-mediated responses was predominantly associated with alterations in the function of T-cells24. Accordingly,
Fig. 4.B-cell subset phenotypes in HC and OA. Percentage of each B-cell subsets in HC (open symbols) and OA (black symbols). Lines depict significant age relationship with subset.
lineage representations were not strongly associated with age in health (with the exception of CD8þT-cells), although clear changes were observed in particular T and B-cell sub-phenotypes. These data confirmed previous observations of thymic decline in gener-ating naïve CD4þT-cells and CD8þT-cells with age as well as the development of memory subset reflecting T-cell homeostasis over a lifetime22. The increase in frequency of regulatory T-cells has been hypothesized25but we only verified it by being able to recruit HC with a wide age range. B-cells continue to develop throughout life (releasing naïve cells into the blood stream) while memory cells developing into plasma cells tend to home to the bone marrow and therefore leave the blood. Accordingly our data showed increase and decrease of circulating naïve and memory B-cells respectively. Previous data showing no differences for CD4þor CD8þT-cells frequencies were reported comparing OA with age-matched HC over 1 decade of age (mean age 70 range 65e75)26. Our data would probably have been consistent with these previous results if restricted to that decade of age. The relative changes of T-cells in OA (decline in CD4þand absence of reduction of CD8þT-cells) were only visible in our study because we included a wide range of age in HC. The decline in CD4þT-cells may suggest greater loss in T-cell functionality in OA compare to health. How CD8þhomeostasis is controlled throughout ageing remains unclear. Clonal expansions of CD8þT-cells related to Epstein Barr and/or CMV were shown to accumulate in ageing27. The presence of such expanded highly differentiated CD8þ T-cells was shown to be detrimental to immunity28e30resulting in the increased morbidity and mortality of the elderly population. The presence in almost all OA patients of greatly expanded CD8þ T-cells with an IRC or the memory-like phenotype may reflect an even greater disturbance of CD8þ ho-meostasis in OA.
The relationship between NKT and age in HC was maintained in OA. In a few OA patients, however, very high frequencies were observed (Fig. 2). The role of the NKT population of cells expressing both T-cell and NK-cell markers is not well understood, but they functionally work both like NK and T-cells, notably by immediately producing cytokines when activated (interferon-gamma, tumour necrosis factor-alpha and IL-2)31,32. NKT-cells are therefore part of thefirst-line defense mechanism against pathogens including vi-ruses. One of their functions associated with ageing is to compen-sate for the deterioration of T-cells and although NKT production of IFN-gamma also decreased with ageing33it is better maintained (notably in centenarian) and is thought to be essential for healthy ageing. Inflammation in metabolic tissues has emerged as a uni-versal feature of obesity and its co-morbidities, including OA. A link between diet and NKT frequencies has also been established34and mice lacking NKT were more prone to obesity and inflammation35. In OA, patients with high NKT-cell frequencies may therefore sug-gest different capacities for immediate response to viral infection.
Phenotyping CD4þ T-cells revealed further differences. We observed a lower frequency of regulatory T-cells, and higher than expected naïve CD4þT-cells. This last observation was intriguing as it is quite similar to what is observed in RA where such mainte-nance of high naïve T-cells is predictive of good outcome36. IRC have been shown to develop as a result of pro-inflammatory cytokine stimulation22. In our study, IRC were more frequent in patients with large joint OA (hip, knee, foot). It could therefore be speculated that their presence reflects a greater volume of syno-vitis. Unfortunately we did not have whole body radiographs in order to fully characterise both the total-body burden and the joint-level severity of OA in individuals. The reduction of regulatory T-cells in the blood of OA is also intriguing and this has never been reported to our knowledge. Such loss of Treg (notably as Treg were shown to accumulate with ageing) may have important conse-quences. Autoantibodies are both a feature of ageing and OA and,
although a direct role for B-cell auto-reactivity remains a matter of debate in OA, there is much evidence of accumulated auto-reactivity, notably towards cartilage epitopes (with autoantibody to collagens, proteoglycans)37. Loss of regulatory mechanisms may be contributing to the loss of tolerance resulting in such autoanti-bodies being generated38. The loss of relationship between total and naïve B-cell subset and age in OA is not sufficient to suggest causality although it may suggest that additional disease effect may be mediated by B-cells, especially considering the highly differen-tiated state of synovial B-cells39.
The histology and immunohistochemistry analysis of OA syno-vial biopsies was primarily used to confirm previously reported data related to the OA synovial membrane cellular composition. T and B-cell infiltration was observed and even if aggregates were not as frequently observed as in RA, their presence in the synovial tissue suggests immune-related events in OA. Synovitis score were above normal in all but 13 patients and reached quite high levels. Taken together with the changes seen in blood cell composition, our data suggest that immune dysregulation may contribute to OA in a way that remains to be fully elucidated.
In conclusion, our data suggest that alterations in the blood immune cell composition can be observed in OA, and such changes appear different to those associated with ageing alone. Some of the changes may reflect inflammation and autoreactivity. The loss of regulatory mechanisms in OA should therefore be further investi-gated in relation to auto-antibodies and auto-reactivity develop-ment. Future research into immune-modulation for the treatment of OA may be of benefit.
Authors contribution
FP Conception and design, analysis and interpretation of the data; FP, AB Collection and assembly of data; EH statistical analysis, RR, MC Provision of study materials or patients; FP, AB, EH, PC Drafting of the article; FP, PE, PC Critical revision of the article for important intellectual content; AB Administrative, technical, or logistic support. All authors approved final version of this manuscript.
Funding source
This work was supported by the IMI-funded project BeTheCure (No 115142-2), grant and Arthritis Research UK grants: 19545 (HERO) and 20083 (Experimental Osteoarthritis Treatment Centre). RR is funded by the Rose Hellaby Scholarship (Guardian Trust) New Zealand, The Royal Australasian College of Physicians (RACP)/ Australian Rheumatology Association & Starr Fellowship (Australia), New Zealand Rheumatology Association and Health Workforce New Zealand (contract number 242815/347837/00). MC was holder of University of Ottawa International Traveling Fellowship (#31300). FP, PE and PC are part-funded by the National Institute for Health Research (NIHR) through the Leeds Musculo-skeletal Biomedical Research Unit.
Conflict of interest
Authors declare that there is no conflict of interest associated with this publication.
This article presents independent research funded by the NIHR. The views expressed are those of the authors and not necessarily those of the NHS, the NIHR or the Department of Health.
Acknowledgement
Supplementary data
Supplementary data related to this article can be found athttp:// dx.doi.org/10.1016/j.joca.2015.06.018.
References
1.Baylis D, Bartlett DB, Patel HP, Roberts HC. Understanding how we age: insights into inflammaging. Longev Healthspan 2013;2: 1e8.
2.Franceschi C, Bonafe M, Valensin S, Olivieri F, de Luca M, Ottaviani E,et al. Inflamm-aging: an evolutionary perspective on immunosenescence. Ann N Y Acad Sci 2000;908:244e54. 3.Caruso C, Buffa S, Candore G, Colonna-Romano G,
Dunn-Walters D, Kipling D,et al. Mechanisms of immunosenescence. Immun Ageing 2009;6:10.
4.Pawelec G. Hallmarks of human“immunosenescence”: adap-tation or dysregulation. Immun Ageing 2012;9:15.
5.Franceschi C, Bonafe M, Valensin S. Human immunosenescence: the prevailing of innate immunity, the failing of clonotypic im-munity, and thefilling of immunological space. Vaccine 2000;18: 1717e20.
6.Gruver A, Hudson L, Sempowski G. Immunosenescence of ageing. J Pathol 2007;211:144e56.
7.Manoussakis M, Tzioufas A, Silis M, Pange P, Goudevenos J, Moutsopoulos H. High prevalence of anti-cardiolipin and other autoantibodies in a healthy elderly population. Clin Exp Immunol 1987;69:557e65.
8.Tomer Y, Shoenfeld Y. Ageing and autoantibodies. Autoim-munity 1988;1:141e9.
9.Hügle T, Geurts J, Nüesch C, Müller-Gerbl M, Valderrabano V. Aging and osteoarthritis: an inevitable encounter? J Aging Res 2012;2012:7.
10. Peat G, McCarney R, Croft P. Knee pain and osteoarthritis in older adults: a review of community burden and current use of primary health care. Ann Rheum Dis 2001;60:91e7.
11. Nakamura H, Yoshino S, Kato T, Tsuruha J, Nishioka K. T-cell mediated inflammatory pathway in osteoarthritis. Osteoar-thritis Cartilage 1999;7:401e2.
12. Lourido L, Fernandez-Tajes J, Calamia V, Fernandez C, Rocha B, Fernandez-Puente P,et al. Identification of autoantibodies in serum from osteoarthritis patients using microarrays. Osteo-arthritis Cartilage 2014;22. S425eS425.
13. Zhai G, Aviv A, Hunter DJ, Hart DJ, Gardner JP, Kimura M,et al. Reduction of leucocyte telomere length in radiographic hand osteoarthritis: a population-based study. Ann Rheum Dis 2006;65:1444e8.
14. Goldring MB, Otero M. Inflammation in osteoarthritis. Curr Opin Rheumatol 2011;23:471e8.
15. Loeser RF. Molecular mechanisms of cartilage destruction: mechanics, inflammatory mediators, and aging collide. Arthritis Rheum 2006;54:1357e60.
16. Chen N, Guan J-L. The influence of mechanical stress and verapamil on monocyte chemotactic protein-1 (MCP-1) release in osteoarthritic (OA) chondrocytes agarose constructs. Fudan Univ J Med Sci 2014;41:304e8.
17. Matsui H, Fukuno N, Sasaki K, Suzuki O, Kobayashi T, Tamura S. Loading of mechanical stress to osteoblasts may induce cytokine cross talks between osteoblasts and monocytes/macrophages in a JNK/p38-dependent manner. Micro-nanomechatronics and human science. In: MHS 2008. International Symposium2008 2008:379e80.
18. Echtermeyer F, Bertrand J, Dreier R, Meinecke I, Neugebauer K, Fuerst M,et al. Syndecan-4 regulates ADAMTS-5 activation and
cartilage breakdown in osteoarthritis. Nat Med 2009;15: 1072e6.
19. Garnero P, Piperno M, Gineyts E, Christgau S, Delmas P, Vignon E. Cross sectional evaluation of biochemical markers of bone, cartilage, and synovial tissue metabolism in patients with knee osteoarthritis: relations with disease activity and joint damage. Ann Rheum Dis 2001;60: 619e26.
20. Pazar B, Ea H-K, Narayan S, Kolly L, Bagnoud N, Chobaz V,et al. Basic calcium phosphate crystals induce monocyte/macro-phage IL-1
b
secretion through the NLRP3 inflammasome in vitro. J Immunol 2011;186:2495e502.21. Reece R, Canete J, Parsons W, Emery P, Veale D. Distinct vascular patterns of early synovitis in psoriatic, reactive, and rheumatoid arthritis. Arthritis Rheum 1999;42:1481e4. 22. Ponchel F, Morgan AW, Bingham SJ, Quinn M, Buch M,
Verburg RJ, et al. Dysregulated lymphocyte proliferation and differentiation in patients with rheumatoid arthritis. Blood 2002;100:4550e6.
23. Krenn V, Morawietz L, Burmester GR, Kinne R, Mueller-Ladner U, Muller B, et al. Synovitis score: discrimination be-tween chronic low-grade and high-grade synovitis. Histopa-thology 2006;49:358e64.
24. Linton P, Thoman ML. T cell senescence. Front Biosci 2001;6: 248e61.
25. Gregg R, Smith CM, Clark FJ, Dunnion D, Khan N, Chakraverty R,et al. The number of human peripheral blood CD4þCD25high regulatory T cells increases with age. Clin Exp Immunol 2005;140:540e6.
26. Pawłowska J, Mikosik A, Soroczynska-Cybula M, Jozwik A, Łuczkiewicz P, Mazurkiewicz S,et al. Different distribution of CD4 and CD8 T cells in synovial membrane and peripheral blood of rheumatoid arthritis and osteoarthritis patients. Folia Histochem Cytobiol 2009;47:627e32.
27. Posnett DN, Sinha R, Kabak S, Russo C. Clonal populations of T cells in normal elderly humans: the T cell equivalent to“benign monoclonal gammapathy”. J Exp Med 1994;179:609e18. 28. Messaoudi I, LeMaoult J, Guevara-Patino JA, Metzner BM,
Nikolich-Zugich J. Age-related CD8 T cell clonal expansions constrict CD8 T cell repertoire and have the potential to impair immune defense. J Exp Med 2004;200:1347e58.
29. Khan N, Hislop A, Gudgeon N, Cobbold M, Khanna R, Nayak L, et al. Herpesvirus-specific CD8 T cell immunity in old age: cytomegalovirus impairs the response to a coresident EBV infection. J Immunol 2004;173:7481e9.
30. Effros RB, Cai Z, Linton P-J. CD8 T cells and aging. Crit Rev Immunol 2003;23:45e64.
31. Kelly-Rogers J, Madrigal-Estebas L, O'Connor T, Doherty DG. Activation-induced expression of CD56 by T cells is associated with a reprogramming of cytolytic activity and cytokine secretion profile“in vitro”. Hum Immunol 2006;67:863e73. 32. Lu P-H, Negrin RS. A novel population of expanded human
CD3þCD56þcells derived from T cells with potent in vivo antitumor activity in mice with severe combined immunode-ficiency. J Immunol 1994;153:1687e96.
33. Mocchegiani E, Malavolta M. NK and NKT cell functions in immunosenescence. Aging Cell 2004;3:177e84.
34. Gao B, Radaeva S, Park O. Liver natural killer and natural killer T cells: immunobiology and emerging roles in liver diseases. J Leukoc Biol 2009;86:513e28.
36. Ponchel F, Go€eb V, Parmar R, El-Sherbiny Y, Boissinot M, El Jawhari J,et al. An immunological biomarker to predict MTX response in early RA. Ann Rheum Dis 2014;73:2047e53. 37. Guerassimov A, Zhang Y, Cartman A, Rosenberg LC, Esdaile J,
Fitzcharles MA,et al. Immune responses to cartilage link pro-tein and the G1 domain of proteoglycan aggrecan in patients with osteoarthritis. Arthritis Rheum 1999;42:527e33. 38. Da R-R, Qin Y, Baeten D, Zhang Y. B cell clonal expansion and
somatic hypermutation of Ig variable heavy chain genes in the
synovial membrane of patients with osteoarthritis. J Immunol 2007;178:557e65.