A survey on architectures and energy efficiency in Data Center Networks
58
0
0
Full text
(2) This is a. A. ! Article: ∀ # ∃ 1 2. % ## 1 #. ∃ &∋() ∗ + , 1 ##. −. + . 3,,2 ) 4!54(!6. /− .. −. 7. 0.
(3) A Survey on Architectures and Energy Efficiency in Data Center Networks Ali Hammadi and Lotfi Mhamdi School of Electronic and Electrical Engineering, University of Leeds, UK. Abstract Data Center Networks (DCNs) are attracting growing interest from both academia and industry to keep pace with the exponential growth in cloud computing and enterprise networks. Modern DCNs are facing two main challenges of scalability and cost-effectiveness. The architecture of a DCN directly impacts on its scalability, while its cost is largely driven by its power consumption. In this paper, we conduct a detailed survey of the most recent advances and research activities in DCNs, with a special focus on the architectural evolution of DCNs and their energy efficiency. The paper provides a qualitative categorization of existing DCN architectures into switch-centric and server-centric topologies as well as their design technologies. Energy efficiency in data centers is discussed in details with survey of existing techniques in energy savings, green data centers and renewable energy approaches. Finally, we outline potential future research directions in DCNs. Keywords: Data center networks (DCNs), Architecture, energy efficiency, virtualization, renewable energy for DCNs,. 1. Introduction Recent years are witnessing an unprecedented growth in data centers. This is mainly driven by the plethora of services and applications housed by modern data centers, such as web-search, scientific computations, social networks, distributed files systems, etc. Data centers are at the heart of almost every sector at the private, public and governmental levels. Today’s data centers contain hundreds of thousands of servers, interconnected via switches, routers and high-speed links. The design of modern data centers Email address: {elaah, L.Mhamdi}@leeds.ac.uk (Ali Hammadi and Lotfi Mhamdi). Preprint submitted to Elsevier. November 26, 2013.
(4) mandates joint expertise from diverse engineering fields and entails a number of considerations ranging from real estate, geographic location, to the data center hardware and software requirements as well as its power budget. The ultimate objective in designing a data center is to maximize efficiency while maintaining a low cost. In order to keep pace with the high-demand in services and applications, DCNs are continuing to evolve and considerable research efforts are being made to address the various challenges observed. The choice of a DCN solution to address one challenge impacts and often limits the alternatives of how to address other issues. Furthermore, DCNs are deployed for various sectors and the solutions (and geometries) differ such as the difference between enterprise DCNs and cloud-service DCNs [1]. Irrespective of the DCNs type, various common challenges for the design of DCNs have been observed at various levels, including: i) the architecture of the DCN and its topology, ii) the energy efficiency issue and how to keep the DCN power budget manageable including virtualization, network load management and scheduling, etc. iii) congestion handling in DCNs including congestion notification and avoidance. A typical challenge is the problem of TCP incast, iv) routing in DCNs with the provision of efficient and cost-effective routing mechanisms such as multipath routing concepts. The focus of this article is to survey the first two issues of architectural evolution and energy efficiency in DCNs. Readers are referred to [2] and references therein for issues such as routing, congestion control, etc. The choice of the architecture of a DCN is of premium importance as it impacts on the overall efficiency of the DCN. The architecture of a DCN, or its topology, directly reflects on its scalability, cost, fault-tolerance, agility and power consumption [3]. Conventional DCNs have been designed using a tree-like topology. A typical example of this topology is the three-tier topology proposed by [3] where the tree’s leaves (end-nodes or servers) are connected to Top-of-Rack (ToR) switches and these (ToR) switches are connected to aggregation switches which are in turn connected to core routers at the root of the tree. This topology has soon been shown to suffer numerous drawbacks of scale, capacity, reliability, utilization and power budget [2]. As a result, efforts have been dedicated to address some (or all) of the above encountered problems in the tree-based DCN topology and various DCN architectures have appeared [4][5][6][7][8][9][10][11][12][13][14][15]. These architectures can be classified as server-centric and switch-centric and/or based on their infrastructure technologies such as electronic versus optical DCNs. Energy efficiency is a central issue in modern data centers. DCNs are typically high-capacity networks that are tuned for maximum performance 2.
(5) (peak network load or busy-hour), making them extremely power hungry. A typical DCN facility has more than 100 times power density than a typical office building of the same space. In 2007, a report to the U.S. congress by the EPA estimated that DCNs power usage has doubled between 2000 and 2006 [16]. This trend is likely to persist between 2006 and 2011, rendering the DCN’s energy budget a major cost. In response to this, numerous proposals for energy-efficiency at various levels of the DCN have been studied and proposed. In addition to advances in energy-efficient server designs [17], other studies have addressed ways to dynamically monitor the DC network traffic load in order to balance it and optimize the DCN power consumption. Virtualization is perhaps the most promising approach, whereby DCN resources are logically partitioned (or “sliced”) and provided to users as virtual machines (VMs). Simply put, virtualization is a means through which the same amount of processing can be run on fewer servers by increasing server utilization, therefore allowing more efficient use of DCN resources. While previous work has surveyed research efforts in DCNs, such the the comprehensive work by [2], our work focuses on the two interrelated issues of DCN architecture and its energy efficiency. Our work differs from [2] in both the architecture of DCNs and their energy efficiency as follows. First, the current work surveys more DCN architectures such as the onetier DCN architecture, the hybrid electro-optical, the full optical and the passive optical-based DCN architectures. Second, the current work covers more energy efficiency related research efforts in DCNs. We also provide a comparative study (Section 6) on energy efficiency in DCNs. We further provide a survey and a comparative study of the most adopted testbeds and simulation tools for DCNs. The remainder of this article is structured as follows. Section 2 revisits conventional data center architecture and design. We describe the multi-tier DCN topology and discuss the main challenges facing conventional DCNs. In Section 3, we survey most recent advances in DCNs and we classify these architectures into switch-centric and server-centric topologies. We also categorize these proposals based on their underlying technologies into electronic DCNs, full optical DCNs and hybrid electro-optical DCNs. Section 4 provides a qualitative comparison and discussion of the DCN architectures. In Section 5, we conduct a detailed study of energy efficiency in DCNs including the various recently proposed techniques such as virtualization, energy-aware routing, dynamic voltage/frequency scaling, dynamic power management, renewable energy, cooling, etc. In Section 6, provides a comparative study of existing efforts in DCN energy efficiency and optimisation. Section 7, surveys some of the most adopted testbeds and simulation tools for DCNs. In 3.
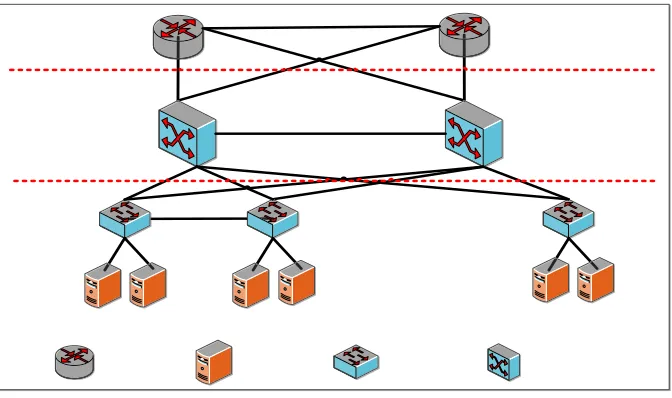
(6) Section 8, we provide some insights and outline potential futures research directions in DCNs. Finally, Section 9 concludes the article. 2. Conventional Data Center Architecture and Challenges 2.1. Conventional Data Center Design The classic data center design architecture [3] [18] consists of switches and routers in two or three tier hierarchal structure as shown in Figure 1. The hierarchy in the case of three tiers consists of layer-3 with border routers, layer-2 with aggregation switches, and layer-1 with Top of Rack (ToR) access switches. A ToR switch usually connects 20-40 servers placed in a rack with 1Gbps link, and for redundancy each ToR is connected with two aggregation switches which in turn connect with the core layers through multiple high speed 10 Gbps links. The aggregation layer provides and manages many functions and services such as spanning tree processing, default gateway redundancy, server to server traffic flow, load balancing, firewall and more. Core routers/switches, running 10Gbps high-speed links, are at the top of the hierarchy. These are used for traffic going in and out of the data center. The Core routers/switches also run well-known routing algorithms such as Open Shortest Path First (OSPF) or Enhanced Interior Gateway Routing Protocol (EIGRP) and can load balance traffic using Cisco Express Forwarding based hashing algorithms between core and aggregation layers [3]. Unfortunately, the hierarchal three tiers DCN structure suffers various issues as will be discussed next. 2.2. Conventional Data Center Challenges Several challenges [2] and issues appeared with conventional data centers which have led many researches to explore and intensively study alternative designs and approaches to provide scalable, fault tolerant and efficient data centers. One of the most important performance handicaps that could lead to congestions is oversubscription. Oversubscription is the ratio between the servers’ bandwidth to the total uplink bandwidth at the access layer. Hence, as moving up to aggregation and core layer, the number of servers sharing the uplinks increases and hence the oversubscription ratio also increases and results in bottlenecks. Oversubscription limits the server to server capacity where the ratio should be 1:1 so hosts can communicate with their full network interface bandwidth. On the other hand, congestion resulting from oversubscription could also lead to overloading switch buffers which will in turn start dropping packets. Hence, another issue arises because of the lack of a mechanism to avoid packet drops at congested switches. Moreover, 4.
(7) Core. Aggregation. Access. Router. Access Switch. Server. Aggregation Switch. Figure 1: Conventional Data Center.. congestion can also occur at a switches where simultaneous transmission of packets from multiple senders arrive at the same time, switch gets overloaded and starts to drop packets leading to TCP timeout and hence a collapse in TCP throughput, known as TCP incast. Many approaches to mitigate the issues of incast and congestion are covered in details in [19][20][21][22][23]. Other challenges introduced with classical data center network such as the lack of fault tolerance especially at the upper levels of the tree due to the low physical connectivity. Hardware failures in the core or aggregation layers will result in sharp degrade of overall network performance. Additionally, poor utilization of resources occurred because of the fact that within layer2 domain, Spanning Tree Protocol (STP) only uses one path even though multiple paths exist; in addition to that another issue with load balancing arises since traffic cannot be evenly distributed over paths within core and aggregation layers. The fast growth of DCNs has triggered the issue of power consumption due to the high number of power hungry devices and cooling systems. Most of these devices are underutilized, as statistics has shown that a typical utilization of a data center is only 30% [24]. Hence, dynamic reassignment of resources among servers running on the data center is an optimal solution to consolidate most jobs on 30% of the servers while being able to shut down the other unused servers and hence save power. The ability to assign any 5.
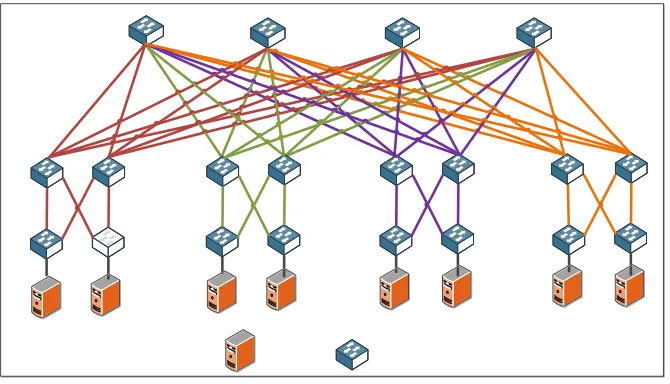
(8) server to any service without considering topology is called Agility. This is another challenge in conventional data centers and will be covered in details in subsequent sections. 3. Data Center Architectural Evolution Numerous problems in conventional data centers have driven researchers to propose and design various data center architectures to solve these issues. Data centers can be categorized mainly in two classes, the switch-centric and the server-centric. In switch-centric, switches are the dominant components for interconnection and routing whereas in server-centric, servers with multiple Network Interface Cards (NIC) exist and take part in routing and packet forwarding decisions. The conventional data center is a switch-centric design. Other examples of switch-centric include VL2 [6], Portland [5], Fat-tree [4], and Monsoon [10]. Server-centric topology also attracted great interest by researcher and many designs were proposed such as Dcell, Bcube, and FiConn. These topologies and designs are based on packet-switched electronic networks, however; hybrid electro-optical packet switch along with full optical solutions were also proposed and implemented for low power consumption and high bandwidth. 3.1. Switch Centric Data Center Architectures In this section, the most well-known switch centric data center designs such as fat-tree [4], portland [5], VL2 [6], and one-tier Qfabric [25] shall be covered. Such designs rely on switches for interconnection and traffic routing. The different design choices in the switch centric class came to resolve many issues that existed with the conventional data center. These issues, as shall be explained in subsequent sections, are oversubscription, agility, load balancing and high power consumption. 3.1.1. Fat-Tree The fat-tree topology [4], depicted in Figure 2, consists of k pods, each of which consisting of k2 edge switches and k2 aggregation switches. Edge and aggregation switches connected as a clos topology [26] and form a complete bipartite in each pod. Also each pod is connected to all core switches forming another bipartite graph. Fat-Tree built with k-port identical switches in all layers of the topology and each of which supports k3 4 hosts. Fat-Tree IP addresses are in the form 10:pod:subnet:hosted. With Fat-Tree topology issues with oversubscription, costly aggregation and core switches, fault tolerance, and scalability are resolved. Fat-Tree established a solid topology for 6.
(9) Server. Switch. Figure 2: The Fat-Tree Topology with k = 4.. researchers to work on to solve other important issues such as agility through virtualization. In Fat-Tree, the issue of address lookup time was studied and a two table lookup approach was proposed to replace the longest prefix match which is found impractical with data centers having hundreds of thousands entries for routing tables. Two level routing table and address lookup were implemented using specialized hardware; Ternary Content Addressable Memory (TCAM) which can store addresses and also perform parallel searches among its entries. Basically, address lookups are done in two steps; first the lookup engine does a lookup on the TCAM to find the longest matching prefix. Then the matched address is used to index the SRAM which holds the information of the IP address and output port to reach the intended destination. It is also worth mentioning that routing tables are meant to be static to avoid delays that may occur from routing table updates but on the other side CAMs are seen as power hungry components and have low storage density and also may introduce considerable cost. 3.1.2. VL2 VL2 was proposed in [6] and considered as a solution to overcome some of the critical issues in conventional data centers such as oversubscription, agility and fault tolerance. VL2, shown in Figure 3, exploits a uniform 7.
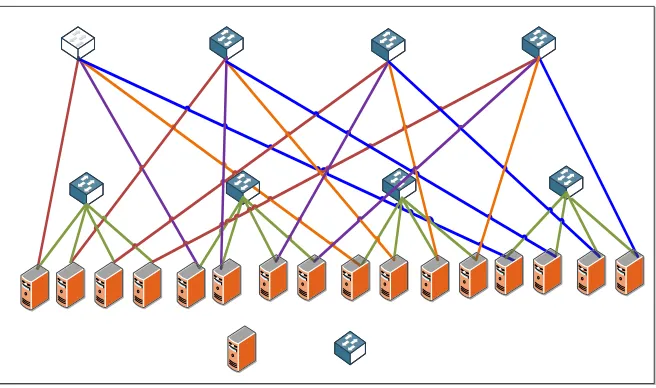
(10) Server. Switch. Figure 3: The VL2 DCN architecture.. high capacity from server to server, supports VM migration from server to server without breaking the TCP connection and keeping the same address. It is very similar to the three-tier architecture DCN proposed by Cisco, except that it implements a clos topology (low cost ASICs) between core and aggregation layers to provide multipath and rich connectivity between the two top tiers. The architecture design of the VL2 topology enhances the availability and reliability of the network, especially in the presence of link or hardware failures. VL2 employs Valiant Load Balancing (VLB) to evenly load balance traffic flows over the paths using Equal Cost Multi Path (ECMP). VL2 also employs TCP for end to end congestion control. As additional advantage is that VL2 can be easily implemented on low cost existing commodity switches since it uses already existing ECMP for packet forwarding and link state routing for topology updates. VL2 will be revisited later in this article with further details on agility and virtualization capability to improve energy saving contribution for green data centers. 3.1.3. Portland The Portland DCN topology, proposed in [5], is similar to VL2 in that both are based on a Fat-tree [4] network topology. Portland, depicted in Figure 4, consists of three layers: edge, aggregation and core. It is built out of low cost commodity switches. They both differ in the way of associating and 8.
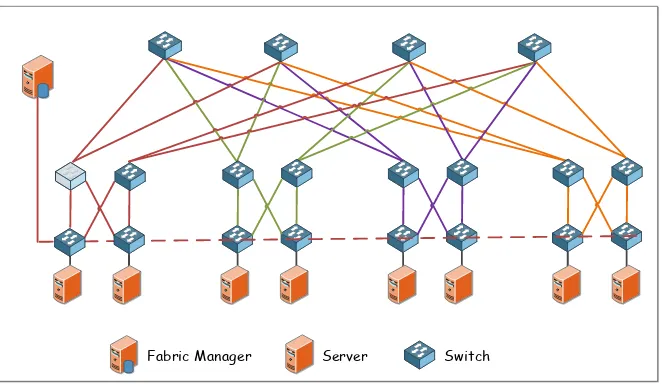
(11) Fabric Manager. Server. Switch. Figure 4: The Portland DCN Topology.. separating names from locators but both at the end aim at providing agility among services running on multiple machines. Both reduce broadcast by intercepting Address Resolution Protocol (ARP) requests and employ a unicast query through a centralized lookup service. Portland imposes additional requirements on the switch software and hardware unlike VL2 where implementation only takes place in the servers’ network stack. A deeper look into the methodology imposed by Portland for agility and virtualization support shall be covered in details in section 6.1. For load balancing, Portland and VL2 employ flow hashing in ECMP; except that VL2 employs VLB which before forwarding a packet, it randomly selects an intermediate switch. This was found to be impractical in the case where two hosts, connected to the same edge switch, want to communicate. 3.1.4. One-Tier Fabric Architecture Flattening three-tier tree structure to one tier fabric is an existing solution proposed for modern data center architecture as introduced by Juniper [25]. Juniper Qfabric architecture as shown in Figure 5 has flattened the data center network and simplified the management of the data center by reducing the number of switches. Furthermore, since there is no tree structure, there is no need for multiple hops traversing between any communicating nodes within the network. The location of hosts is not any more an issue 9.
(12) Figure 5: The Qfabric architecture [27].. since the network diameter and the shortest path between any two communicating nodes is always equal to one and no more oversubscription or congestion issues are arising and all nodes can benefit from their all line card bandwidth. The Qfabric single logical switch has an added value to the DCN since it reduces the complexity, operational cost, cooling cost, occupied floor space and power consumption. The Qfabric supports high speed server to server connectivity with low latency which makes it an attractive structure for modern data centers hosting delay sensitive applications. It also smoothen the process of virtualization among servers within the data center leading to great energy savings. Qfabric could reduce power saving to less than 77% if the reduced number of switches, links, cooling systems are considered along with applying other energy saving techniques such as virtualization among data center resources [27]. Consequently, Qfabric is considered to be a green data center architecture that can contribute to reducing carbon footprint in the environment. 3.2. Server-Centric Data Centers Unlike switch centric designs, server centric designs appeared to use servers to act as relay nodes to each others and participate in the traffic forwarding. Server centric schemes such as Bcube [8], Dcell [7], and Ficonn [9] can provide low diameter compared to switch centric schemes, can provide high capacity and support all types of traffic, especially for the intensive computing applications with very low delays. In this section, an overview of Bcube, Dcell, and Ficonn server centric schemes shall be described along 10.
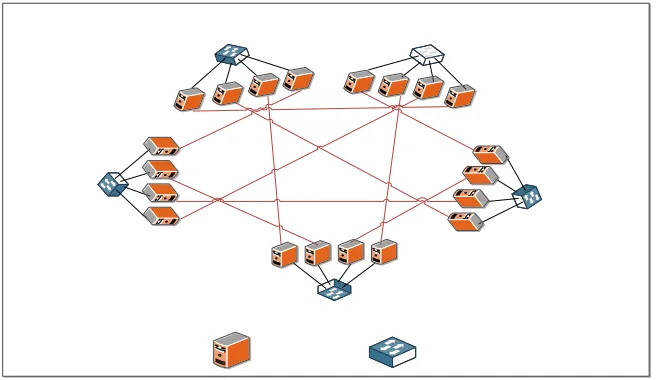
(13) with their properties. 3.2.1. BCube BCube [8] is an example of server-centric DCN structure which consists of servers equipped with multiple network ports connecting multiple low cost mini switches. In BCube, servers are not only hosts but they also act as relay nodes for each other and take part in traffic forwarding through multiple parallel short paths between any pair of servers. The design is driven by demands for intensive computing and higher bandwidth requirements to support applications for different traffic patterns such as one to one, one to many, one to all and all to all. BCube supports and accelerates all types of traffic patterns and provides high network capacity due to its low diameter. The benefits of BCube design is that it can provide fault tolerance and load balancing and while requiring lower cooling and manufacturing cost. BCube, as shown in Figure 6, can be constructed in a recursive manner starting at BCube0 as its basic building block, which is built around n-servers connected to n-port switch. Then, BCube1 is built out of n-BCube0 each of which has n-servers. A general BCubek is constructed recursively, as before, based on BCube(k − 1). For detailed construction of a general BCubek topology, readers are referred to [8]. BCube employs source routing protocol (BSR) when existing routing protocol such as Intermediate System To Intermediate System (IS-IS) and OSPF cannot scale to thousands of servers. BSR can utilize high multipath capacity and also load balance the traffic automatically. With BSR, the source server controls the selection of the path without coordination with intermediate servers which is only responsible for forwarding received packets based on information obtained from the header. BSR probes the network to select the best path which eliminates the need of frequent link state broadcasting which is not scalable since the network consists of 1000s of servers. 3.2.2. DCell DCell [7] is another server-centric structure for data center that can provide desirable properties to overcome issues with scalability, fault tolerance and network capacity. As illustrated in Figure 7, DCell is a structure with rich physical connectivity among servers and switches and replaces expensive core and aggregation switches with mini low cost switches. However, additional cost introduced because of additional and lengthy wiring communication links between switches and servers. Similar to BCube [8], large DCells are recursively constructed from smaller DCells, with DCell0 as the initial building block. A DClell0 is constructed 11.
(14) Server. Switch. Figure 6: The BCube Topology.. by connecting n servers to one low cost mini-switch with small port count. A DCell1 consists of (n + 1) DCell0, where every DCell0 is connected to every other DCell0 in full mesh fashion as depicted in Figure 7. Servers in a generalized DCell topology have two interfaces each, one connects to its mini-switch and the other interface is connected to another server in a neighboring DCell0. Any two servers with 2-tuples [i, j − 1] and [j, i] are connected with a link to every i and every j > i [7]. As an example, in Figure 7, server with tuple [4, 1] shall be connected to [1, 3]. DCell is a scalable network structure which can be expanded gradually without a need for re-wiring or changing addresses. DCell networks with k equal to 3 can be scaled up to accommodate millions of servers. DCell employs a distributed fault tolerant routing algorithm designed to well exploit the DCell structure/topology, with fault tolerance capability in the presence of various types of failures such as links, servers and/or racks [7].. 12.
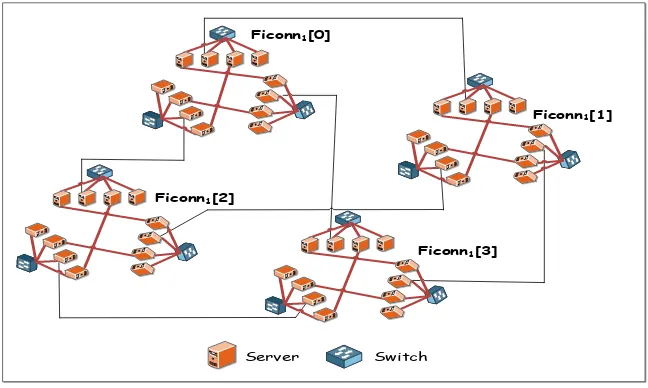
(15) Dc. [4 ] e ll 0. D c el. l0 [0]. [4,3]. [0,3]. [4,0]. Dcell0[1]. Dcell0[3]. [1,0] [3,2]. [3,0]. [1,3] [2,3]. [2,0]. Dcell0[2] Server. Switch. Figure 7: The DCell DCN Topology.. 3.2.3. Ficonn Ficonn [9] employs an interconnection structure using commodity servers and switches to establish a scalable data center network. It differs from BCube and DCell by making use of the two built-in Ethernet ports in the servers to establish connections and load balance traffic on two outgoing links through a Traffic Aware Routing algorithm (TAR). The throughput and routing path length can be severely affected by changing network condition. The TAR in Ficonn has the capability to monitor link capacities and, based on information obtained on the status of network condition, it adapts accordingly. The construction of the Ficonn interconnection can be demonstrated and explained as shown in Figure 8 where the Ficonn physical topology consists of FiConn2 with n = 4. FiConn2 is composed of 4 FiConn1, and each FiConn1 is composed of 3 FiConn0. There are three different level-links to constitute the interconnection within the topology, level 0 link connects each server with its switch within the same Ficonn0, level 1 or level 2 links connect the second port of the server to either another server within the same Ficonn1 or a server in another Ficonn1 within Ficonn2. Ficonn is found to be scalable since its number of servers can be scaled up and increased exponentially with the increase of levels. The number of servers (N) can be calculated from; N = 2(k+1) ∗ ( n4 )2k , For n > 4 where n is 13.
(16) the number of servers in FiConn0. Also Ficonn has a relative small diameter with an upper bound of 2(k+1) − 1, which makes the structure suitable for real time applications. Most attractively, the Ficonn’s cost is much less than other topologies since it employs less number of switches and most relies on servers and efficient routing algorithms for switching and packet forwarding.. Ficonn1[0]. Ficonn1[1]. Ficonn1[2]. Ficonn1[3]. Server. Switch. Figure 8: The Ficonn Topology.. 3.3. Optical Data Centers In 2009 vision and roadmap report estimated a 75% of energy saving can be obtained if data center infrastructure moves toward full optical network [28]. Optical interconnect schemes in data centers mainly relies on a mixture of active and passive optical devices to provide switching, routing, and interconnection. Such devices are Tunable Wavelength Converters (TWC), Optical Amplifier, Arrayed-Waveguide Grating (AWG), MicroElectro-Mechanical Systems Switches (MEMS), Wavelength Selective Switch (WSS), Couplers, Splitters and Combiners. Optical interconnect schemes are mainly classified into two categories, the hybrid scheme where optical along with the electrical switches are considered in the design to constitute the fabric interconnection, and the full optical network where only optical devices are employed. An insight of each scheme shall be presented in this section with a demonstration of the architecture and main properties of the most well-known schemes such as Helios, C-through and Petabit. 14.
(17) 3.3.1. Hybrid Electro-Optical Data Centers 3.3.2. Helios Helios is a hybrid Electronic/Optical switch architecture for modular data center proposed by [29] as a design to reduce the number of switches, number of cables, cost and power consumption while maintaining full bisectional bandwidth at minimum oversubscription ratio. Helios is a two-tier network consisting of ToR and core switches. The ToR switches are electronic packet switches while the core switches are a combination of optical and electronic switches. The electronic switches are used for all to all communication among pods, while the optical ones are used for long lived high-bandwidth communication. Each ToR switch has two types of transceivers: 10G colorless for connecting pods to electronic core switches and Wx10G (where W can be from 1 to 32 and it is the number of wavelength multiplexed) for connecting pods to optical core switches. The optical circuit switching in Helios relies on MEMS [30] technology. MEMS consists of crossbar fabric made of mirrors which can direct light beams from inputs to outputs without decoding or processing packets. Employing MEMS excludes the requirement of signal conversion from optical to electronic which results in high performance and less delays. Furthermore, MEMS consumes less power as compared to electronic switching (240mW vs. 12.5W per port). However, MEMS has an issue with the reconfiguration time (few ms) which is seen to be long. A simplified Helios topology model consists of 64 pods, each with 1024 hosts and two core switches; one for optical circuit switching and the other for packet switching. Depending on communication patterns, traffic shift and assignment are done statically between core switches through control software. The Helios design as depicted in Figure 9 was based on three main modules for its control software: Topology Manager (TM), Circuit Switch Manager (CSM) and Pod Switch Manager (PSM). Each module has a distinct role. The TM is responsible for monitoring and estimating pods traffic demands between servers. Then, it computes a new topology with optical switch configuration to sustain high network throughput all the time. The CSM is responsible for configuring the MEMS after receiving the graph of traffic connection. The PSM module resides on the pod switches and has a connection interfacing with the topology manager. The PSM maintains statistical details about traffic sent out from its pods. Based on calculation made by the TM for traffic routing decisions, the PSM gets the information and routes traffic accordingly either through the colorless transceivers or the WDM transceivers [30].. 15.
(18) Electronic Switch. Router. Optical Switch. Server. Switch. Aggregation Switch. Figure 9: The Helios Hybrid Electro-Optical DCN Topology.. 3.3.3. C-Through C-Through as depicted in Figure 10 is a hybrid packet and circuit switched data center network architecture (HyPaC) introduced in [31]. The design aims at supplying high bandwidth to data intensive applications through high speed optical circuit switched network that interconnects the DCN’s ToR switches. The HyPaC configuration, as can be seen in Figure 10, consists of traditional packet switched DCN tree hierarchy with access, aggregation and core switches in the top part and in the lower part, optical circuit switched network is used for rack to rack high-speed connectivity. Each rack can have one circuit switched connection at a time to communicate with any other rack in the network. For changing traffic demands over time, optical switch can be reconfigured (few milliseconds) to establish new matching between different pairs of racks. The traffic demands are analyzed and hence links are formulated by Edmond’s algorithm [32] for best maximum weight matching to satisfy dynamic intensive traffic requests among racks. The design relies on optical configuration manager that collects traffic information from the traffic monitoring systems placed on each host. Based on collected information, configuration manager establishes circuit switched optical links among racks with respect to the bandwidth requirement among every pair of racks. Once the optical switch is configured, the ToR switches are informed about the new set up 16.
(19) Core Switch. Aggregation Switch. Packet Switched Optical Network. Access(TOR). Circuit Switched Optical Network. Reconfigurable Optical Switch. Access Switch. Aggregation/Core Switch. Figure 10: The C-Through Hybrid Electro-Optical DCN Topology.. to route traffic via a special preconfigured VLAN that is dedicated to serve only optical circuits. In addition to C-Through, there were other hybrid designs such as the Optical Switching Architecture (OSA) architecture. OSA is a recent novel scheme for data center network presented in [33]. The OSA is closely related to C-Through and Helios architectures except that OSA avoids using electronic components other than ToR switches. The added value of the OSA design is that it is highly flexible because it can instantaneously adapt its topology and link capacities whenever traffic patterns changes. 3.3.4. Hybrid electro-WDM PON Data Centers Tomkos in [34] proposed a novel design that introduces passive optical network devices (PON) such as Arrayed Wave Guide Routers (AWGR) in data centers. The design scheme as shown in Figure 11 consist of Ethernet ToR electronic switches that are used for intra rack communication and WDM PON devices (AWGR) for inter rack communication. Each server is equipped with Ethernet and optical WDM transceivers. WDM PON participates in offloading inter-rack traffic and eliminating additional processing on ToR switches, hence power dissipated by TOR switches is reduced and high throughputs between racks are achieved with low delays. Authors reported a 10% power saving through simulation using three different traffic ratios for 17.
(20) AWGR. Server. Switch. Aggregation Switch. Figure 11: The Hybrid Electro-WDM PON DCN Topology.. inter-rack and intra-rack flows. 3.3.5. Full Optical Data Centers Petabit [35][36] is a full optical switching solution for data center networks based on a bufferless optical switch fabric using commercially available Array Waveguide Grating Router (AWGR) and TWC [37]. The Petabit design objective is to overcome the issues with oversubscription, bottlenecks, latency, wiring complexity and high power consumption. The Petabit switch flattened the network by designing one switch that is capable of connecting all racks within the data center. The design is targeting 10,000 of 100 Gbps ports by using one optical switch that is capable of delivering Petabit per second capacity. The structure of the Petabit switch as shown in Figure 12 is composed of a three-stage clos network fabric with Input Modules (IMs), Central Modules (CMs) and Output Modules (OMs), where each module has an AWGR [36]. Multiple of AWGRs are required for the Petabit switch since each AWGR can support few ports (128x128). Although the AWGR is passive and not configurable, the routing path from an input to an output and reconfiguration of the switch fabric are managed by TWCs which take care of wavelength conversion and hence traffic can be routed from any input to any output. To overcome the switch fabric reconfiguration time delay when dealing with small packets, Petabit assembles packets in frames 18.
(21) Input Module Tunable Laser Tunable Laser. Tunable Laser Tunable Laser. Central Module. Output Module TWC. TWC NXN AWG. TWC. NXN AWG. TWC. TWC NXN AWG. TWC. NXN AWG. NXN AWG TWC. NXN AWG. TWC. Figure 12: The Petabit Full Optical DCN Topology.. of 200ns size to allow sufficient time for fabric reconfiguration. In addition, the Petabit switch employs an iterative frame scheduling algorithm to coordinate input output traffic assignment. The performance of Petabit was shown to be improved; with the employment of three iterations and speed up of 1.6, the scheduling algorithm achieved 100% throughput, a detailed description of the scheduling algorithm is presented in [36]. Numerous other full optical designs for DCN interconnection have been presented to provide viable solutions for future data centers, allowing for high bandwidth interconnection for especially video streaming and cloud computing applications with acceptable reduced latency. Such full optical solutions are like DOS [38], Proteus [39] OSMOSIS [40], Space-WL [41], E-RAPID [42], IRIS [43], Data vortex [44], Polatis [45], OPST [46]. 4. Comparison and Discussion of DCN Architectures Over the past few years, the emergence of bandwidth intensive applications with power consumption concerns has driven the evolution of data center architectural designs. Figure 13 depicts a classification of the most well-known DCN architectures and their categorizations. DCNs are mainly classified into two classes: the electronic switch centric and server centric designs and the optical DCN designs. 19.
(22) The efforts in the design of electronic data centers have succeeded to mitigate many dilemmas and obstacles in providing switch centric architectures that can support fault tolerance, load balancing, agility and also overcome high oversubscription ratios. Server centric data centers then came next to use servers as relay nodes for each other and provide an infrastructure with low diameter and high capacity in order to support different traffic types for applications with intensive computing requirements. However, in server centric designs, additional wiring cost and complexity are a result of having servers equipped with more than one port. Advances in the optical networking technologies in providing optical transceivers, arrayed wave guide routers, wave division multiplexing, tunable lasers and passive optical devices have attracted great attention by researchers in academia and industries to adopt these technologies to overcome many existing issues in the design of electronic switch and server centric data centers. The driving force for the redesign of data centers to include optical switching along with electronic switches has become an attractive option because of the advancement of optical technology which has brought the prices of optical switches and transceivers down and also due to the fact that optical switching can provide high bandwidth, low power consumption and less complexity as compared to the designs which only include electronic switching technology. Hybrid schemes such as Helios and C-through are based on readily commercially available optical components and can be implemented by upgrading current data centers. Helios and C-through are quite similar in the design except that C-through uses WDM links. The main drawback of hybrid schemes is that MEMS take few milliseconds to be reconfigured, however, MEMS were found as an attracting solution to replace high power consuming electronic switches, where MEMs consume 0.24 Watts and electronic switches consume 12.5 Watts per port. On the other hand, most of full optical data center schemes are based on Semiconductor Optical Amplifier (SOA) switches which can replace MEMS and sustain negligible reconfiguration time. Unlike hybrid schemes, full optical schemes require a complete change of current data center in order to be implemented. Apparently, optical data center schemes seem to be promising solutions to gradually replace electronic data center schemes as they tend to provide low power consumption and high bandwidth with low latency.. 20.
(23) Summary of Data Center Architecture Designs. Electronic Data Center. Switch Centric. Optical Data Center. Hybrid Optical/Electronic. Server Centric. Full Optical. Conventional [3]. Bcube [8]. Helios [28]. DOS [37]. Fat-Tree [4]. FiConn [9]. C-through [30]. Proteus [38]. VL2 [6]. Dipillar [11]. OSA [32]. OSMOSIS [39]. Portland [5]. CamCube [15]. WDM-PON [33]. Space-WL [40]. SPAIN [13]. MDcube [14]. E-RAPID [41]. MONSOON [10]. IRIS [42]. QFabric [25]. VORTEX [43] POLATIS [44] OPST [45] Petabit [34][35]. Figure 13: Summary of Data Center Architectures. 5. Energy-Efficient Data Centers The United States (US) Environmental Protection Agency (EPA) has reported in 2007 that data center power usage in the US doubled between 2000 and 2006 to nearly 61 billion kilowatt-hours, which represented about 1.5% of all US electricity consumption [16]. The increase of power consumption will definitely result in large carbon foot print and more emission of greenhouse gases which are the main contributors to global warming. The IT equipment is the most power hungry components in data centers, represented by the servers, switches, routers and power distribution infrastructure [18]. A performance metric for Power Usage Efficiency (PUE) is used to measure how efficient a data center is in using its power and can be calculated by dividing the total facility power by the IT equipment power consumption. The value of the PUE can be within the range 1.2 and 2, where a PUE value of 1.2 would indicate a highly energy efficient data center [47]. 21.
(24) In the following sections, the followings will be presented: a concentrated investigation in different methods with a detailed overview of energy saving approaches and industry adopted techniques for energy efficient data centers such as virtualization, dynamic frequency and voltage scaling, dynamic network management, efficient green routing, green schedulers, network scheduling schemes, and rate adaptation, smart cooling and renewable energy. 5.1. Architecture of the Data center Topology and Power Consumption The energy consumption of different structures of data centers with emphasis on energy requirement of data center architecture with respect to transmission capability has been studied in [48]. Different topologies covering switch centric and server centric have been studied and simulated using power consumption values of switches available in the market (Cisco and Dlink). The power consumption of a server’s port was assumed to be 3W. The energy consumption of DCell, BCube, Fat-tree and balanced tree architectures with comparable number of servers were studied in [48]. The result has shown that balanced tree architecture consumes less power regardless of the number of servers but it has limited transmission capacity because it has a server in the root that becomes a throughput bottleneck. DCell and BCube happened to consume the same amount of energy for small sized data centers consisting of about 2500 servers. However, Bcube consumes more energy for larger data center if the number of servers is to be increased to more than 5000. On the other hand, Fat-Tree structure topology was found to have moderate power consumption values between Dcell and Bcube. 5.2. Virtualization Starting with virtualization since it has given a great attention by researchers and being the mostly adopted technique for data centers power saving [49]. Virtualization is a method to enable services to be moved between servers and have mutiple VMs Machines which can serve different applications multiplexed to share one server. Knowing that idle servers consume about 66% of its peak and having in mind that data center resources are underutilized since the average traffic load accounts for about 30% of its resources [24], agility can achieve servers statistical multiplexing and give the illusion to services to make them feel that they all connected to the same switch. Hence, servers can be placed anywhere within the network and be assigned to any service. The migration of virtual machines to consolidate workloads on a set of servers and then by shutting down underutilized. 22.
(25) servers could definitely lead to a great power saving in data centers. However, many barriers [1] like VLANs, access lists (ACLs), broadcast domains, and Load Balancers (LB) were standing as an obstacle and prevented researchers and industries from immediate implementation of VM migration (agility) on conventional data centers. The static network assignment between servers and services in conventional data centers prevent idle servers from being assigned for overloaded services thus resulting in underutilization of resources [2]. VL2, for instance, can be implemented on existing hardware and can still provide high load balancing. The main objectives of VL2 are providing agility among servers via the use of special flat addressing scheme that separate server names (AA) from their locations (LA), then mapping between the AA and LA can be managed and handled by a directory system. LAs are addresses assigned to switches and interfaces (network infrastructure) while applications are assigned with permanent AAs. AAs remain unchanged no matter how servers’ location changes because of the VM migration. Each AA is associated with LA which is the IP of the ToR switch to which the application server is connected. The sender server, before sending, must encapsulate the packets in the outer header with the LA of the destination AA. Once packets arrive to the LA (ToR), the ToR switch encapsulates the packets and sends them to the destination AA [6]. All servers believe that they all belong to the same subnet, hence when any application sends a packet to AA for the first time; the servers’ network stack broadcasts an ARP request [6]. The VL2 agent intercepts the request and sends a unicast query message to the directory server which replies with the LA of the ToR switch where packets should be tunneled. Portland [5] has proposed another way to solve the agility issue in data centers. Portland, just like VL2, is based on a Fat-tree network topology and consists of three layers: edge, aggregation and core. Both separate names from locators and reduce broadcast by intercepting ARP requests and employ a unicast query through a centralized lookup service. Portland assigns Pseudo MAC (PMAC) to all end hosts to encode their positions within the topology and it is changed whenever the location of the host is changed. The Portland fabric manager is used for centralized lookup services, it is used to reduce broadcast overhead from the network and it works in the following manner: The switches intercept the ARP requests for IP to MAC mapping and forward a unicast query to the fabric manager which then provides the requested information to the switch. The switch then forwards it to the requesting end host. In the case where the mapping details are not available, the fabric manager broadcasts to the core/aggregation/edge/hosts, host which will reply with its AMAC which will be rewritten by the egress 23.
(26) switch to the appropriate PMAC before forwarding to the requesting host and the fabric manager [2]. According to the EPA study, the servers are found to be the most hungry power parts of the ICT components of data centers since they contribute about 40% of total electricity consumption [16]. The agility was mainly proposed to reduce the cost of power consumption by low utilized servers and to facilitate an efficient use of data center resources. By introducing virtualization, the services are able to be moved between machines and have the illusion that all the servers assigned to them are connected by the same switch and hence allow a smooth migration among servers without changing the IP address or any occurrence of TCP disconnection. Two methods were presented to achieve agility in current data centers via the implementation of VL2 [6] or Portland [5] designs respectively. Researchers [50] have proposed a method to optimize data center resources through dynamic consolidation of VMs on few servers while putting the rest on sleep state and hence bringing substantial energy savings while providing the required Quality of Services (QoS). The migration of VMs is optimized by selecting the VMs to be relocated on the basis of heuristics related to utilization thresholds. By setting up predefined thresholds values and through a continuous monitoring of the servers’ resources utilization, a decision of migrating VMs can be taken if these thresholds are exceeded. This results in a better performance for servers and also in lower power consumption because of the overheating and the cooling system. On the other hand, VMs migration will also take place if servers’ resources utilization is below certain predefined threshold values, which will allow for shutting off these servers and save the power consumed by an idle device. The system structure as shown in Figure 14 [50] consists of a dispatcher, global and local managers. The local manager role in the structure is to monitor the thermal status and resources utilization of the network devices [51]. Based on the local manager observations, it sends to the global managers the collected information about the utilization of resources and the VMs that have to be migrated, when the global managers become responsible for issuing commands for live migration of VMs, resizing the network and hence eliminating servers by switching them off. Another measure of VMs migration decisions carried by the local manager is the VMs that have intensive communication with other VMs that are allocated in different physical hosts. Workloads corresponding to web applications and online services have been simulated in [50]. Results show that dynamic consolidation of VMs brings substantial energy savings that is close to 83% while providing the 24.
(27) Dispatcher Users Local Manager. Local Manager. Local Manager. VMM. Local Manager. VMM. Local Manager. VMM. VM. VM. VM. VM. VM. VM. VM. Physical Node 1. VM. Physical Node 2. VM. Physical Node N. Figure 14: Virtual Data Center.. required QoS. Consequently, this results in a user’s enhanced Quality of Experience (QoE) [52]. The VM migration in data center can generate a significant amount of overhead traffic passing from one server to another; hence an efficient method for migration should be taken into account to avoid unnecessary congestion of the network links that may occur. A study [53] investigated the effect of overhead traffic resulting from live migration on a realistic web 2.0 application hosted on networked virtual machines with several load samples and experimental results have shown that live migration overhead is acceptable but cannot be disregarded. Having network resources into consideration while migrating VMs, [54] has discussed the impact of VM live migration on network resources and how to control the traffic overhead caused by live VMs migrations. A network aware scheduling for live migration of VMs is introduced in [54]. It categorizes VMs according to their workload size and duration with an emphasis on hosts’ utilization. Adequate resource and migration scheduling models for each class were also introduced [54], taking into account bandwidth requirement for the migrations and network topologies to ensure that load generated from VMs migration will not cause network congestion. SecondNet [55] is a virtual data center network architecture that can be built on top of many existing data center network topologies such as fat-tree [4], VL2 [6], and Bcube [8]. In SecondNet, a central Virtual Data Center 25.
(28) (VDC) manages the VM requests and controls virtual to physical mapping with guaranteed bandwidth reservation. Neighboring servers are grouped into clusters, so that when VM requests are received, VDC allocation requires search in specific cluster instead of searching in the whole network, which reduces the time complexity. In addition, grouping servers into clusters can place communicating VMs in the same cluster or within a close distance which is in fact more bandwidth efficient. The VDC manager uses spanning tree for signaling and devices also uses the spanning tree to deliver failure messages to the manager VDC which in turn changes the routing paths and reallocate VMs if required. Path reallocation can be done in seconds where VM migration takes tens of seconds. Simulation results have shown that SecondNet provides a guaranteed bandwidth along with high network utilization. A method for VM placement has been proposed in [56] to minimize the distance between VMs with large mutual bandwidth to reduce load at aggregation and core switches and to avoid unnecessary consumption of network resources. The authors of [56] defined the Traffic-aware VM Placement Problem (TVMPP) as an optimization problem, having traffic matrices and cost among VMs as the input. The heuristic algorithm to solve the TVMPP works in two tier approach, first it partitions the VMs and hosts into clusters, then it matches the VMs and hosts with respect to traffic matrices and cost among VMs. [56] has investigated four known data center architectures; Tree, Fat-Tree, VL2 and Bcube under different traffic patterns. The results have shown that the benefits of the TVMPP relies on the network architecture. Since the VL2 architecture deploys valiant load balancing, it has shown results with minimal benefits where Bcube shows more benefits. Finally, virtualization and live VM migration are widely adopted for resource allocation because of the fact that this technique can lead to considerable energy savings in data centers. Nevertheless, the effects this could cause to the network performance in terms of delay and throughput require careful considerations. A study on Amazon data center to measure the impact of virtualization on network parameters such as throughput, packet delay, and packet loss has been conducted in [57]. This study shows that, although data center is underutilized, virtualization can cause delay variation and throughput instability. Hence, further studies are required on how to customize applications to achieve good performance on virtualized data centers. 5.3. Energy-Aware Routing in Data Centers The objective of energy aware routing is to save power consumption via putting idle devices on sleep or shutting them down and using few network 26.
(29) Source. Source. Figure 15: Buffer and Burst B&B.. devices to provide routing with no sacrifice on network performance. Network devices consume 20%-30% of the energy of the whole data center [58]. In [59], an energy aware routing model was proposed and described as ERP1: (G, T, K), where G is the topology, T is the traffic matrix and K is a predefined threshold of network throughput. The objective is to find a routing for a specific topology where the total number of switches involved in the routing can sustain a network throughput that is equal to or higher than the defined threshold. A knapsack problem approach is used to optimize the number of nodes that should be part of the routing for a number of flows while maintaining a throughput level not less than a predefined threshold value [59]. The authors proposed a heuristic routing algorithm made of three modules: Route Generation (RG), Throughput Computation (TC), and Switch Elimination (SE). Basically, the algorithm first computes the network throughput through basic routing. Then, it gradually removes switches until the network throughput approaches the predefined performance threshold. Finally, it powers off or puts on sleep mode the switches that are not involved in the final routing. The output of the heuristic shall consist of a (R,G) tuple where R is energyaware routing chosen for T, and G is a final topology with SE. Three modules are executed repeatedly until the best acceptable performance threshold is achieved and, in each round, some switches and links are eliminated then routing is generated for T in the updated topology G.. 27.
(30) 5.4. Dynamic Voltage/Frequency Scaling (DVFS) The frequency and voltage scaling represents another method to reduce servers power consumption, where there is a relation between voltage/frequency and the power consumed as described by: P = V2 *f , (f is the frequency, V is the voltage and P is the power). The servers’ memory, bus, I/O resources and disks power consumptions are not affected since they do not rely on the CPU frequency. Still, a significant saving can be achieved by reducing power via reducing frequency or voltage supplied to the processing chips [18]. In order to implement the DVFS technique on computing devices such as servers, hardware support for Advanced Configuration and Power Interface (ACPI) power management is required. The ACPI has four modes of power states: G0 for power-on, G1 for partial sleeping that subdivides into four states, G2 is for soft-off except with having the Power Supply Unit (PSU) still supplying power and G3 for power-off state [60]. Researchers in [61] proposed PowerNap, which is a system that dynamically and rapidly responds to instantaneous workload and makes transitions between the active and the idle states. PowerNap detects Lower Power Idle (LPI) state that discovers servers that have been idle for long period to put them in low power states and also to minimize the response time in case of transition between states. The authors introduced the concept of Redundant Array of Inexpensive Load Sharing (RAILS) that facilitates the sharing of power draw among multiple power supplies and guarantees zero power draw in idle states which results in saving up to 66% of servers’ consumed idle powered. The authors claimed that through the implementation of RAILS and PowerNap power consumptions by servers can be reduced to 74% [61]. 5.5. Rate Adaptation in Networks Similar to the servers, DVS can be applied to links and switches to reduce power consumption. With respect to traffic patterns and link utilizations, data rate can be reduced by applying DVS on transceivers and ports. The energy consumed by a switch can be defined as [18]: P Pswitch = Pchasis + nlinecards × Plinecard + R i=0 nports × Pr , where Pr is the power consumed with respect to rate. An ethernet link dissipates 2-4W when operating at 100Mbps-1Gbps and can dissipate 10-20W when operating at 10Gbps. Hence, lowering the operating data rate could have a dramatic effect on power saving in data centers [62]. However, a keen care has to be taken into consideration while lowering down the rate to keep the overall performance of the network intact which can be caused by congested links. The authors in [62] proposed two 28.
(31) approaches for rate adaptation; optimal and practical approaches. The optimal approach assumes a full knowledge of future traffic arrival time, link rates and packet delay. Hence, the service curve is chosen to be the optimal for minimizing energy consumption and shall be the arrival curve which is shifted in time by the accepted delay bounds. On the other hand, the practical approach makes use of the history of previous packet arrival rates and chooses the rates among a predefined rate set. For queuing delay estimation, the practical approach relies on link buffer size and the rates. In summary, the rate shall be increased to ri+1 for if the current queue size divided by the current rate is bigger than the delay time. A decrease of rate to ri−1 shall be enforced if the queue is empty and the arrival rate is lower than ri−1 . The authors proposed an algorithm to monitor the queuing delays in order to adapt the rates accordingly and achieve a steady state without creating large queues and delays. 5.6. Dynamic Power Management (DPM) Dynamic Power Management (DPM) is a method used in data centers to reduce power consumptions of some IT infrastructure components by switching them off or by lowering the power state when inactive. Such components can be the NICs, access switches, aggregation switches, and servers as well [63]. Putting network elements to sleep is not a new idea; it has been already implemented for microprocessors and smart phones. The idea is to put line cards on sleep one by one then to put route processor and switch fabric on sleep if all line cards are on sleep [62]. Measures and considerations for modeling a network sleep state should take care of power draw of sleep state over idle state, transition time in and out of a sleep mode, and the method to enter and exit a sleep state [62]. The Wake Up on Arrival (WOA) method was proposed in [64] for green internet is another example deployed for data center routers. The routers shall have a sensing circuit that is left powered on during the sleep mode, and it senses traffic arrival and hence wakes up routers to forward and then returns to sleep if no more packets are arriving. An issue of lost bits which arrive first to wake up the router which takes time to transit from sleep to active mode was also solved by having dummy packets. In [62], an issue of frequent transitions due to small packet sizes was discussed and a solution was proposed to overcome this issue by shaping traffic into bursts. As in Figure 15 [62], the routers arrange and maintain packets destined to the same egress into bursts and then forward them. This approach is called Buffer and Burst (B&B) and allows routers to sleep for longer time and hence save more power.. 29.
(32) Computational Intensive Workload (CIW). • Load at computing servers and require almost no data transfer in the interconnection network fabric of the data center. • CIW scheduling groups the workload at the minimum set of servers and routing using the minimum set of routes.. Data Intensive Workload (DIW). Balanced Workload (BW). • No load at computing servers and require heavy data transfers. (examples: video file sharing and streaming). • Continuous feedback between switches and scheduler to allow scheduler send loads over non congested routes. • Applications having both computing and data transfer requirement • Example of such is Geographic Information System (GIS). • Scheduler accounts for servers’ load and the load of links.. • No danger of congestion as long as data transfer is low.. Table 1: Data Center Workloads Classification [65].. 5.7. Data Center Energy-Aware Scheduling Methods Different approaches [18] of traffic scheduling in data centers were studied and proposed to either consolidate workloads on a few set of servers or to fairly distribute workload on the servers. A tradeoff is always present between energy saving and performance, hence the scheduling should always consider delay bounds, rate threshold and buffers occupancy in order to avoid degradation of performance while achieving a considerable saving in power consumption in data centers. Traffic workloads are classified into three main categories as described in [62] with the workload types in data centers and the best way of scheduling implemented in each category. In [65], the authors proposed Data center Energy efficient Network aware Scheduling (DENS) whose main objective is to balance the energy consumption of a data center with performance, QoS and traffic demands. DENS achieves this objective via the implementation of feedback channels between network switches for workloads consolidation distribution amendments to avoid any congestion or hot spots occurrences within the network which can definitely affect the overall performance. Congestion notification signal by overloaded switches can prevent congestion which may lead to packet losses and sustain the high data center network utilization. On the other hand, the green scheduler [65] performs workload consolidation on minimum possible set of links, switches, and servers and then uses DPM to switch off unused servers and switches. Finally, round robin scheduler is implemented for uniform distribution of workload over all servers, which results in underutilization of resources of data centers. Figure 16 shows simulation results for the different three schedulers: DENS scheduler, 30.
(33) Figure 16: The DENS, Green and Round Robin Schedulers [65].. green scheduler and round robin scheduler [65]. The noticeable increase in energy consumption due to the increase of number of selected servers between the green scheduler and the DENS scheduler can be justified by the necessity of involving extra servers and communication resources, detected by DENS methodology to keep the quality of job execution at the desired level without congestions. DENS methodology always avoids overloaded switches and servers by distributing the traffic load based on switches’ queue size and servers’ loads using a special metric. M = α × fs + β × fr + γ × fm The DENS metric M is defined as a weighted combination of server-level fs , rack-level fr , and module-level fm functions. The coefficients β, α, and γ define the impact of each component (servers, racks, and/or modules) on the metric behavior. Higher α values result in under-utilized racks being selected by the overloaded servers. Higher values of β give priority to computationally loaded racks with low network traffic activity, and Higher γ values favor the selection of loaded modules [65].. 31.
(34) Server. Switch. Figure 17: The Fat-Tree versus ElasticTree.. 5.8. Dynamic Adjustments of Active Elements via Network Power Manager 5.8.1. ElasticTree The ElasticTree as depicted in Figure 17, proposed in [58], is a fat-tree based data center topology that consists of a network optimizer which continuously monitors traffic conditions within the data center. The optimizer then chooses the set of network elements that need to be active in order to meet performance and fault-tolerance requirements and switch off the remaining links and switches that are not involved in the routing and load processing. Various methods are proposed in [58] to decide which subset of links and switches to use, such methods can be greedy bin-packer, topologyaware heuristic, or prediction methods. The experiments have shown that savings of 25-40% of the network energy in data centers can be achieved if ElasticTree was implemented. The ElasticTree as depicted in Figure 19, consists of three logical modules: optimizer, routing and power control. The optimizer role is to find the minimum subset of the network in order to satisfy traffic demands with decent performance. Once the optimizer analyses the traffic matrix, it selects the minimum set of network that needs to be on to satisfy the demands, then it passes the information to the power and routing modules which in turn control the switching on or off of links and select flows routing reP spectively. The optimization goal of ElasticTree is to minimize (links + 32.
(35) Virtual Physical NOX App. OpenFlow protocol Switch Box 2. Switch Box 1. Switch Chip 0a. Switch Chip 0b. Switch Chip 1a. Switch Chip 1b. Pod 0. Pod 1. Pod 2. Pod 3. Master. Latency Monitor Traffic Mux. NetFPGA. NetFPGA. NetFPGA. NetFPGA. Traffic Gen. Traffic Gen. Traffic Gen. Traffic Gen. Figure 18: ElasticTree experimental setup for k=4 (1 NetFPGA emulates 4 servers with 1GE connection each) [58].. switch power) while meeting the capacity, demand, and flow conservation constraints. Power saving can be calculated by finding the ratio between the power consumed by the elasticTree and the power consumed by Fat-Tree. Figure 18 presents the experimental setup through test bed to test and evaluate ElasticTree as demonstrated in [58]. In the experiments, four NetFPGA representing 16 servers were used to generate traffic and a latency monitor was used to monitor packet drops and delays. 5.8.2. Pcube In addition to the switch centric ElasticTree, researchers have also investigated server centric data centers to improve power efficiency through dynamic adjustment of the network structure based on traffic demands. Modular server centric data centers such as Bcube can offer high bandwidth with sufficient speed-up to support high-performance for one to one, one to all and all to all applications. PCube [66] as shown in Figure 20 is represented as PCube(n,k,q) where n is the number of switch ports, k is the number of levels and q is the number of ports in each server. Pcube is an adaptive design with capability of switching off links depending on the traffic patterns within a data center. For low traffic, Pcube turns off many links and outputs a topology with few numbers of links. Figure 20 demonstrates an 33.
(36) Network Analyzer Optimizer Analysis of traffic patterns OR. Live Feedback from DC. Link Capacity. Traffic Matrix Traces. Constraints Flow Conservation. Demand Satisfaction. Network Scheduler Traffic Routing Routing path and Traffic forwarding. Power Controller. Data Center Network Output Subset of The Topology. Control power states of switches/links/ routers. Figure 19: The Elastic Tree System Diagram.. example for PCube(2,4,3) and PCube(2,4,4) where both host the same number of servers, but in PCube(2;4;3) 25% of switches are powered off to save 25% of the energy consumed by switches. Further reductions in the number of switches, by switching off 8 more switches, will result in PCube(2,4,2), contributing to a saving of 50% in switch power. In PCube, a dedicated server acting as the network manager is responsible for receiving bandwidth requirement requests from other servers and based on that it decides on how the structure can be transformed. PCube calculates the new routing paths for the modified structure and broadcasts the new topology structure and routing information to all servers. The network manager allows for few seconds before switching off the unnecessary switches to ensure that all servers received the changes to the topology and reacted upon it. Both PCube and ElasticTree dynamically and instantaneously act on traffic demands to select a subset of the network elements and hence reduce power consumption without sacrificing network performance. PCube and ElasticTree are based on the switch centric fat-tree and server centric BCube respectively. As a comparison, PCube (BCube) provides better one-to-all traffic support than ElasticTree and with respect to power consumption, 34.
(37) Figure 20: PCube.. PCube can save 50% of power consumed by ElasticTree serving the same number of servers [66]. 5.8.3. Hierarchical Energy Optimization (HERO) In data centers with thousands of switches, complexity is an issue in solving the energy optimization problem because of the high number of variables and constraints needed to formulate the problem. HERO is a recently introduced work by [67][68] to solve an optimization problem in a hierarchal way to achieve similar results for power saving achieved in non-hierarchal models. Hierarchal HERO to non-hierarchal models ratio of variables and constraints are 35% and 40% smaller respectively. Hence a great reduction in time complexity is achieved with HERO. In HERO, power optimization in data centers is divided into two levels, the core level and the pod level. In the core level optimization, core switches that serve outgoing traffic and aggregation switches that serve for out of pod traffic must be determined and be on active mode. While in Pod level optimization, aggregation switches to serve intra pods traffic are determined and put on active mode. For a given traffic matrix, a capacity constraint multi-commodity flow optimization (CMCF) problem is formulated for each level to determine switches and links that should be switched off in the network while assur35.
(38) ing connectivity and QoS. Greedy heuristics based on different criteria for switches/links disconnection were also implemented to find additional nodes and links that can be switched off and hence more power saving is achieved. Simulations have been carried out for different traffic scenarios and results have shown that the hierarchical model can achieve similar results of power saving as with the non-hierarchical model with a great reduction in algorithm complexity. 5.9. Energy Efficient Cooling in Data Centers The most challenging issue in designing a data center is how to come up with a design which can reduce overall power consumption and has less carbon foot print contribution to the environment. According to some studies [69], the power consumption of the global data centers in 2007 was 330 billion kWh. The same study claimed if no implementation on green energy methods is enforced on data centers, data center’s power consumption will exceed 1000 billion kWh by 2020 which translates to 257 MtCO2 gas emissions [69]. As the size of data centers increases, power density and heat dissipation from servers and network equipment have also significantly increased. The dissipated heat from these systems along with the elevated equipment temperature must be maintained at acceptable rates for reliable operation and to avoid any hardware failures. A break down cost analysis for a data center has been provided in [1], stating that the amortized cost for cooling and power distribution is about 25% of the total cost. As a result, smart energy efficient cooling techniques for data centers have become a major and an attractive challenge. To tackle this issue, in 2004 the American Society of Heating, Refrigerating, and Air-Conditioning Engineers (ASHRAE) published ‘‘Thermal Guidelines for Data Processing Environments’’ [70] as a guideline document for designers and equipment manufacturers to standardize the designs of data center facility to help creating energy efficient data centers [71]. Researchers and industries have investigated smart cooling technologies and shown its effectiveness in saving energy in data centers. Dynamic Smart Cooling (DSC) [72][73], proposed by HP can reduce the cooling power consumption within a data center by 30 to 60%. DSC combines sensors with control nodes that continuously monitor temperatures and consequently adjust air conditioning settings in parts of the data center accordingly. The facility infrastructure design along with sensor reporting values of temperature indicate which parts of the data center is in need of cooling, instead of having the cooling system in operation continually. The DSC was implemented in Bangalore and achieved 40% reduction in cooling energy consumption [74]. 36.
Figure

+7
![Figure 5: The Qfabric architecture [27].](https://thumb-us.123doks.com/thumbv2/123dok_us/7936415.194671/12.612.211.396.135.269/figure-the-qfabric-architecture.webp)


Related documents
A three-tiered topology (see Figure 1) contains core switches at the root level, aggre- gation switches at the middle level, and access level switches.. connected to the hosts. In
• A non-parametric statistical hypothesis test used when comparing two related samples (paired). • The test is named for Frank Wilcoxon (1892–1965) who, in a single paper,
Relationship between nirS and nirK gene abundance and denitrification potential (DNP) for summer, fall, and winter sampling dates WLISS samples. Relationships analyzed with
The nationwide system of educational monitoring in the USA allows educators to improve quality of education for a student, school and school districts, to grand students who
► T-Trainers: train Master Trainers, Leaders, and facilitate participant workshops..
Pada pengujian 2 kondisi tersebut didapatkan kombinasi unit pembangkit yang beragam telah memenuhi biaya operasi paling ekonomis tanpa melanggar batasan waktu nyala minimal,
In accordance with our requirements as highlighted by the Civil Contingencies Act (2004) and the Operating Framework for 2010/2011, this is to give the Board an update on the
Essas constatações são corroboradas no presente trabalho, uma vez que P1 corresponde a um Organossolo Háplico Sáprico térrico (Embrapa, 2006), com mais baixos teores de
