This is a repository copy of Three-dimensional terahertz imaging using swept-frequency
feedback interferometry with a quantum cascade laser.
White Rose Research Online URL for this paper:
http://eprints.whiterose.ac.uk/83440/
Version: Accepted Version
Article:
Keeley, J orcid.org/0000-0001-5251-6648, Dean, P orcid.org/0000-0002-3950-4359,
Valavanis, A orcid.org/0000-0001-5565-0463 et al. (9 more authors) (2015)
Three-dimensional terahertz imaging using swept-frequency feedback interferometry with
a quantum cascade laser. Optics Letters, 40 (6). pp. 994-997. ISSN 1539-4794
https://doi.org/10.1364/OL.40.000994
[email protected] https://eprints.whiterose.ac.uk/
Reuse
Items deposited in White Rose Research Online are protected by copyright, with all rights reserved unless indicated otherwise. They may be downloaded and/or printed for private study, or other acts as permitted by national copyright laws. The publisher or other rights holders may allow further reproduction and re-use of the full text version. This is indicated by the licence information on the White Rose Research Online record for the item.
Takedown
If you consider content in White Rose Research Online to be in breach of UK law, please notify us by
1
Three-dimensional terahertz imaging using
swept-frequency feedback interferometry with
a quantum cascade laser
J. Keeley,1,* P. Dean,1 A. Valavanis,1 K. Bertling,2 Y. L. Lim,2 R. Alhathlool,1 T. Taimre,3 L. H. Li,1 D. Indjin,1 A. D. Rakić,2 E. H. Linfield,1 and A. G. Davies1
1School of Electronic and Electrical Engineering, University of Leeds, Leeds LS2 9JT, United Kingdom 2
School of Information Technology and Electrical Engineering, The University of Queensland, Brisbane, QLD 4072, Australia
3
School of Mathematics and Physics, The University of Queensland, Brisbane, QLD 4072, Australia *Corresponding author: [email protected]
Abstract:
We demonstrate coherent three-dimensional terahertz imaging by frequency modulation of a quantum cascade laser in a compact and experimentally simple self-mixing scheme. Through this approach we can realize significantly faster acquisition rates compared to previous schemes employing longitudinal mechanical scanning of a sample. We achieve a depth resolution of better than 0.1 m with a power noise spectral density below −50 dB/Hz, for a sampling time of 10 ms/pixel.
Terahertz (THz) quantum cascade lasers (QCLs) [1] have stimulated significant interest in the development of imaging systems [2] at THz frequencies owing to their compact size, high output power (>1 W) [3] and broad spectral coverage (~1.2 − 5.2 THz) [4, 5]. Whilst THz QCLs are particularly suited to coherent sensing approaches due to their continuous-wave narrowband emission with quantum noise-limited linewidths [6], the majority of QCL-based imaging systems reported to date have employed incoherent detection. Nevertheless, coherent detection approaches offer the potential for high dynamic range [7] and detection close to the shot-noise limit [8]. Furthermore, the ability to resolve both the amplitude and phase of the THz field has enabled depth-resolved [three-dimensional (3D)] imaging [8, 9] and the spatial mapping of the complex permittivity of targets [10], as well as inverse synthetic aperture radar imaging [11, 12]. Sensing techniques in such systems have used heterodyne mixing between the QCL and a gas laser through a Schottky detector [12], and electro-optic harmonic sampling of the THz field using a near-infrared femtosecond laser comb [8]. Both of these methods, however, require electronic stabilization of the QCL to an optically-derived reference frequency, resulting in complex experimental arrangements.
A considerably simpler and more compact coherent imaging scheme in THz QCLs employs self-mixing (SM) [9–11, 13, 14]. SM occurs when radiation emitted from a laser is re-injected into the laser cavity by reflection from a remote target. The re-injected field interferes with the intracavity field, resulting in perturbations to both the measured output power and laser terminal voltage [13, 14] that depend on both the amplitude and phase of the reflected field. In previous work [9] we have demonstrated 3D profiling of structures using SM interferometry with a THz QCL. Slow longitudinal mechanical scanning of the sample was employed to acquire an interferometric waveform at each transverse position on the sample surface. We showed that through numerical fitting to a three-mirror laser model, both the surface morphology and reflectivity of the sample could be determined, on a pixel-by-pixel basis, from the fitted phase and amplitude parameters, respectively. However, owing to the need to mechanically scan the sample longitudinally at each pixel, the imaging rate of this system was limited to 0.05 pixels/s. This was compounded by the mechanical modulation scheme used for lock-in detection of the small variations in the laser terminal voltage under feedback, which imposed an upper limit (~200 Hz) on the modulation frequency. This is far below the ~10–100 GHz optical feedback response bandwidth of QCLs [15].
2
Despite this simplified analysis, but by virtue of the fast acquisition rates which reduce the influence of slow thermal drift of the laser emission frequency, we achieve a depth resolution better than 0.1 m for a sampling time of 10 ms/pixel. Additionally, by removing the mechanical component of signal modulation, greatly increased modulation rates (>10 kHz) can be realized, enabling shorter sampling times. This approach achieves all of the advantages of previous SM THz imaging systems [9] including high sensitivity and compactness, and the lack of requirement for laser frequency stabilization, but gives significant improvement in imaging speed and experimental simplicity.
The system used in this work is based on that described in Ref. 10. The THz QCL consisted of a 10-µm-thick bound-to-continuum active region [17] emitting at ~2.65 THz ( ≈ 113 µm), which was processed into a semi-insulating surface-plasmon ridge waveguide with dimensions 3 mm x 140 µm. The device was cooled using a continuous flow helium cryostat and maintained at a heat-sink temperature of 25 ± 0.1 K. The threshold current at this temperature was 1000 mA. Radiation from the laser was focused onto the sample using a pair of 2-inch-diameter f/2 off-axis parabolic reflectors, with the mean distance between the laser facet and the target being 0.41 m through an unpurged atmosphere. The beam spot size on the sample is estimated to be ~250 m. The laser radiation reflected from the sample was coupled back to the QCL facet along the same optical path as the emitted beam. A current source was used to drive the laser at a constant current of 1050 mA, with a sawtooth current modulation of frequency fmod = 1 kHz (90% duty cycle) and amplitude 100 mA superimposed on the dc current; the corresponding modulation of the QCL emission frequency was measured to be 850 MHz, maintaining single mode emission throughout this range. The SM signal was monitored via the QCL terminal voltage, amplified using a 20 dB ac-coupled amplifier and sampled at a rate of 500k samples/s using a 16-bit digital acquisition (DAQ) board. Under feedback, interferometric fringes were superimposed on the QCL voltage and were extracted by subtracting the baseline modulation.
To acquire a 3D image, the sample was raster-scanned in two dimensions (X−Y) orthogonal to the beam axis, over an area of 10 mm x 9 mm with a step size of 0.1 mm x 1 mm. At each pixel the QCL voltage was averaged over N modulation periods in order to reduce noise present in a single SM signal measurement. The sampling time per pixel, defined as tsamp = N⁄fmod, could thus be controlled
by the amount of averaging and the modulation frequency. The effects of these parameters on system performance are discussed below. It should be noted, though, that the acquisition time in our system is currently limited to 25 ms/pixel owing to software and hardware limitations. Nevertheless this represents a significant improvement compared to the 20 s/pixel acquisition times reported previously for mechanically-modulated 3D imaging approaches [9].
Coherent 3D imaging was demonstrated using exemplar GaAs structures [9] that were fabricated by wet chemical etching. The sample comprised three stepped regions (in the X-direction) with a nominal step height 10 µm and a width (in the Y-direction) of 3.1 mm. The upper half of each structure was coated with a 125-nm-thick layer of gold in order to provide regions of differing reflectivity. Figure 1(a) shows SM fringes acquired from different regions of the sample with N = 200 waveform averages. Waveform A (blue) corresponds to the gold-coated region of the sample. Waveform B (red) corresponds to an uncoated region from a different step to waveform A. The different height manifests itself as a relative phase shift, whilst the lower amplitude of waveform B corresponds to a lower surface reflectivity. A fast Fourier transform (FFT) of these waveforms was performed in order to extract the phase and amplitude parameters of the SM fringes. The interferometric phase of the SM signal under frequency modulation of the laser is given by [18, 19]:
where = arctan(lm[Î(f)]/Re[Î(f)]) is the initial phase of the SM fringe, which can be calculated from the real and imaginary components of the complex FFT Î(fc), is the laser frequency without feedback at t=0, c is the speed of light, L is the external cavity length, = −945 GHz/s is the modulation rate and fc is the carrier frequency given by fc = 2L⁄c. From the phase at each pixel (X,Y), the external cavity
length, which can be related to the surface depth of the sample L, can be calculated as [18]:
In this way the range of surface depth that can be resolved unambiguously is /2, although phase unwrapping allows this to be extended for continuous (non-abrupt) changes in surface morphology.
Figure 1(b) shows the average depth profile obtained across the uncoated rows of the sample,
traversing the three stepped regions (along the
X
direction), together with the average depth3
through non-contact optical profilometry (Bruker NPFLEX 3D) is also shown, and found to give good agreement with the THz data. Since the sample was not perpendicular to the beam for THz
measurements, which manifests as a measureable tilt (~0.36°) in the profile, the same sample tilt was
applied to the optical profile data. A full 3D reconstruction of the sample is shown in Fig. 2(a).
Fig. 1. (a) SM voltage waveforms acquired from two different positions on the sample surface. Waveforms A and B correspond to gold-coated and uncoated regions, respectively. Inset: Magnitude of the complex FFT for waveform A. (b) Change in surface depths, L, obtained from the average of all uncoated rows (bottom trace; red) and all gold-coated rows (middle trace; blue). Also shown is the profile obtained from the non-contact optical profilometer (top trace; black). Each trace has been offset visually for clarity. We attribute ringing observed at the step faces to the imperfect shape of the QCL beam spot.
Fig. 2. (a) 3D reconstruction of the sample. Colour scale corresponds to depth. (b) Reflectivity profile of the sample. The top four millimeters correspond to the gold-coated region of the sample. Colour scale corresponds to normalized reflectivity.
4
sample surface. Figure 2(b) shows the two-dimensional variation of this reflectivity across the surface of the sample. The differing reflectivities arising from the gold-coated and uncoated regions of the sample can be clearly observed. The reflectance map also reveals variation between individual steps arising from differences in the efficiency of coupling radiation back into the laser cavity. This is attributed to variations in the surface geometry arising from the wet etching process, which results in differing reflections of the THz beam.
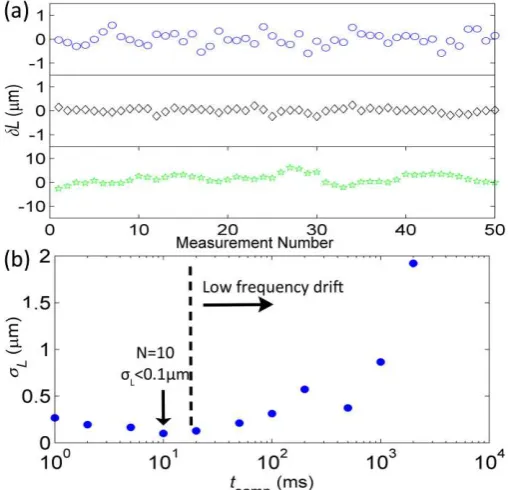
The depth resolution of our system is influenced by voltage noise in the SM waveforms, which can be reduced through averaging, and also by frequency instability of the laser, caused by temperature and current fluctuations. Thermal drift, in particular, can result in frequency drifts on the order of several MHz over time-scale of seconds [20, 21]. In our system the ±100 mK instability of the heat-sink temperature corresponds to a maximum frequency drift of ~10 MHz. To quantify these effects, 50 SM waveforms were acquired in succession and the cavity length determined in each case. This was performed for varying degrees of waveform averaging, with typical results being shown in
Fig. 3(a) for
N
= 1, 10, and 2000 averages per measurement. From these measurements thestandard deviation L of the measured cavity lengths can be obtained and interpreted as an estimate
of the depth resolution of the system, which can then be related to the sampling time per pixel
t
samp asshown in Fig. 3(b). As can be seen, for short sampling times <10 ms, greater averaging results in a reduction of L, with a minimum resolution of <0.1 m (corresponding to a phase change ~0.6°) achieved. As the sampling time increases beyond this, however, low frequency drift of the laser emission frequency degrades the depth resolution. Such effects could, in principle, be compensated through use of a common-path interferometer geometry with a fixed reference path.
Fig. 3. (a) 50 successive measurements of sample depth showing variation due to voltage noise and frequency drift, for N = 1 (top), 10 (middle), and 2000 (bottom) waveform averages per measurement. (b) Depth resolution L
determined from the standard deviation of repeated depth measurements, plotted as a function of sampling time per pixel, tsamp.
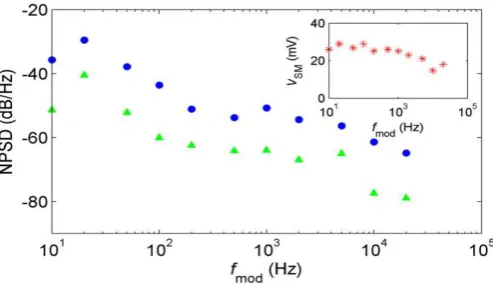
By eliminating mechanical modulation in our system, significantly greater modulation frequencies can be employed. Figure 4 shows the measured noise power spectral density (NPSD) relative to the signal power, as determined from the magnitude of the FFT of the SM waveforms recorded at different modulation frequencies. Also shown is the noise contribution measured without optical feedback to the laser (i.e. no SM), which arises from laser driver current noise that translates to laser voltage noise. Under feedback, a greater NPSD is observed, which decreases with increasing frequency, approximately as ~1/f2 below ~200 Hz. We attribute this larger noise contribution to
[image:5.595.170.425.348.593.2]5
> 10 kHz, corresponding to sampling times tsamp < 1 ms/pixel, the NPSD decreases to < −60 dB/Hz. It
should be noted that the modulation frequency is limited in our system by the current driver, although we anticipate that shorter sampling times and lower NPSDs could readily be achieved through faster modulation.
In conclusion, we have reported coherent 3D imaging using a THz QCL in a swept-frequency SM scheme. This technique eliminates the need for mechanical longitudinal scanning of the target, thereby enabling significantly faster acquisition rates. We have demonstrated this scheme for coherent imaging of exemplar structures with a depth resolution of better than 0.1 m for a sampling time of 10 ms/pixel.
[image:6.595.177.424.266.408.2]The authors thank Siddhant Chowdhury for fabrication of the semiconductor structures. The authors acknowledge support from the EPSRC (UK), the ERC “TOSCA” programme, the Royal Society and the Wolfson Foundation, and the European Cooperation in Science and Technology (COST) Action BM1205. This research was supported under Australian Research Council's Discovery Projects funding scheme (DP 120 103703). YLL acknowledges support under the Queensland Government's Smart Futures Fellowships programme.
6 References
1. R. Kohler, A. Tredicucci, F. Beltram, H. E. Beere, E. H. Linfield, A. G. Davies, D. A. Ritchie, R. C.
Iotti, and F. Rossi, Nature , 156 (2002).
2. P. Dean, A. Valavanis, J. Keeley, K. Bertling, Y. L. Lim, R. Alhathlool, A. D. Burnett, L. H. Li,
D. Indjin, T. Taimre, A. D. Rakić, E. H. Linfield, and A. G. Davies, J. Phys. D: Appl. Phys. , 374008 (2014).
3. L. H. Li, L. Chen, J. Zhu, J. Freeman, P. Dean, Valavanis, A. G. Davies, and E. H. Linfield,
Elec. Lett. , 4, 309 (2014).
4. G. Scalari, C. Walther, M. Fischer, R. Terazzi, H. E. Beere, D. A. Ritchie, and J. Faist,
Laser&Photon. Rev. 3, 45 (2008).
5. C. W. I. Chan, Q. Hu, and J. L. Reno, Appl. Phys. Lett. 151108 (2012).
6. M. S. Vitiello, L. Consolino, S. Bartalini, A. Taschin, Tredicucci, M. Inguscio, andP. D. Natale,
Nature Photon. 6, 525 (2012).
7. S. Barbieri, P. Gellie, G. Santarelli, L. Ding, W. Maineult, C. Sirtori, R. Colombelli, H. Beere, and D. Ritchie, Nature Photon. 4, 636 (2010).
8. M. Ravaro, V. Jagtap, G. Santarelli, C. Sirtori, L. H. Li, S. P. Khanna, E. H. Linfield, and S.
Barbieri, Appl. Phys. Lett. , 091107 (2013).
9. P. Dean, A. Valavanis, J. Keeley, K. Bertling, Y. L. Lim, R. Alhathlool,, S. Chowdhury, T.
Taimre, L. H. Li, D. Indjin, S. Wilson, A. D. Rakić, E. H. Linfield, and A. G. Davies, Appl.
Phys. Lett. , 181112 (2013).
10. A. D. Rakić, T. Taimre, K. Bertling, Y. L. Lim, P. Dean, D. Indjin, Z. Ikonić, P. Harrison,
A. Valavanis, S. P. Khanna, M. Lachab, S. J. Wilson, E. H. Linfield, and A. G. Davies, Opt. Express , 22194 (2013).
11. H. S. Lui, T. Taimre, Y. L. Lim, K. Bertling, P. Dean, S. P. Khanna, M. Lachab, A. Valavanis, D.
Indjin, E. H. Linfield, A. G. Davies, and A. D. Rakić, Opt. Lett. , 2629 (2014).
12. A. A. Danylov, T. M. Goyette, J. Waldman, J. Coulombe, A. J. Gatesman, R. H. Giles, X. Qian,
Chandrayan, S. Vangala, K. Termkoa, W. D. Goodhue, and W. E. Nixon, Opt. Express , 16264 (2010).
13. S. Donati, Electro-Optical Instrumentation: Sensing and Measuring With Lasers (Prentice Hall,
New Jersey, 2004).
14. P. Dean, Y. L. Lim, A. Valavanis, R. Kliese, M. Nikolić, S. P. Khanna, M. Lachab, D. Indjin, Z.
Ikonić, P. Harrison, A. D. Rakić, E. H. Linfield, and A. G. Davies, Opt. Lett. , 2587 (2011).
15. P. Gellie, S. Barbieri, J. Lampin, P. Filloux, C. Manquest, C. Sirtori, I. Sagnes, S. P. Khanna, E.
H. Linfield, A. G. Davies, H. E. Beere, and D. Ritchie, Opt. Express 18, , 20799 (2010).
16. R. Chinn, E. A. Swanson, and J. G. Fujimoto, Opt. Lett. , 340 (1997)
17. S. Barbieri, J. Alton, H. E. Beere, J. Fowler, E. H. Linfield, and D. A. Ritchie, Appl. Phys. Lett. , 1674 (2004).
18. M. Wang and G. Lai, Optics Comms. , 237 (2004).
19. R. Kliese, T. Taimre, A. A. A. Bakar, Y. L. Lim, K. Bertling, M. Nikolić, J. Perchoux, T. Bosch, and
A. D. Rakić, Appl. Opt, , 17, 3723 (2014).
20. A. Barkan, F. K. Tittel, D. M. Mittleman, R. Dengler, P. H. Siegel, G. Scalari, L. Ajili, J. Faist, H.
E. Beere, E. H. Linfield, A. G. Davies, and D. A. Ritchie, Opt. Lett. 575 (2004).