The blue supergiant MN18 and its bipolar circumstellar nebula
V. V. Gvaramadze,
1,2,3‹A. Y. Kniazev,
1,4,5J. M. Bestenlehner,
6,7J. Bodensteiner,
8,9N. Langer,
6J. Greiner,
9E. K. Grebel,
10L. N. Berdnikov
1,3,11and Y. Beletsky
121Sternberg Astronomical Institute, Lomonosov Moscow State University, Universitetskij Pr. 13, Moscow 119992, Russia 2Space Research Institute, Russian Academy of Sciences, Profsoyuznaya 84/32, Moscow 117997, Russia
3Isaac Newton Institute of Chile, Moscow Branch, Universitetskij Pr. 13, Moscow 119992, Russia 4South African Astronomical Observatory, PO Box 9, 7935 Observatory, Cape Town, South Africa 5Southern African Large Telescope Foundation, PO Box 9, 7935 Observatory, Cape Town, South Africa 6Argelander-Institut f¨ur Astronomie der Universit¨at Bonn, Auf dem H¨ugel 71, D-53121 Bonn, Germany 7Max-Planck Institute for Astronomy, D-69117 Heidelberg, Germany
8Physik Department, Technische Universit¨at M¨unchen, James-Franck-Str., D-85748 Garching, Germany 9Max-Planck-Institut f¨ur extraterrestrische Physik, Giessenbachstraße 1, D-85748 Garching, Germany
10Astronomisches Rechen-Institut, Zentrum f¨ur Astronomie der Universit¨at Heidelberg, M¨onchhofstr. 12–14, D-69120 Heidelberg, Germany 11Astronomy and Astrophysics Research division, Entoto Observatory and Research Center, P.O. Box 8412, Addis Ababa, Ethiopia 12Las Campanas Observatory, Carnegie Institution of Washington, Colina el Pino, Casilla 601 La Serena, Chile
Accepted 2015 August 25. Received 2015 August 24; in original form 2015 July 7
A B S T R A C T
We report the results of spectrophotometric observations of the massive star MN18 revealed via discovery of a bipolar nebula around it with theSpitzer Space Telescope. Using the optical spectrum obtained with the Southern African Large Telescope, we classify this star as B1 Ia. The evolved status of MN18 is supported by the detection of nitrogen overabundance in the nebula, which implies that it is composed of processed material ejected by the star. We analysed the spectrum of MN18 by using the codeCMFGEN, obtaining a stellar effective temperature of ≈21 kK. The star is highly reddened, E(B−V)≈2 mag. Adopting an absolute visual magnitude of MV = −6.8 ± 0.5 (typical of B1 supergiants), MN18 has a luminosity of logL/L≈5.42±0.30, a mass-loss rate of≈(2.8−4.5)×10−7 Myr−1, and resides at a distance of≈5.6+−11..52kpc. We discuss the origin of the nebula around MN18 and compare it with similar nebulae produced by other blue supergiants in the Galaxy (Sher 25, HD 168625, [SBW2007] 1) and the Large Magellanic Cloud (Sk−69◦202). The nitrogen abundances in these nebulae imply that blue supergiants can produce them from the main-sequence stage up to the pre-supernova stage. We also present aK-band spectrum of the candidate luminous blue variable MN56 (encircled by a ring-like nebula) and report the discovery of an OB star at≈17 arcsec from MN18. The possible membership of MN18 and the OB star of the star cluster Lynga 3 is discussed.
Key words: circumstellar matter – stars: individual: [GKF2010] MN18 – stars: individual: [GKF2010] MN56 – stars: individual: [GKF2010] MN109 – supergiants – stars: winds, out-flows – open clusters and associations: individual: Lynga 3.
1 I N T R O D U C T I O N
Massive stars change their mass-loss rate, and the velocity, symme-try and composition of their copious winds in the course of their evo-lution. The mass-loss along with stellar rotation and magnetic fields, and effects of binarity (various modes of mass transfer between bi-nary components, mergers of the components, common-envelope ejection) result in the formation of different types of circumstellar
E-mail:[email protected]
nebulae, of which the hourglass-like type is most spectacular. The first and the best-known example of such a nebula associated with a massive star is that created by the Large Magellanic Cloud (LMC) B-type supergiant Sk−69◦202 – the progenitor of the SN 1987A (Burrows et al.1995; Plait et al.1995). Later, a number of Galac-tic analogues of this nebula were discovered around the already known blue supergiants – the candidate luminous blue variables (cLBVs) Sher 25 (Brandner et al.1997a), HD 168625 (Smith2007) and MWC 349A (Gvaramadze & Menten2012), and the newly identified blue supergiant [SBW2007] 1 (Smith, Bally & Walawender2007).
C
There is still no complete understanding on how and in which evolutionary phases massive stars form their circumstellar nebu-lae. The nebulae can definitely originate during the late and final (pre-supernova) phases, as evidenced by the detection of numer-ous compact shells of processed material around Wolf–Rayet stars (e.g. Chu, Treffers & Kwitter 1983; Esteban et al.1992; Dopita et al.1994; Marston1995; Stock, Barlow & Wesson2011) and the three-ring nebula associated with the SN 1987A. Under proper con-ditions, compact shells could form around red supergiants (Mackey et al.2014), which unlike the shells around Wolf–Rayet stars could exist until their central stars explode as supernovae. The majority of candidate and bona fide LBVs are also associated with com-pact circular or bipolar nebulae (Nota et al.1995; Clark, Larionov & Arkharov2005; Kniazev, Gvaramadze & Berdnikov2015) and there is evidence that some of these stars might be the immediate precursors of supernovae (e.g. Kotak & Vink2006; Groh, Meynet & Ekstr¨om2013; Justham, Podsiadlowski & Vink2014). On the other hand, the analysis of the heavy element abundances in cir-cumstellar nebulae around several LBVs by Lamers et al. (2001) led them to suggest that these nebulae were created at the end of the main sequence. Similarly, it was argued that enhanced mass-loss at the beginning of the blue supergiant phase was responsible for the origin of the bipolar nebula around the cLBV Sher 25 (Smartt et al.2002; Hendry et al.2008) and a multishell nebula associated with the late O-type supergiant TYC 3159-6-1 (Gvaramadze et al.
2014a). Which of the evolutionary phases are more prone to produce circumstellar nebulae in general and the bipolar ones in particular still needs to be determined. Clarifying this point is important for estimating the production rate of different types of nebulae and for the comprehension of the mechanisms responsible for their origin. A large number of models have been proposed to explain the for-mation of bipolar nebulae. The vast majority of them assume that the spherically symmetric stellar wind is collimated by a disc-like (equatorial) circumstellar environment, whose origin and geometry could be attributed to either an asymmetric mass-loss during the pre-ceding stellar evolutionary phase (e.g. Blondin & Lundqvist1993; Frank, Balick & Davidson1995; Martin & Arnett1995; Langer, Gar´ıa-Segura & Mac Low1999) or to various binary interaction processes (e.g. Fabian & Hansen1979; Morris1981; Mastrodemos & Morris1999; Morris & Podsiadlowski2009). In some models, the stellar wind is considered to be intrinsically bipolar, e.g. because of nearly critical stellar rotation (Owocki & Gayley1997; Maeder & Desjacques2001; Chita et al.2008). It is quite likely that sev-eral mechanisms for shaping bipolar nebulae could be at work. The detection of new examples of bipolar outflows from massive stars might be essential for the identification of relevant mechanisms for their origin as well as for a better understanding at which stellar evolutionary phase(s) these mechanisms start to operate.
In our search for compact mid-infrared nebulae in the archival data of theSpitzer Space Telescope(for the motivation and some results of this search, see Gvaramadze et al.2009,2010a,b,2014b; Gvaramadze, Kniazev & Fabrika2010c, hereafterPaper I), we de-tected two striking examples of hourglass-like nebulae, which were presented for the first time and named MN13 and MN181inPaper I
(see table 1 and figs 3 and 10 there). MN18 and its central star (in the following, we will use the name MN18 only for the star) are the sub-ject of this paper and presented in Section 2. Section 3 describes our spectroscopic and photometric observations of MN18. The spectral
1In the Set of Identifications, Measurements and Bibliography for
Astronomical Data (SIMBAD) data base these shells are named [GKF2010] MN13 and [GKF2010] MN18.
classification of MN18 is given in Section 4, where we also de-termine the fundamental parameters of this star using the radiative transfer codeCMFGENand estimate its luminosity. Spectroscopy of
the nebula is discussed in Section 5. In Section 6, we discuss the origin of bipolar nebulae around evolved massive stars and compare the nebula around MN18 with other similar bipolar nebulae. The possible parent cluster of MN18 is discussed in Section 6 as well. We summarize in Section 7.
2 M N 1 8 A N D I T S B I P O L A R N E B U L A
The blue supergiant MN18 is one of many dozens of evolved mas-sive stars revealed through the detection of their circumstellar neb-ulae with theSpitzer Space Telescope(see table 1 inPaper I). The bipolar nebula around MN18 was discovered in archival 24 µm data obtained with the Multiband Imaging Photometer forSpitzer
(MIPS; Rieke et al.2004) within the framework of the 24 and 70 Micron Survey of the Inner Galactic Disk with MIPS (Carey et al.
2009). This nebula appears as two lobes protruding for about 70 arc-sec in the north-west and south-east directions from a bright waist centred on MN18. At a distance ofd=5.6 kpc (see Section 4), the linear extent of the lobes is≈1.9 pc.
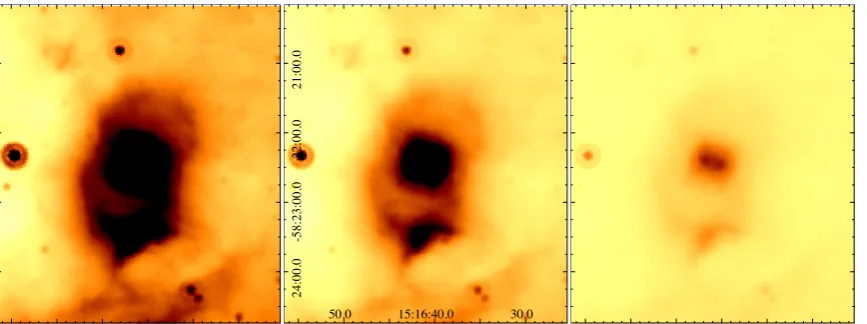
Fig. 1shows the nebula in three different intensity scales to highlight some details of its structure. The low-intensity image of the waist of the nebula revealed two bright spots on each side of MN18 (the star itself is not visible at 24µm). We interpret these spots as cross-sections of a toroidal equatorial ring around the star visible nearly edge-on. The north-west lobe appears to be opened along the polar axis, while in the south-east lobe one can discern two incomplete ellipse-like filaments oriented plane parallel to the equatorial ring. These filaments are reminiscent of a polar ring associated with the cLBV HD 168625 (see fig. 1d in Smith2007
and fig. 2n inPaper I), but both are located on the same side of the torus. Assuming rotational symmetry for the nebula, the aspect ratios of the filaments suggest that the nebula is inclined with respect to the plane of sky by≈30◦. Correspondingly, the inclination angle of the stellar rotational axis to our line of sight,i, is≈60◦. Fig.1
also shows a bright feature attached to the south-western edge of the south-east lobe. A possible origin of this feature is discussed in Section 6.4.
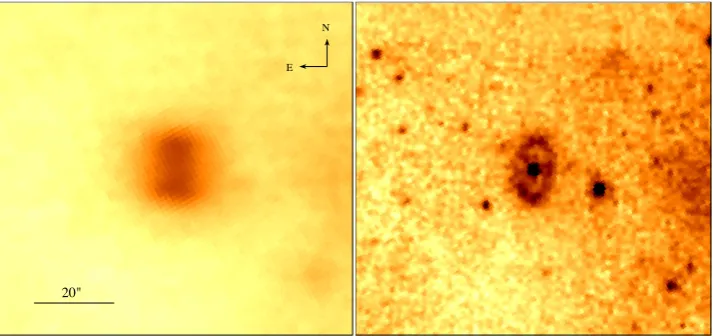
MN18 and its equatorial ring are clearly visible in all (3.6, 4.5, 5.8 and 8.0µm) images (see Fig.2) obtained with theSpitzerInfrared Array Camera (IRAC; Fazio et al.2004) within the Galactic Legacy Infrared Mid-Plane Survey Extraordinaire (GLIMPSE; Benjamin et al.2003). The north-east half of the ring is≈20 per cent brighter than the south-west one. The semimajor and semiminor axes of the nebula are≈11 and 4.5 arcsec, respectively. Ford=5.6 kpc, the linear radius of the waist is≈0.29 pc. The 8µm image also shows a ‘horn’ at the north-east edge of the equatorial ring, which might correspond to the beginning of the north-west lobe. Similar horns could also be seen in the IRAC images of the equatorial rings of the cLBVs Sher 25 and MN56 (see, respectively, figs 2l and 4 inPaper I).
The IRAC images of the waist of the bipolar nebula were pre-sented for the first time by Kwok et al. (2008), who classified it as a planetary nebula (PN) and named PNG 321.0−00.7.2Kwok et al.
2Anderson et al. (2012) used mid- and far-infrared colours of
Figure 1. SpitzerMIPS 24µm image of the bipolar nebula around MN18 at three intensity scales, highlighting various details of its structure. The coordinates are in units of RA (J2000) and Dec. (J2000) on the horizontal and vertical scales, respectively. At an adopted distance of 5.6 kpc, 1 arcmin corresponds to
[image:3.595.80.512.272.503.2]≈1.6 pc.
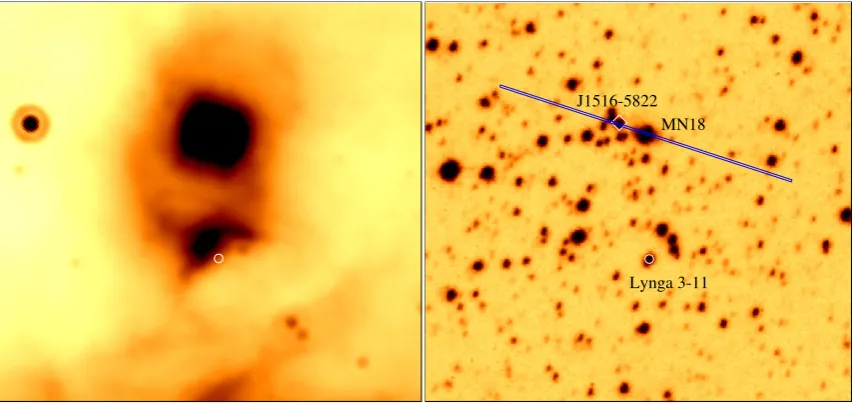
Figure 2. From left to right, and from top to bottom:SpitzerMIPS 24µm, IRAC 8, 5.8, 4.5 and 3.6µm, and SHS Hα+[NII] images of the equatorial ring around MN18. MN18 and several stars around it were proposed by Lynga (1964a) to be members of the same star cluster (see Section 6.4 for more details).
(2008) also noted that PNG 321.0−00.7 has an optical counterpart in the SuperCOSMOS H-alpha Survey (SHS; Parker et al.2005), but did not show its image. Fig. 10 inPaper Ipresented the SHS Hα+[NII] image of the waist for the first time (see also Fig.2).
InPaper I, we provisionally classified MN18 as an early B su-pergiant, using a spectrum obtained with the 1.9 m telescope of the South African Astronomical Observatory (SAAO; see Section 3.1). Our subsequent spectroscopy with the Southern African Large Tele-scope (SALT) allowed us to refine this classification to B1 Ia (see Section 4.1).
The details of MN18 are summarized in Table1. TheBV Ic
magni-tudes are the mean values derived from our five CCD measurements listed in Table3. The coordinates and theJHKsphotometry are taken
from the Two-Micron All Sky Survey (2MASS) All-Sky Catalog of Point Sources (Cutri et al.2003). The IRAC photometry is from the GLIMPSE Source Catalog (I+II+3D) (Spitzer Science Center
2009).
Table 1. Details of MN18.
Spectral type B1 Ia
RA(J2000) 15h16m41.s01 Dec.(J2000) −58◦2226.0
l 321◦.0239
b −0.◦6992
B(mag) 15.34±0.01
V(mag) 13.40±0.01
Ic(mag) 10.91±0.01
J(mag) 9.22±0.02
H(mag) 8.72±0.02
Ks(mag) 8.38±0.02
[3.6] (mag) 8.02±0.04
[4.5] (mag) 7.99±0.06
[5.8] (mag) 7.88±0.05
[image:3.595.351.507.564.722.2]Table 2. Journal of the observations.
Spectrograph Date Exposure Spectral scale Spatial scale Slit Spectral range (min) (Å pixel−1) (arcsec pixel−1) (arcsec) (Å)
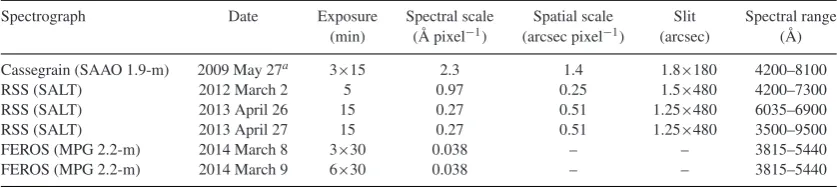
Cassegrain (SAAO 1.9-m) 2009 May 27a 3×15 2.3 1.4 1.8×180 4200–8100
RSS (SALT) 2012 March 2 5 0.97 0.25 1.5×480 4200–7300
RSS (SALT) 2013 April 26 15 0.27 0.51 1.25×480 6035–6900
RSS (SALT) 2013 April 27 15 0.27 0.51 1.25×480 3500–9500
FEROS (MPG 2.2-m) 2014 March 8 3×30 0.038 – – 3815–5440
FEROS (MPG 2.2-m) 2014 March 9 6×30 0.038 – – 3815–5440
Note.aPresented for the first time inPaper I.
MN18 is one of the 25 stars with V < 15 mag, which were suggested by Lynga (1964a) to be members of the open star cluster Ly 3, called Lynga 3 in the SIMBAD3and WEBDA4(Mermilliod 1995) data bases. MN18 has the sequence number 22 in table V of Lynga (1964a), which gives photographicBandVmagnitudes of 15.6 and 13.3, respectively, for this star. The relationship between MN18 and Lynga 3 is further discussed in Section 6.4.
3 M N 1 8 : O B S E RVAT I O N S
3.1 Spectroscopic observations
The first spectrum of MN18 was obtained with the SAAO 1.9 m telescope on 2009 May 27. The observations were performed with the Cassegrain spectrograph using a slit of 3 arcmin×1.8 arcsec and grating with 300 lines mm−1. The slit was oriented at a
po-sition angle (PA) of PA=80◦, measured from north to east. This spectral setup covered a wavelength range of≈4200–8100 Å with a reciprocal dispersion of≈2.3 Å pixel−1and a spectral resolution full width at half-maximum (FWHM) of≈7 Å. Three exposures of 900 s were taken with a seeing of≈2 arcsec.
The obtained spectrum (see fig. 9 ofPaper I) revealed numerous H and HeIlines in absorption and prominent nebular emissions –
the Hαline flanked by the [NII]λλ6548, 6584 lines. Unfortunately,
the stellar and the nebular spectra were too weak to allow us to obtain a reliable spectral classification of MN18 and to derive any useful information on the nebula.
To classify MN18 and to study the nebula, we obtained a new spectrum (we call it low-resolution hereafter) with the SALT (Buckley, Swart & Meiring2006; O’Donoghue et al.2006) on 2012 March 2, using the Robert Stobie Spectrograph (RSS; Burgh et al.
2003; Kobulnicky et al.2003) in the long-slit mode with a slit of 8 arcmin×1.5 arcsec. The slit was oriented along the major axis of the optical nebula, i.e. at PA=72◦. The PG900 grating was used to cover the spectral range of 4200–7300 Å with a final reciprocal dispersion of 0.97 Å pixel−1(FWHM≈5.50 Å). A 300 s spectrum
was taken with 2×2 binning. The RSS uses a mosaic of three 2048×4096 CCDs and the final spatial scale for this observation was 0.25 arcsec pixel−1. The seeing during the observation was
≈1.3 arcsec. A Xe lamp arc spectrum was taken immediately after the science frame. A spectrophotometric standard star was observed during twilight time for relative flux calibration.
To study the velocity distribution along the optical nebula, two additional higher resolution long-slit spectra (high-resolution spec-tra hereafter) were obtained with the RSS using the grating PG2300
3http://simbad.u-strasbg.fr/simbad/ 4http://webda.physics.muni.cz/
on 2013 April 26 and 27. A slit with a width of 1.25 arcsec was used in both observations with the same PA as earlier. A spectral range of 6035–6900 Å was covered with a final reciprocal dispersion of 0.27 Å pixel−1and a FWHM spectral resolution of 1.33 Å. One
900 s spectrum was taken with a 2×4 binning each night with a spatial scale of 0.51 arcsec pixel−1along the slit. The seeing during
the observations was 1.5 arcsec. A Ne lamp arc spectrum and a set of quartz tungsten halogen flats were taken immediately after the sci-ence frames, and a spectrophotometric standard star was observed during twilight time for relative flux calibration.
The primary reduction of the SALT data was carried out with the SALT science pipeline (Crawford et al.2010). After that, the bias and gain corrected and mosaicked long-slit data were reduced in the way described in Kniazev et al. (2008). Absolute flux calibration is not feasible with SALT because the unfilled entrance pupil of the telescope moves during the observation. However, a relative flux correction to recover the spectral shape was done using the observed spectrophotometric standard.
For spectral modelling and to derive the rotational velocity, we obtained high-resolution spectra of MN18 with the 2.2-m Max Planck Gesellschaft telescope at La Silla (European Southern Ob-servatory; ESO). The data were taken on 2014 March 8 and 9 with the Fibre-fed Extended Range Optical Spectrograph (FEROS; Kaufer et al.1999) – a high-resolution ´Echelle spectrograph with an aperture of 2 arcsec, which provides a resolution of 0.038 Å pixel−1.
A 2048×4096 CCD was used to record 39 orders covering the spectral range of 3500–9500 Å. Nine 1800 s exposures were ob-tained, of which three were taken during the first night. The seeing during the observation was below 1.5 arcsec in both nights. Wave-length calibration frames were obtained with ThArNe lamps. A spectrophotometric standard star was observed directly before the target observation in order to perform a flux calibration.
The reduction of the FEROS data, including flat-field correction, bias and background subtraction, order tracing, wavelength and flux calibration, was performed manually with the FEROS Data Reduction Software based onESO-MIDAS.
The log of our spectroscopic observations is listed in Table2.
3.2 Photometry
To detect possible photometric variability of MN18, we determined itsB,VandIcmagnitudes on CCD frames obtained with the 76 cm
telescope of the SAAO during our five observing runs in 2009– 2014. We used an SBIG ST-10XME CCD camera equipped with
Table 3. Photometry of MN 18.
Date B V Ic
1963 April 4–17a 15.46±0.25 13.28±0.21 –
2009 May 27b – 13.35±0.03 –
2010 January 22c 15.36±0.01 13.42±0.01 10.94±0.01
2012 March 2d – 13.33±0.04 –
2012 May 6c 15.30±0.01 13.36±0.01 10.87±0.01 2013 January 13c 15.34±0.01 13.41±0.01 10.90±0.01
2013 April 26d – 13.44±0.04 –
2014 January 18c 15.33±0.02 13.43±0.01 10.92±0.01 2014 April 8c 15.38±0.02 13.41±0.02 10.94±0.02
Notes.aLynga (1964a);b1.9 m telescope;c76 cm telescope;dSALT.
this we used secondary photometric standards calibrated with the 76-cm telescope data. Using the same data, we also recalibrated the photographicBandVmagnitudes of MN18 from Lynga (1964a). The resulting photometry is presented in Table3.
From Table3it follows that MN18 did not experience major changes in its brightness: during the last five years itsB,VandIc
magnitudes changed by0.1 mag, while its B− Vand B− Ic
colours remained almost constant with mean values of 1.94±0.01 and 4.43±0.01 mag, respectively.
4 M N 1 8 : S P E C T R A L A N A LY S I S A N D S T E L L A R PA R A M E T E R S
4.1 Classification of MN18 and changes in the Hαline
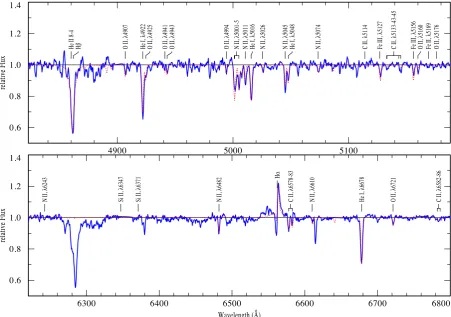
The normalized low- and high-resolution SALT spectra of MN18 are presented in Fig.3, with the principal lines and most
promi-Table 4. EWs, FWHMs and RVs of main lines in the low-resolution spec-trum of MN18.
λ0(Å) Ion EW(λ) FWHM(λ) RV
(Å) (Å) ( km s−1)
4340 Hγ 1.61±0.04 8.68±0.41 −55±9
4388 HeI 0.26±0.02 8.46±0.67 −22±8
4471 HeI 0.94±0.04 7.03±0.36 −51±8
4481 MgII 0.18±0.02 5.33±0.90 2±8
4553 SiIII 0.56±0.02 6.34±0.23 −63±8
4713 HeI 0.18±0.01 4.85±0.21 −11±8
4861 Hβ 1.61±0.05 9.19±0.31 −48±8
4922 HeI 0.59±0.01 6.40±0.17 −37±7
5045 NII 0.31±0.01 8.85±0.39 −44±7
5667 NII 0.53±0.02 8.13±0.18 −68±6
5680 NII 0.82±0.02 8.13±0.18 −104±6 5740 SiIII 0.67±0.01 7.30±0.17 −34±6
5876 HeI 0.90±0.02 6.91±0.17 −78±6
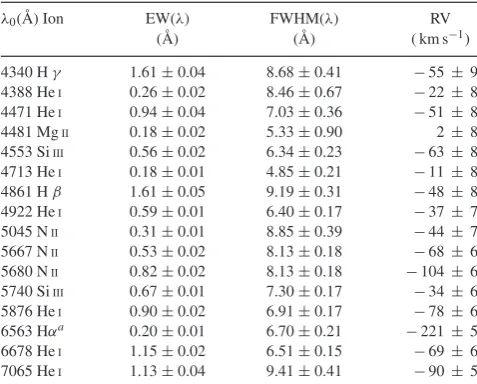
6563 Hαa 0.20±0.01 6.70±0.21 −221±5
6678 HeI 1.15±0.02 6.51±0.15 −69±6
7065 HeI 1.13±0.04 9.41±0.41 −90±5
Note.aThe RV of this line is noticeably affected by the P Cygni absorption.
nent diffuse interstellar bands (DIBs) indicated. All wavelengths are given in air. Equivalent widths (EWs), FWHMs and heliocen-tric radial velocities (RVs) of the main lines in the low-resolution spectrum (measured applying theMIDASprograms; see Kniazev et al. 2004for details) are summarized in Table4.
Fig.3shows that the spectrum of MN18 is dominated by ab-sorption lines of H and HeI. In the high-resolution spectrum the
Hαline is in emission and shows a P Cygni profile. Other promi-nent absorption lines are those of NIIλλ5001-5, 5045, 5667, 5680,
6380, 6482, OIIλλ4350, 4415-17, 4640-50, 6721, MgIλ4471, SiIII
[image:5.595.309.548.82.274.2]λλ4553-68-75, 4650, 5740, and CIIλλ6578, 6583. No HeIIlines
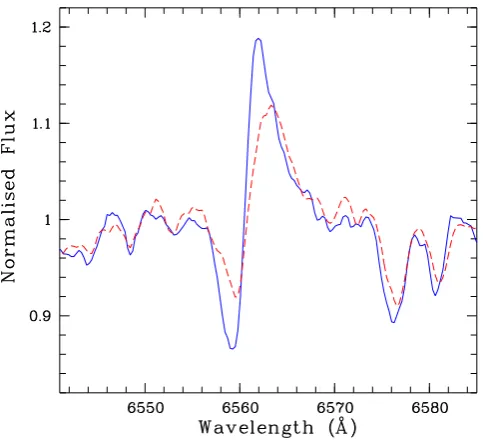
[image:5.595.96.507.432.704.2]Figure 4. Daily time-scale line profile variability in Hαand the CIIλλ6578, 6583 doublet: 2013 April 26 (solid line) and 2013 April 27 (dashed line).
are present in the spectrum, which implies that MN18 is of spectral type of B1 or later (Walborn & Fitzpatrick1990).
Using the spectral atlas of OB stars by Walborn & Fitzpatrick (1990), we classify MN18 as a B1 Ia star. The Ia luminosity class also follows from the measured EW(Hγ) of 1.61±0.04 Å and the calibrations of Balona & Crampton (1974; see their table V).
The high interstellar extinction towards MN18 (see Sections 4.2 and 5.1) is manifested in numerous DIBs, the most prominent of which are at 4429, 4762, 4881, 5780, 5797, 6203, 6269, 6283 and 6614 Å.
Inspection of the spectra of MN18 obtained in 2009–2014 did not reveal significant changes in their appearance, except for the variability of the Hαline. It was in emission in 2009 and 2013, in absorption in 2012, and in transition between these two states in 2014, with the line centre in absorption and the line wings in emis-sion. Comparison of the SALT high-resolution spectra obtained during two consecutive nights in 2013 shows that the Hαline (and the CIIλλ6578, 6583 doublet as well) changes its shape on a daily
time-scale (see Fig.4), which is typical of early-type supergiants (e.g. Morel et al.2004; Martins et al.2015). This variability intro-duces an ambiguity in mass-loss estimates based on synthesizing the Hαline with model stellar atmosphere codes (see Section 4.2). Using the 1.9 m telescope and SALT spectra, we searched for shifts in RV as a result of possible binarity of MN18 and found that all measurements agree with each other within their error margins.
4.2 Spectral modelling
For the spectral analysis we used spectra from three epochs: the low- and high-resolution SALT spectra taken on 2012 March 2 and 2013 April 27, respectively, and the echelle FEROS spectrum taken on 2014 March 9. Our analysis is based on synthetic spectra computed with the non-LTE stellar atmosphere codeCMFGEN(Hillier
& Miller1998). The following model atoms and ions were taken into account: HI, HeI–II, CI–IV, NIII–V, OI–V, MgII, AlII, SiII–IV
and FeI–V. Because we are mainly interested in the evolutionary
status of MN18, we varied only the abundances of He, C, N and O, while the abundances of other metals are set at solar values (taken
from Asplund et al.2009). Since our spectra did not cover the UV resonance lines, we cannot resolve the degeneracy between the wind velocity law,β, and a wind volume filling factor of optically thin (micro) clumps,fv. Similar line profiles for Hαcan be achieved by
varyingβand/orfv. Based on our model computations,βranges
between 1.5 and 2.5, and fv between 0.25 and 1.0. In order to
estimate the error bars in the effective temperature,Teff, mass-loss
rate, ˙M, and surface gravity, logg, we computed a grid of models around the preferred values. The best-fitting model is shown in Fig.5.
Teffis based on the ratio of the FeIIandIIIlines and the intensity
of the HeI, NIIand SiIIones, and is 21.1±1.0 kK. We employed
Hβto determine logg= 2.75± 0.20. The uncertainty of logg
is rather large as a result of low signal-to-noise ratio (S/N) in the FEROS and low resolution in the SALT spectra. The terminal ve-locity,v∞, is difficult to constrain due to the weak emission of
Hα. No other suitable lines are available in the covered wavelength range. Therefore, the uncertainty is large and we estimatev∞ of
≈1400± 500 km s−1. For comparison, we used the relation
be-tweenv∞and the photospheric escape velocity,vesc, from Lamers,
Snow & Lindholm (1995), which forTeff=21.1 kK, logg=2.75
and the bolometric luminosity of log (L/L)=5.42 (see below) givesv∞/vesc=2.6 andv∞=1370±250 km s−1.
The mass-loss rates for the three epochs were derived from Hα. Over these epochs the profile of Hαchanged and, correspondingly,
˙
M as well. The obtained values for the individual epochs with log (L/L)=5.42,v∞=1400 km s−1,β=2.0 andfv=1.0 are
log( ˙M/Myr−1)= −6.38±0.255(2012 March 2),−6.17±0.25
(2013 April 27), and−6.37±0.25 (2014 March 9). We observe a variation of ˙Mby a factor of≈1.6. The errors in ˙Maccount for the uncertainties in log (L/L),v∞,β-parameter and microclumping. Petrov, Vink & Gr¨afener (2014) found that the optical depth of the Hαline below the bi-stability jump (Teff≈22.5 kK) increases with
decreasingTeff. Correspondingly, the profile of this line becomes
sensitive to macroclumping and the derived ˙Mcould be underesti-mated. However, the effective temperature of MN18 is close to that of the bi-stability jump, while thev∞/vescratio of 2.6 suggests that
MN18 has wind properties expected for a star on the hot side of this jump. Therefore, it appears likely that the influence of the macro-clumping on the mass-loss rate of MN18 is small, i.e. negligible in comparison to the overall uncertainties.
The CNO abundances are based on the ratio of the C, N and O spectral lines. Table5shows that C is reduced by a factor of≈3.5 and N is enriched by≈4 times due to the CNO cycle. The abundance of O is still close to its initial value within the error margins. At the given wavelength range the H and He lines are insensitive to changes in the He abundance, so that the He mass fraction could not be derived.
To estimate the reddening towards MN18, we match the model spectral energy distribution (SED) with the observed one in theB,
VandKsbands (see Table 1). We extracted intrinsic B−Vand
V−Kscolours from the model flux by applying approximate filter
functions6and match the resulting values of the colour excesses
E(B−V) andE(V−Ks) as described by Bestenlehner et al. (2011)
to determine the total-to-selective absorption ratioRVandV-band
extinctionAV. We derive log (L/L)= 5.42±0.2 adopting the
5This is an upper limit because the H
αline was in absorption in 2012.
6The filter functions were approximated for each filter system individually
Figure 5. Parts of the normalized FEROS (upper panel) and high-resolution SALT (bottom panel) spectra of MN18 (shown by blue solid lines), compared with the best-fitting model spectrum (red dotted line) with the parameters as given in Table5.
Table 5. Stellar and extinction parameters for MN18.
Teff(kK) 21.1±1.0
log (L/L) 5.42±0.30
R∗( R) 38.5+18−12..57
logg 2.75±0.20
log( ˙M/Myr−1)a −6.38±0.25 log( ˙M/Myr−1)b −6.17±0.25 log( ˙M/Myr−1)c −6.37±0.25
β 1.5 to 2.5
fv 0.25 to 1.0
v∞( km s−1) 1400±500 veq( km s−1) 104±7
C (mass fraction) 6.5±2.5×10⁻⁴
N (mass fraction) 2.4+−12..13×10−3 O (mass fraction) 5.4+−12×10−3
E(B−V) (mag) 1.97±0.10
RV 3.26±0.10
MV(mag) (adopted) −6.8±0.5
d(kpc) 5.6+−11..52
Notes. a2012 March 2;b2013 April 27; c2014 March 9.
absolute visual magnitude ofMV= −6.8±0.5 typical of B Ia
supergiants (Crowther, Lennon & Walborn2006). Accounting for the uncertainty inTeff and photometric errors, the uncertainty in
log (L/L) sums up to ±0.3 dex. Even though we find a vari-ability in Hα, the temperature and bolometric correction (BC=
−2.01 mag7) are nearly unchanged, so that we can assume no
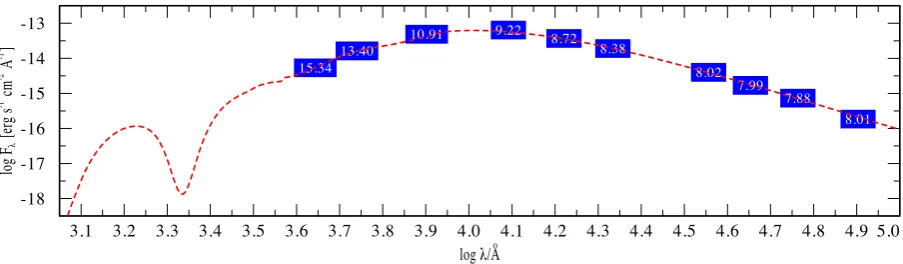
sig-nificant variations in the luminosity over time. The resulting SED well matches the photometry from optical to mid-infrared wave-lengths, and no infrared excess is observed (see Fig.6).
By converting the luminosity range into distances, we found that MN18 lies at a distance ofd≈5.6+−11..52kpc. The line of sight towards MN18 (l≈321◦) first crosses the Carina–Sagittarius Arm at≈0.7– 1.5 kpc and then the Crux–Scutum one at≈3.6–4.4 kpc (Vall´ee
2014). Our distance estimate implies that MN18 is located either in the Crux–Scutum Arm or in the interarm region. In Section 6.4, we argue that the former possibility is more plausible. Note that the luminosity of MN18 and itsR∗ and ˙M(given in Table5) can be scaled to different distances as ∝d2, ∝dand ∝d3/2, respectively
(Schmutz, Hamann & Wessolowski1989).
Using the FEROS spectra, we estimated the projected ro-tational velocity, vsini, of MN18. For this, we used the re-lations between the FWHMs of the HeI λλ4387, 4471 lines
and vsini given in Steele, Negueruela & Clark (1999). For FWHM(4388)=2.24±0.25 Å and FWHM(4471)=2.10±0.13 Å, we foundvsini≈94.1±10.5 km s−1and 86.6±5.4 km s−1,
re-spectively, with a mean value of 90.4 ± 5.9 km s−1, which for
i = 60◦ (see Section 2) translates into the equatorial rotational velocity ofveq=104±7 km s−1. These estimates should be
con-sidered as an upper limit to the rotational velocity because the macroturbulence could contribute to the line broadening.
7Note that almost the same value of BC (−2.03 mag) follows from relation
[image:7.595.88.242.443.656.2]Figure 6. Observed flux distribution of MN18 in absolute units, based on the photometric measurements (blue rectangles) compiled in Table1, compared to the emergent flux of the reddened model spectrum (red dashed line) with the parameters as given in Table5.
A summary of the stellar and extinction parameters is given in Table5.
5 S P E C T R O S C O P Y O F T H E E Q UAT O R I A L R I N G
5.1 Physical conditions and elemental abundances
As noted in Section 3.1, all SALT spectra were obtained with the slit oriented along the major axis of the equatorial nebula. In two-dimensional (2D) spectra the nebula appears as emission lines of Hβ, Hα, [NII]λλ6548, 6584 and [SII]λλ6717, 6731, visible on
both sides of MN18. Note that in the region of the Hαline the nebula is more than 5 mag fainter than the star and therefore it does not affect the stellar photometry appreciably. A part of one of the two 2D high-resolution spectra is shown in Fig.7. Besides the nebular spectrum and the spectrum of MN18, Fig.7also shows spectra of two other stars on the RSS slit, which are located at almost equal distances on both sides of MN18. In Section 6.4 we show that the brighter star is of late O-/early B-type.
The upper and bottom panels of Fig.8plot the nebular emis-sion line intensities and their ratios along the slit. From the upper panel it follows that the nebula can be traced up to±11 arcsec (at a 10 per cent level of the Hαpeak intensity) from MN18, which corresponds with the extent of the equatorial ring in theSpitzerand SHS images (see Fig.2). This panel also shows that the line inten-sities peak at≈8.5 arcsec from the star, which reflects the toroidal topology of the nebula.
The lower panel of Fig.8shows that the [NII]λ6584/Hαline
[image:8.595.309.542.414.655.2]ratio increases with distance from MN18 and peaks at the edge of
Figure 7. A part of the 2D high-resolution spectrum of the equatorial ring around MN18, showing nebular emission lines (from left to right) of [NII]
λ6548, Hα, [NII]λ6548 and [SII]λλ6717, 6731.
the nebula. Using the prescription by Dopita (1973), one finds that [NII]/Hαis proportional ton−e1Te1/2exp(−21 855/Te), whereneand
Te are the electron number density and temperature, respectively.
Thus, the behaviour of [NII]λ6584/Hαcould be explained (at least
in part) by the temperature increase of the photoionized gas towards the outer edge of the nebula (caused by the hardening of the ionizing radiation field), provided that the density is constant throughout the nebula.
One-dimensional (1D) spectra of the nebula were extracted by summing up, without any weighting, all rows from the area of an annulus with an outer radius of 10 arcsec centred on MN18 and the central±3 arcsec excluded. Both low- and high-resolution 1D spectra of the nebula are presented in Fig.9. The emission lines de-tected in the spectra were measured using the programs described in Kniazev et al. (2004). Table6lists the observed intensities of these lines normalized to Hβ,F(λ)/F(Hβ), the reddening-corrected line
Figure 8. Variation of emission line relative fluxes and their ratios along the slit. The solid vertical line corresponds to the position of MN18, while vertical dashed lines at±2.5 arcsec from the solid line mark the area where no nebular emission was detected. NE–SW direction of the slit is shown. Upper panel: the relative fluxes of the Hα, [NII] λ6584 and [SII]λ6717+λ6731 lines after continuum subtraction. Bottom panel: [NII]
[image:8.595.46.280.576.695.2]Figure 9. 1D low-resolution spectrum of the equatorial nebula around MN18. The insert shows a part of the high-resolution spectrum of the nebula taken on 2013 April 27.
Table 6. Line intensities of the MN 18 nebula.
λ0(Å) Ion F(λ)/F(Hβ) I(λ)/I(Hβ)
4861 Hβ 1.000±0.236 1.000±0.249
6548 [NII] 7.083±1.183 0.578±0.111
6563 Hα 36.750±6.136 2.947±0.564
6584 [NII] 21.792±3.647 1.705±0.327
6717 [SII] 3.708±0.631 0.248±0.049
6731 [SII] 3.750±0.637 0.247±0.049
C(Hβ) 3.30±0.22
E(B−V) 2.24±0.15 mag
ne([SII]) 560+−450270cm−3
intensity ratios,I(λ)/I(Hβ), and the logarithmic extinction coeffi-cient,C(Hβ), which corresponds toE(B−V)=2.24±0.15 mag. In Table6we also give the electron number density derived from the intensity ratio of the [SII]λλ6716, 6731 lines,ne([SII]). The
ob-tained value is comparable to densities derived for equatorial rings of other bipolar nebulae around blue supergiants and cLBVs (see Section 6.2). BothC(Hβ) andne([SII]) were calculated under the
assumption thatTe=104K. For lower temperatures their values
do not change much, e.g.C(H β) =3.27 andne = 510 cm−3if
Te=7000 K.
The electron number density could also be derived from the sur-face brightness of the equatorial ring in the Hαline,SHα, measured on the SHS image (cf. equation 4 in Frew et al.2014):
ne≈5 cm−3
l 1 pc
−0.5
SHα 1 R
0.5
eE(B−V), (1)
where l is the line-of-sight thickness of the ring and 1 R≡1 Rayleigh = 5.66×10⁻¹⁸ erg cm−2 s−1 arcsec−2 at Hα (here we assume thatneis constant within the ring andTe=104K).
Using equations 1 and 2 in Frew et al. (2014) and the flux cal-ibration factor of 7.2 counts pixel−1R−1 from their table 1, and
adopting the observed [NII] to Hαline intensity ratio of 0.79 from
Table6(here [NII] corresponds to the sum of theλ6548 andλ6584
lines), we obtained the peak surface brightness of the north-eastern (brightest) half of the ring (corrected for the contribution from the contaminant [NII] lines) ofSHα ≈120 R. Using equation (1) with
E(B−V)=1.97 mag andl≈0.47 pc (the line of sight thickness of the torus), one findsne ≈ 570 cm−3, which agrees well with
ne([SII]) given in Table6.
To obtain an order of magnitude estimate of the mass of the equa-torial ring,Mring, we assume that the ring has a toroidal geometry
with the major and minor radii ofR=6.5 arcsec (≈0.17 pc) and
r=4.5 arcsec (≈0.12 pc), respectively, and that its material is fully ionized and homogeneous. In doing so, one findsMring≈1 M.
The actual value ofMringcould be higher if the ionized gas encloses
neutral and, correspondingly, more dense material.
The [NII] and [SII] line intensities can be used to estimate the nitrogen-to-sulphur abundance ratio, which is almost independent ofneandTe, provided thatne≤1000 cm−3andTe≤104K. In this
case, the abundance ratio is given by (see Benvenuti, D’Odorico & Peimbert1973, and references therein):
N(N+) N(S+) =3.61
I(6584)
I(6716+6731). (2)
Using equation (2) and Table 4, one finds N(N+)/
N(S+)≈12.43+−46..0405, which is≈2.4+−01..28times larger than the solar value of 5.12 (Asplund et al.2009). Since the sulphur abundance is not expected to change during stellar evolution, one can argue that the high N to S ratio exists because of an elevated nitrogen abun-dance in the line-emitting material. Thus, using the solar N and S abundances from Asplund et al. (2009), one finds a N abundance of the ring of log (N/H)+12=8.21.
5.2 The position–velocity diagram and kinematics of the equatorial ring
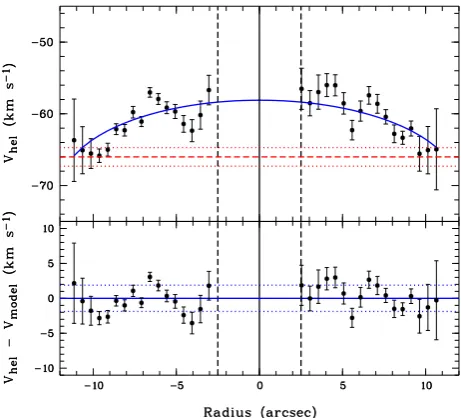
Fig.10plots the distribution of the heliocentric RV of the Hαline, vhel, along the slit, calculated using the method and programs
de-scribed in Zasov et al. (2000). The systematic shifts originating from the RSS flexure were excluded by taking into account the closest bright night sky line. Finally, only those velocity measurements were used which satisfy the criteria S/N>3 andσv<6 km s−1.
[image:9.595.313.544.426.635.2]To estimate the systemic velocity of the equatorial ring,vsys, and
its expansion velocity,vexp, we fit the observed distribution ofvhel
with the model
vhel=vexp cosα+vsys, (3)
wherevexpandvsysare free parameters, andαis the angle between
the line of sight andvexpat each point of the ring. The result of the fit
is shown as a (blue) solid line in the upper panel of Fig.10. The (red) dashed and dotted horizontal lines show, respectively, the derived vsysof−66.0 km s−1and its error margins (±1.3 km s−1). We also
foundvexp=7.9±1.2 km s−1. The difference between the observed
and model velocity distributions (the residual velocity hereafter) is shown in the bottom panel of Fig.10, where the (blue) solid and dotted lines indicate, respectively, the mean residual velocity of −0.05 km s−1and±1
σ of the mean (±1.8 km s−1). The residual
velocity distribution does not show any systematics, which allows us to set an upper limit of 1.8 km s−1on the rotational velocity of
the ring.
The radius of the ring ofr=0.29 pc together withvexpyield the
kinematic age of the ring oftkin=r/vexp≈3.7×104yr. Assuming
that the equatorial ring and bipolar lobes are the result of the same episode of enhanced mass-loss from MN18 (i.e. theirtkinare the
same; cf. Brandner et al.1997b), one finds that the lobes should expand at≈60 km s−1. UsingM
ringfrom Section 5.1 andtkin, one
can also find an order of magnitude ‘kinematic’ estimate of ˙M during this episode, i.e. ˙Mkin∼Mring/tkin≈2.7×10−5Myr−1,
which is about two orders of magnitude higher than the present-day values (see Table5). The discrepancy between the mass-loss rates would be somewhat smaller if the expansion of the equatorial ring was faster initially. (Correspondingly, the expansion velocity of the lobes would be smaller as well.) On the other hand, the duration of the high mass-loss episode could be shorter thantkin, which would
result in an even higher ˙Mkin.
6 D I S C U S S I O N
In Section 1, we noted the existence of a class of Galac-tic and extragalacGalac-tic hourglass-like nebulae associated with blue supergiants and mentioned seven known members of this class. One of them – the three-ring nebula associated with the blue su-pergiant Sk−69◦202 (the progenitor star of the SN 1987A) – was formed shortly (∼104yr) before the star exploded as a supernova.
Currently, one can observe how the supernova blast wave interacts with the equatorial ring of the nebula (Sonneborn et al.1998; Sug-erman et al.2002; Gr¨oningsson et al.2008; Fransson et al.2015). It is also believed that LBVs could be immediate precursors of supernova explosions (e.g. Kotak & Vink2006; Groh et al.2013; Justham et al.2014). Thus, one can expect that some other massive stars with bipolar nebulae will soon explode as supernovae and that the appearance of their young (meaning from decades to centuries old) diffuse supernova remnants would be affected by the dense material of the nebulae. It is therefore worth to compare the derived parameters of MN18 with those predicted by stellar evolutionary models (e.g. Brott et al.2011; Ekstr¨om et al.2012) to determine the evolutionary status of this star and thereby to understand whether or not it is close to explode as well. Knowing the evolutionary status of MN18 would also allow us to constrain the mechanism for the origin of the bipolar nebula around this star, which in turn would help to better understand the origin of bipolar nebulae around other massive stars.
6.1 Evolutionary status of MN18
The range of luminosities derived for MN18 in Section 4.2 cor-responds to the initial mass,Minit, of this star of≈30±10 M.
Using the grid of rotating main-sequence stars by Brott et al. (2011), we found that the main parameters of MN18 (temperature, lumi-nosity, gravity and CNO abundances) can be matched very well with models withMinit in the above range, provided that the
ini-tial rotational velocity of the star,vinit, was of∼200–400 km s−1.
For example, the model of a 30 Mstar withvinit=321 km s−1
predicts that after ≈5.5 Myr the star would have the follow-ing parameters: Teff ≈ 21.0 ± 0.5 kK, log (L/L) ≈ 5.41,
R∗≈38±2 R, logg≈2.70±0.05 and a current rotational veloc-ity of≈110±10 km s−1. The CNO abundances of this star would
be≈6.3×10⁻⁴, 1.6×10⁻³and 3.4×10⁻³, respectively. All these parameters are in good agreement with those derived for MN18 (see Table5). The models with lowvinit also match very well theTeff,
log (L/L) and loggvalues of MN18, but their CNO abundances differ significantly. Specifically, the nitrogen abundances predicted by these models are much lower than what follows from our spectral modelling.
Similarly, we found that the rotating models by Ekstr¨om et al. (2012) also fit well the parameters of MN18 provided that this star just left the main sequence, while in the case of a star undergoing a blue loop evolution the CNO abundances predicted by the models differ significantly from those of MN18. The non-rotating models by Ekstr¨om et al. (2012) do not fit the CNO abundances of MN18 as well. Proceeding from this, one might conclude that MN18 is a redward evolving star, which has only recently become a blue supergiant (cf. Gvaramadze et al.2014a). This conclusion agrees with the suggestion by Lamers et al. (2001) that LBV nebulae could be formed already at the end of the main-sequence phase and that their enhanced nitrogen abundances are due to rotationally induced mixing in their underlying stars. Similar suggestions were put forward by Smartt et al. (2002) and Hendry et al. (2008) to explain the CNO abundances of the bipolar nebula around Sher 25. The duplicity of massive stars provides another clue for under-standing the origin of enhanced N abundance in main-sequence stars because accretion of CNO-processed material from the mass donor star or merger of the binary components can enhance the surface N abundance of the mass gainer star or the merger product, respectively, by a factor of several even in the absence of rotational mixing8(Langer2012; Glebbeek et al.2013). As follows from the
studies by Mason et al. (2009), Sana & Evans (2011) and Chini et al. (2012), the majority of massive stars are members of close binary systems. Furthermore, according to Sana et al. (2012), about 70 per cent of all massive stars are strongly affected by binary in-teraction during their lifetimes through the mass transfer, common envelope evolution or merger, and for more than half of them the interaction takes place already during the main-sequence phase (see also de Mink et al.2014). All of these types of binary interaction can enhance the surface N abundance already during the main-sequence phase, and are also the likely culprits of the production of substantial mass-loss in the equatorial plane.
Thus, MN18 could be a mass gainer from a Case A or Case B system, and as such it could either be rejuvenated or not. In the first case there would be little difference to single star evolution, while in the second one the star at its position in the Hertzsprung–Russell
8Models taking into account rotational mixing in the mass gainers show
diagram could either be core hydrogen or core helium burning (Braun & Langer1995; Justham et al.2014). The latter possibility, however, is less likely because the N abundance of the star would be much higher than what we found for MN18.
To summarize, the above considerations suggest that MN18 is near the end of the main-sequence phase, which makes it unlikely that this star will soon explode as a supernova.
6.2 Origin of the bipolar nebulae
Now we discuss the origin of bipolar nebulae around MN18 and other massive stars. The rotational symmetry of these nebulae im-plies that the stellar rotation plays a significant, if not a decisive, role in their origin.
6.2.1 Single star scenarios
Lamers et al. (2001) proposed that at the end of the main sequence the initially rapidly rotating stars may reach the limit of hydrostatic stability (-limit; Langer1997,1998) in their outer equatorial lay-ers, where the joint action of the centrifugal force and the radiation pressure balances the gravity (cf. Langer, Gar´ıa-Segura & Mac Low
1999). This may result in ejection of a large amount of mass (up to several M) mainly in the equatorial plane. The ejection process could be recurrent with time intervals of∼103–104yr, which are
related to the thermal time-scale of the stars. Correspondingly, the stellar wind in between the ejections could be collimated in the polar direction by the presence of the dense equatorial material.
To reach the-limit the star should be luminous enough to ar-rive at or exceed its Eddington limit in the course of its lifetime and/or be a rapid rotator. For single stars the first condition could be satisfied during the advanced evolutionary phases of very massive (50 M) stars when their masses are considerably reduced due to the extensive stellar wind. Such stars can achieve the-limit even if they are slow rotators (e.g. Langer & Heger1998). The resulting enhanced mass-loss of these stars is almost spherically symmetric and, correspondingly, the circumstellar nebulae around them should be almost spherical as well. In the case of very rapid rotators, the -limit could be reached already during the main sequence. This is conceivable even for those stars which never approach the Edding-ton limit during their lifetime. Correspondingly, the mass-loss from these stars would be highly aspherical, with a slow and dense wind at latitudes close to the equator and a fast and more tenuous one in the polar direction. These stars would produce elongated or bipolar nebulae.
Interestingly, the Brott et al. (2011) models predict that a 20– 30 Mstar withvinit ≈500–600 km s−1can achieve the-limit
by the end of the main sequence, which results in a strong mass-loss with ˙M of10−4M
yr−1. But the higher
vinit, the stronger the
mixing, the longer the duration of the main-sequence phase and the bluer the star. Correspondingly, it takes longer for the star’sTeffto
decrease to 21 kK. The prolonged rotational mixing in turn results in CNO abundances much different from those derived from our spectral analysis.
The question on whether the surface velocity of single stars may hit critical rotation during the main-sequence evolution was studied in detail by Ekstr¨om et al. (2008). They computed stellar models of variousMinit,vinitand metallicities, and found that the-limit
could be reached by B stars withvinitin the upper tail of the initial
rotational velocity distribution. This could be responsible for the origin of the Be phenomenon. Ekstr¨om et al. (2008) also found that
much greater mass-loss from more massive stars at high (e.g. solar) metallicities prevents these stars from reaching the critical rotation. Heger & Langer (1998) proposed a mechanism which may spin-up the surface layers of rotating single stars to critical rotation after they leave the red supergiant branch. It was suggested that this mechanism may result in significant rotation of the progenitor star of the SN1987A (which performed a blue loop just before the supernova explosion) and thereby in the origin of the equatorial ring around it. The CNO abundances of the material ejected by a post-red supergiant star, however, would significantly differ from those of MN18 (see Section 6.1).
Another possibility to increase mass-loss rates of single stars is based on the bi-stability in the radiation driven winds of super-giants near the spectral type B1 (Pauldrach & Puls1990; Lamers & Pauldrach1991), which is manifested in a drastic change in the ion-ization states of Fe whenTeffdrops a little below some critical value
(≈21–25 kK; Vink, de Koter & Lamers1999). This change leads to a factor of 2 decrease inv∞, fromv∞/vesc≈2.6 for supergiants
of types earlier than B1 tov∞/vesc≈1.3 for B supergiants of later
types (Lamers et al.1995), and in a factor of several increase in ˙M (Lamers et al.1995; Vink et al.1999). The increase of ˙Mcaused by the bi-stability jump could be responsible for the ejection of shells by the prototype LBV P Cygni (Pauldrach & Puls1990) and the observed steep drop in the rotational velocities of massive stars at
Teffof 22 kK (Vink et al.2010).
More importantly, the enhanced mass-loss caused by the bi-stability mechanism could be asymmetric if the star is a rapid rotator. In this case, the gravity darkening (the von Zeipel effect) leads to a lowerTeffat the equator (e.g. Maeder1999) and the bi-stability
jump first occurs near the equator as well. This in turn results in enhanced mass-loss at low stellar latitudes. Lamers & Pauldrach (1991) and Lamers et al. (1995) suggested that the bi-stability jump in the winds of rapidly rotating early B-type supergiants could be responsible for the origin of dense equatorial outflows (excretion discs) around B[e] stars. The detailed study of this possibility by Pelupessy, Lamers & Vink (2000), however, showed that the bi-stability mechanism can produce only about a four-fold increase in ˙M, which is not enough to explain the equator to pole density contrast of a factor of≈100 observed for the winds of B[e] stars. It is therefore doubtful that the bi-stability jump alone could explain the about two order of magnitude difference between ˙M derived from our spectral modelling of MN18 (see Table5) and ˙Mrequired to produce the equatorial ring around this star (see Section 5.2).
To conclude, although we cannot exclude the possibility that some single massive stars can hit critical rotation in the course of their evolution (resulting in massive equatorial outflows), we believe that the origin of the equatorial ring around MN18 is more likely because this star is or was a member of a close binary system.
6.2.2 Binary star scenarios
The binary population synthesis modelling by de Mink et al. (2013) suggests that about 20 per cent of massive main-sequence stars should be rapid (>200 km s−1) rotators because of mass transfer
and mergers in close binary systems. About 2 per cent of these stars are expected to have very high (>400 km s−1) rotational velocities
rapid rotation of massive stars (cf. Packet1981; Langer et al.2003; Dufton et al.2011). It is tempting therefore to speculate that these two binary interaction processes are the main causes for the ori-gin of nearly critically rotating stars and equatorial outflows from them.
The mass transfer in binary systems may not only spin-up the mass gainers, but under proper conditions it could also result in the origin of circumbinary disc-like structures by means of the common envelope ejection (e.g. Morris1981), mass-loss through the second Lagrange point (e.g. Livio, Salzman & Shaviv1979; Petrovic, Langer & van der Hucht 2005; Smith et al.2011) and focusing of the primary’s wind towards the orbital plane by the gravitational field of the companion star (e.g. Fabian & Hansen
1979; Mastrodemos & Morris1999). Similarly, the binary mergers can not only produce the rapidly rotating stars, but also result in mass ejection (∼10 per cent of the binary mass; Suzuki et al.2007), which is mainly concentrated in the binary’s equatorial plane. Moreover, the instant mass-loss during the merger event may bring the merger product to the Eddington limit, which in turn would result in a copious mass-loss by stellar wind.
If the origin of the equatorial ring around MN18 is indeed caused by the equatorial mass-loss from either a nearly critically rotat-ing mass gainer or a merger remnant, then the present moderate rotational velocity of this star would imply that the star has suf-fered significant angular momentum loss on a time-scale of≤tkin.
The most efficient mechanisms for the spin-down of (single) mas-sive stars is the magnetic braking via a magnetized wind (Poe, Friend & Cassinelli1989; ud-Doula, Owocki & Townsend2009), which for stellar magnetic fields of∼103–104G and sufficiently
high ˙M can result in spin-down time-scales as short as∼104yr.
[image:12.595.307.545.53.267.2]It is not clear whether initially single stars can simultaneously possess such high magnetic fields and be rapid rotators, but it is believed that very strong large-scale magnetic fields can intermit-tently be created because of the strong shear in merging binary systems (Langer 2012; Wickramasinghe, Tout & Ferrario2014). Such magnetic fields can brake the rapid rotation of the merger remnants through dynamical mass-loss. Polarimetric observations of MN18 and other stars with bipolar nebulae would be of great im-portance to check whether they possess large-scale magnetic fields of strength of∼100–1000 G, which are not typical of the major-ity of massive main-sequence stars (e.g. Wade et al.2014; Morel et al.2015) and whose origin can be the consequence of binary merger.
Figure 12. Normalized VLT/ISAACK-band spectrum of the cLBV MN56 with principal lines indicated.
In Section 5.2, we assumed that the kinematic ages of the equa-torial ring and bipolar lobes of the nebula around MN18 are the same (i.e. both components of the nebula were formed simultane-ously). But it is quite possible that the ring was formed in the first instance (e.g. because of a dynamical mass ejection caused by the binary merger) and that later on its dense material collimated the stellar wind into bipolar lobes. If so, then pure ring-like nebulae should exist whose central stars still have had no time to blow-up pronounced bipolar lobes and which still might be fast rotators. Indeed, several examples of such rings exist. One of them, named [GKF2010] MN109 in the SIMBAD data base, encircles the can-didate blue supergiant 2MASS J19281457+1716230 (Phillips & Ramos-Larios 2008). This ring is best visible at 8µm (see the right-hand panel of Fig.11), while at 24 µm there are no signa-tures of an extended bipolar outflow. Another example, known as [GKF2010] MN56, is associated with the cLBV MN56. In Fig.12, we present for the first time theK-band spectrum of this star ob-tained with the ISAAC spectrograph on the Very Large Telescope
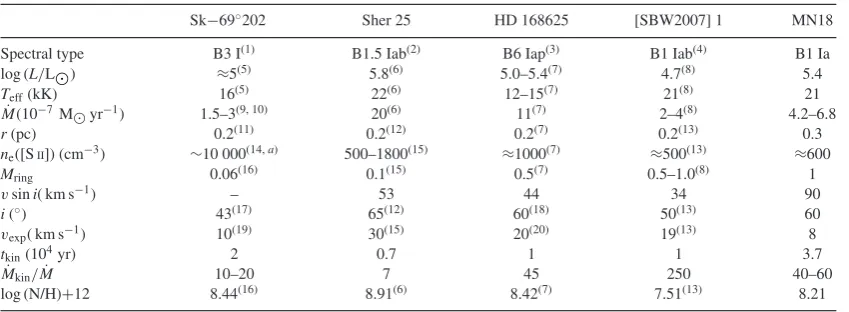
[image:12.595.117.474.546.714.2]Table 7. Blue supergiants and cLBVs with hourglass-like circumstellar nebulae.
Sk−69◦202 Sher 25 HD 168625 [SBW2007] 1 MN18
Spectral type B3 I(1) B1.5 Iab(2) B6 Iap(3) B1 Iab(4) B1 Ia
log (L/L) ≈5(5) 5.8(6) 5.0–5.4(7) 4.7(8) 5.4
Teff(kK) 16(5) 22(6) 12–15(7) 21(8) 21
˙
M(10−7M
yr−1) 1.5–3(9, 10) 20(6) 11(7) 2–4(8) 4.2–6.8
r(pc) 0.2(11) 0.2(12) 0.2(7) 0.2(13) 0.3
ne([SII]) (cm−3) ∼10 000(14,a) 500–1800(15) ≈1000(7) ≈500(13) ≈600
Mring 0.06(16) 0.1(15) 0.5(7) 0.5–1.0(8) 1
vsini( km s−1) – 53 44 34 90
i(◦) 43(17) 65(12) 60(18) 50(13) 60
vexp( km s−1) 10(19) 30(15) 20(20) 19(13) 8
tkin(104yr) 2 0.7 1 1 3.7
˙
Mkin/M˙ 10–20 7 45 250 40–60
log (N/H)+12 8.44(16) 8.91(6) 8.42(7) 7.51(13) 8.21
References: (1) Walborn et al. (1989); (2) Moffat (1983); (3) Walborn & Fitzpatrick (2000); (4) Taylor et al. (2014); (5) Arnett et al. (1989); (6) Hendry et al. (2008); (7) Nota et al. (1996); (8) Smith et al. (2013); (9) Blondin & Lundqvist (1993); (10) Martin & Arnett (1995); (11) Panagia et al. (1991); (12) Brandner et al. (1997a); (13) Smith et al. (2007); (14) Plait et al. (1995); (15) Brandner et al. (1997b); (16) Mattila et al. (2010); (17) Jakobsen et al. (1991); (18) O’Hara et al. (2003); (19) Crotts & Heathcote (1991); (20) Hutsemekers et al. (1994).
aBased on the fading of the [O
III]λ5007 emission line. (VLT) during our observing run in 2010.9 The spectrum shows
strong emission lines of H, HeI, FeIIand MgIIand is almost
iden-tical to that of the cLBV HD 316285 (see fig. 2 in Hillier et al.
1998). [GKF2010] MN56 also has a clear-cut ring-like morphology with a ‘horn’ attached to the south-east edge of the ring (see the right-hand panel of fig. 4 inPaper Ifor the IRAC 5.8µm image of this structure). The presence of the horn suggests that the stellar wind already starts to be collimated into bipolar lobes. The satu-rated 24µm image of [GKF2010] MN56 (see the left-hand panel of fig. 4 inPaper I) did not allow us to discern the horn, but it also did not show signatures of a more extended bipolar outflow. High-resolution spectroscopy of 2MASS J19281457+1716230 and MN56 would be desirable to determine the rotational velocities of these two stars, as well as the evolutionary status of the former one. Binary population studies suggest that the rate of massive binary mergers in the Galaxy is∼10–20 per cent of the Galactic supernova rate, which corresponds to one per 200 yr (Langer2012). Assuming that all mergers result in the formation of ring-like or bipolar neb-ulae and that the dispersion time-scale of these nebneb-ulae is∼104yr,
one finds that our Galaxy should contain about 100 such nebu-lae. The actual number of these nebulae however should be much smaller because the majority (≈80 per cent; Gies1987) of massive stars reside in their parent star clusters where the stellar winds and ionizing emission of neighbouring hot massive stars could prevent the formation of discernible circumstellar nebulae. This inference could be supported by the fact that all massive stars with known well-shaped (bipolar or ring-like) nebulae are located either at the periphery of their parent star clusters or in the field, and therefore are likely runaway stars (Gvaramadze et al.2012a,b; 2014b).
6.3 MN18 and other B supergiants with bipolar nebulae
All but one (MN13) of seven hourglass-like nebulae around B su-pergiants mentioned in Section 1 are visible (at least partially) at optical wavelengths, and five of them were studied by means of
9Full details of these observations will be presented elsewhere, while some
preliminary results could be found in Stringfellow et al. (2012a,b).
optical spectroscopy.10In Table7, we compare the main parameters
of the central stars and equatorial rings of these five nebulae. Table7shows that the luminosities of the stars associated with bipolar nebulae span a large range, from log (L/L)=4.7 to 5.8 (with the luminosity of MN18 being close to the median value of ≈5.3). From this one can conclude that the stellar luminosity (or
Minit) is not a decisive factor in formation of bipolar nebulae, which
is expected if the nearly critical rotation is the main reason for the origin of these nebulae. In this regard, it is worthy to note that some PNe also possess the hourglass-like morphology, whose origin is most likely due to binary interactions (e.g. Corradi & Schwarz1993; Sahai et al.1999; De Marco2009).
One can also see thatTeffvalues span quite a large range as well,
from 13 to 22 kK, which might be considered as an indication that the bi-stability mechanism may not contribute to the origin of at least some of the bipolar nebulae. This inference, however, could be inconclusive becauseTeffof bona fide LBVs can vary in the same
range on time-scales as short as several years (e.g. Stahl et al.2001; Groh et al.2009). One cannot therefore exclude the possibility that
Teffof Sk−69◦202 and HD 168625 were close to the bi-stability
limit during the formation of nebulae around these stars.
The axial symmetry of the bipolar nebulae suggests that the tilt an-gles of their equatorial rings are equal to those of the rotational axes of the central stars. This allows one to estimate the rotational veloci-ties for those stars whose projected rotational velociveloci-ties are known. Table7shows that none of these four stars are rapid rotators.11
Thus, if the origin of the equatorial rings is due to the nearly critical rotation of their underlying stars, then the spin-down time-scales of these stars should be shorter thantkinof the equatorial rings, all of
which are∼104yr. It is reasonable to associate this drastic
spin-down with a brief episode of very high ˙M (e.g. Heger & Langer
1998), which is much higher than the current values of ˙M and perhaps even higher than the ‘kinematic’ ones, ˙Mkin∼Mring/tkin.
10There are no reported spectroscopic observations of the equatorial belt
(visible in optical light; Marston & McCollum2008) of the bipolar nebula around the cLBV MWC 349A.
11There is no information on the projected rotational velocity of the