City, University of London Institutional Repository
Citation:
Cubi-Molla, P., De Vries, J. and Devlin, N. (2014). A study of the relationship between health and subjective well-being in parkinson's disease patients. Value in Health, 17(4), pp. 372-379.This is the unspecified version of the paper.
This version of the publication may differ from the final published
version.
Permanent repository link:
http://openaccess.city.ac.uk/3857/Link to published version:
Copyright and reuse: City Research Online aims to make research
outputs of City, University of London available to a wider audience.
Copyright and Moral Rights remain with the author(s) and/or copyright
holders. URLs from City Research Online may be freely distributed and
linked to.
City Research Online: http://openaccess.city.ac.uk/ publications@city.ac.uk
A Study of the Relationship Between Health and
Subjective Well-being in Parkinson’s Disease Patients
Corresponding author:
Patricia Cubí-Mollá, PhD. Department of Economics
School of Arts and Social Sciences D309 City University London
Northampton Square, London EC1V 0HB
Phone: +44 (0) 207 040 4543
Email: p.cubi-molla@city.ac.uk
Other authors:
Jane de Vries, MSc. GlaxoSmithKline PLC
Nancy Devlin, PhD.
Office of Health Economics
ABSTRACT
Objectives
Governments are turning their attention to evidence on subjective measures of well-being to inform policy
decisions. In the context of health, there is therefore growing interest in understanding how measures of
health-related quality of life relate to subjective well-being, and whether subjective well-being could
provide a basis for resource allocation decisions in the future. This study investigates the relationship
between health-related quality of life, as measured by EQ-5D, and subjective well-being in Parkinson’s
disease.
Methods
A paper questionnaire including EQ-5D, four key subjective well-being questions taken from the
Integrated Household Survey in England and other demographic details was distributed to people with
Parkinson’s disease in the UK. Responses were used to estimate multiple regression models explaining
subjective well-being using the EQ-5D Index (UK weights), EQ-5D dimensions and EQ-VAS and patient
socio-demographic characteristics.
Results
A total of 199 responses were received. Combining EQ-VAS and EQ-5D dimensions, especially
anxiety/depression and, to a lesser extent, mobility, yielded the best-fitting models (adjusted R2 range
0.36-0.53). Parkinson’s disease patients living in care homes report lower levels of subjective well-being
than those living alone. These effects are not captured by the health-related quality of life measures in the
analysis.
Conclusions
Usual health-related quality of life measures can partially explain different well-being dimensions, yet they
fail to capture part of the broader impact of disease on subjective well-being. Further empirical research
into the relationship between subjective well-being and EQ-5D longitudinally, and in different disease
INTRODUCTION
Governments across the world, including the UK government [1], and bodies such as the Organisation for
Economic Co-Operation and Development (OECD) [2], are increasingly using evidence on subjective
measures of happiness as a way of informing decisions about a wide range of public policies.
In the context of the health care sector, this has generated considerable interest in understanding how
measures of health-related quality of life (HRQoL), which are widely used to inform decisions about
pricing and reimbursement of health care technologies, relate to these measures of happiness or
subjective well-being (SWB), and whether the latter might provide a basis for resource allocation
decisions about health care in the future. This raises fundamental questions about what the purpose of
health care is - to improve health or to improve happiness - and how those outcomes are best measured.
For example, does the EQ-5D [3] - a generic measure of HRQoL which is recommended by NICE for use
in evidence submitted to its health technology assessment (HTA) process [4] and widely used
internationally- capture some aspects of SWB? Which specific dimensions of the EQ-5D relate to which
measures of SWB? What aspects of SWB are missed by the EQ-5D?
Some evidence on these questions is available. For example, a number of papers have attempted on the
use SWB in valuing HRQoL states described in terms of the EQ-5D and SF-6D (as an alternative to
current approaches used to value HRQoL states, such as the Time Trade Off) [5-8]. Studies have also
explored the extent to which various conditions contribute most to unhappiness. [9] However, to date
there has been little detailed examination of the relationship between dimensions and levels of EQ-5D
(the EQ-5D profile) and SWB by disease area; how patients’ overall assessment of their own health on
the visual analogue scale (EQ-VAS) relates to their self-reported SWB, and how these relationships differ
across different aspects of SWB that might be measured.
Answering these questions is complicated somewhat by the lack of standardization in the use of the term
SWB, the “new science” of SWB, as Layard describes it [10], having emerged relatively recently.
For instance, the terms “happiness” and “subjective well-being” are often used interchangeably [11],
as equivalent to life satisfaction, quality of people’s lives [11] or experienced utility [12]. On the other
hand, SWB is frequently used as an umbrella term for how we feel (“affective happiness”) and think
(“evaluative happiness” or “rewardingness”) about life [11]. Recent recommendations from OECD [13]
distinguish three different components of SWB: evaluative (reflective assessment of life “as a whole” or
an aspect of it), affective (experience or feelings) and eudaimonic (functioning and realisation of the
person’s potential). Many different instruments have been developed to measure the various nuanced
definitions of SWB. A comprehensive collection of the available instruments can be found in Helliwell et al
[11], and different guidelines providing advice on the collection and use of such instruments can be found
in OECD [13]. In this paper we viewed SWB as a broad concept that encompasses the three
components.
In the UK, subsequent to a public consultation and advice from academics, the following SWB questions
on an ordinal scale of naught to ten were defined for inclusion in the ongoing Integrated Household
Survey beginning in April 2011 [14]:
1. Overall, how satisfied are you with your life nowadays?
2. Overall, to what extent do you feel that the things you do in your life are worthwhile?
3. Overall, how happy did you feel yesterday?
4. On a scale where nought is “not at all anxious” and 10 is “completely anxious”, overall, how
anxious did you feel yesterday?
Question 1 is intended to capture the evaluative component. Question 2 represents the eudaimonic
dimension. Question 3 and 4 may be the basis for the second dimension (“affective”) in terms of positive
and negative affect [11].
SWB determinants suggested by Helliwell et al [11] embrace a wide variety of factors, for example
income, quality of governance, day-to-day joys, trust in one’s community, and having someone to count
on in times of difficulty. Among all the factors influencing SWB, health obviously plays an important role,
and HRQoL is frequently considered as a key dimension of SWB. Since SWB is a broader concept, and
SWB to value health improvements could in theory address many of the limitations of measures of
HRQoL. For example, SWB has the potential to be used more broadly as a measure of benefit across
different sectors (e.g. across health and social care services), as arguably increasing well-being should
be the ultimate goal of most, if not all, government policies whether in health or any other sector. Thus,
concerns about whether widely used measures of HRQoL—such as the EQ-5D—are missing dimensions
of health that are relevant to patients also is addressed, as individuals would implicitly include these in
their own assessment of SWB. However, how SWB relates to HRQoL, and particularly to the EQ-5D, has
not been widely studied.
The primary aim of this exploratory study was therefore to investigate the relationship between HRQoL
(as measured by both the EQ-5D profile and patients’ overall rating of their health on the Visual Analogue
Scale or EQ-VAS) and SWB scores (on the four key Office for National Statistics –ONS- questions
described above) in a given health condition. The population chosen for this analysis is Parkinson’s
Disease (PD) patients. PD is a progressive neurodegenerative disorder affecting approximately 120,000,
or 1 in 500, people in the UK. The condition is characterized by disabling motor symptoms, including
tremor, rigidity and slowness of movement, often accompanied by non-motor symptoms including pain,
depression and anxiety, constipation and fatigue.
This patient cohort is interesting for a number of reasons. First, although EQ-5D appears to work
reasonably well as a measure of HRQoL in PD [15], no previous research explored how the UK SWB
measures perform in this group of respondents. Second, PD is a good example of a disease area for
which the usual measures of HRQoL may fail to capture part of the wider impacts of the disease on SWB.
For instance, SWB determinants suggested by Helliwell et al [11] as “having someone to count on in
times of difficulty” or “trust in one’s community” may not be captured by usual measures of health or utility.
We analysed the degree of correlation of proxies for these determinants and SWB for PD patients, with
and without controlling for health related factors. If significant differences were found, this would be an
indicator that the extent to which a disability affects subsequent well-being depends not just on the
maintaining their social connections. If so, the paper would provide some insights in the appropriateness
of using SWB measures as a complement for health resource-allocation in the near term.
METHOD
The Questionnaire and Data Collection
A paper questionnaire was developed for self-completion by individuals with a diagnosis of PD in the UK.
The questionnaire included the following items.
1. Demographic questions (age range, sex, years since diagnosis, marital status, employment status,
household situation, education). Income data were not collected due to concerns that this might
adversely impact the response rate [16]. A tick-box format was used for ease of completion.
2. The EQ-5D-3L instrument [3], including both the patients’ EQ-5D health profile and the patient’s
overall assessment of their health on a visual analogue scale (the EQ-VAS, from 0–100, representing
worst- and best-possible health respectively). The EQ-5D health profiles also can be summarised by
a single number representing the relative value of that health state on a scale anchored at 1 (full
health) and 0 (dead). The value set used for this purpose in this study is the UK value set reported by
Dolan [17].
3. The four SWB questions taken from the Integrated Household Survey, as shown in the introduction,
and adapted from the verbal interviewer script into a written format to enable self-completion.
Two versions of the questionnaire were developed, in which the order of the EQ-5D and SWB questions
were alternated (50:50 split) to control for ordering effects.
Two strategies were used to contact potential participants:
1. Attendance at seven local Parkinson’s UK support group meetings and three larger regional
were presented and questions answered. Questionnaires then were distributed to interested
members.
2. An email sent to the Parkinson’s UK’s on-line research network inviting interested members to
request a questionnaire by post. Stamped, addressed envelopes were provided for returns.
Participants were assured that their responses would be anonymous and participation voluntary.
The questionnaire took approximately ten minutes to complete.
Analysis
Participants’ responses were analyzed using Stata12. Initially descriptive statistics were performed on
each of the independent SWB variables and the dependent variables individually.
- Regression models
The SWB data collected are ordinal, i.e. ranked data, rather than cardinal in nature. Since ordinal
measures of health are one of the most commonly used indicators, a wide variety of techniques have
been developed to make the responses suitable for different regression analyses. The present study uses
two different approaches. (A thorough discussion of the measurement scale of health variables can be
found in Erreygers and van Ourti [18]).
1. Direct assumption of the existence of a cardinal scale at the response level: the SWB will be
interpreted as a continuous value from 0 to 10 with ratio properties (e.g. a difference between the
categories 2 and 3 in a SWB measure equals the difference between the categories 4 and 5).
This assumption is consistent with the large number of categories in the SWB answers, and it
supports the use of common parametric methods as ordinary least squares regression.
2. Projection of continuous, cardinal scales on ordinal measures: we assume the existence of a
latent, unobservable well-being variable that is distributed in a particular way across the different
categories (e.g. changes in the degree of well-being between two categories are explained in
ordered probit/logit regression models, as can be found, for instance, in Van Doorslaer and Jones
[19].
Health measures of a general population sample usually have a skewed distribution with the great
majority of respondents reporting their health towards the high end of the scale. A similar outcome could
be expected for well-being measures since (our hypothesis is that) health is a key factor at explaining
SWB. This study collects data from PD patients rather than the general population, but skewness in the
distribution of most of the SWB variables still is apparent (see Figure 1). This suggests that SWB may
better fit the assumption of a skewed distribution. To ensure that the SWB variable (y) is skewed in the
appropriate direction (for life satisfaction, life worthwhile and happiness dimensions; this change does not
apply to anxiety), we need to invert the 0-10 scale and derive a mirror-image “subjective unwell-being”
variable (h, where h = 10- y) that will more closely follow a standard log-normal distribution. A similar
method has been applied to health (“ill-health”), e.g. in Cubi-Molla and Herrero [20].
Three types of regressions have been developed to model the distribution of each of the SWB questions.
For that purpose, the interpretation of the coefficients will be the most interesting feature from our
perspective. Therefore, other issues like retransformation methods for the analysis of the expected values
or issues related to truncation or censoring are ignored here.
The first model (“OLS Normal”) is the simple ordinary least squares (OLS) regression
where is the vector of covariates including HRQoL measures, socio-demographic variables and the
constant term. This model assumes continuity in the SWB variable and the coefficients have an easy
quantitative interpretation. However, the model rules out the existence of skewness.
The second model (“OLS LogNormal”) consists of a modification of the first one, still assuming continuity
in SWB but now allowing for skewness in the distribution.
The third model (“OPM”) is an ordered probit model with well-being as a latent variable, treating SWB as
a categorical measure and assuming normal distribution of the error term, conditional on the covariates:
- Explanatory variables
Four different specifications of HRQoL were used for each model: (1) EQ-5D TTO index [17]; (2) dummy
variables for the 5D levels in every dimension; (3) VAS; and (4) dummy variables as well as
EQ-VAS.
Each model also controlled for different factors that may affect the self-valuation of the well-being. We
were interested in particular in analysing one of the SWB determinants suggested by Helliwell et al.
[11], “having someone to count on in times of difficulty”. To capture this, we used household composition
as a proxy. Our hypothesis was that patients living alone would report lower SWB levels than those living
with partners or relatives, or in care homes, and that this effect would not be captured by the HRQoL
measures. The models also controlled for the number of years since diagnosed, the age, gender and
education of the respondent.
The results of the approaches were summarized and compared. The coefficients were be used to
investigate the relationship between HRQoL and SWB in PD patients.
RESULTS
Participants
A total of 276 questionnaires were distributed and 199 participants responded (response rate 72%). Of
the respondents, 118 (60%) participants were male and 78 (40%) female, although incidence of PD is
age of onset of around 65. Approximately 81% of participants lived with a spouse or partner, representing
relatively high levels of social support from informal carers. About 47% of participants had a recent
diagnosis in the past five years, and a further 27% in the last six to ten years. A summary description of
the relevant variables is provided in Table 1.
(Table 1 about here)
Descriptive Statistics of Health and Well-being
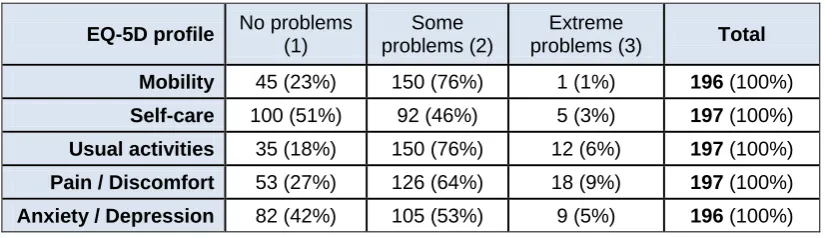
As anticipated, a large proportion of patients (58%) reported that they suffered from at least moderate
anxiety and depression. The majority of participants also reported moderate problems with mobility, usual
activities and pain/discomfort (see Table 2).
(Table 2 about here)
Table 3 and Figure 1 show summary descriptive statistics and histograms of the distribution of the main
variables of the study. Table 3 also includes the descriptive statistics in the first release of the SWB data
collected by the ONS opinions survey, which was made available in December 2011 [21]. PD patients
reported on average poorer SWB scores than the general population (though we do not control for e.g.
age or gender). We can also observe that for PD patients, “life satisfaction”, “life worthwhile” and
“happiness” scores performed similarly in skewed distributions, with mean values around 6.5 and
standard deviations around 2 points. At face value, they also appeared to behave similarly in the
EQ-VAS. The EQ-5D index had a different shape, displaying a bimodal distribution that is characteristic in
patient populations and had a higher standard deviation [22].
(Table 3 about here)
“Anxious yesterday” scores behaved differently from all other measures, and had a quite different
distribution. On closer inspection of the raw data, it was found that many of those reporting high levels of
SWB in terms of life satisfaction, life worthwhile and happiness were also reporting high levels of anxiety.
To find people scoring differently in each measure may be highlighting the importance of incorporating the
fourth question (anxiety) into the valuation of SWB. However, we should take this interpretation with
caution. That is because an alternative explanation may be that the scale used for anxiety is the inverse
of that of other SWB questions (i.e. 0 =not at all anxious, the best possible state, whereas for the other
SWB questions, 0= not at all satisfied, worthwhile or happy respectively, the worst possible state), which
was counter-intuitive and suggested misinterpretation of the scale. This second interpretation is in some
way supported by an analysis of SWB anxious scores by EQ-5D anxiety/depression dimension level,
whereby it was observed that some non-anxious/depressed individuals had high SWB anxious scores,
and some moderately anxious/depressed individuals reported low SWB anxious scores. Therefore the
analysis of the SWB-anxiety dimension was included in the paper, but the potential interpretations of the
results should be taken with caution.
Multiple Regression Analysis
Results for each of the models estimated for the four SWB variables are reported in Appendix Tables A1–
A4.
Comparing results for every SWB question, we can observe that all the models displayed some
similarities in terms of the significance of coefficients and direction of the effect (note that OLS LogNormal
regression for “life satisfaction”, “happiness” and “life worthwhile” results are expressed in terms of effect
on ill-health). This result is consistent with other papers as Ferrer-i-Carbonell and Frijters [23], who found
evidence that the assumptions on cardinality/ordinality of the variable “happiness” make little difference
on the statistical significance and qualitative interpretation of the coefficients.
For “life satisfaction”, “happiness” and “life worthwhile”, the adjusted R2
s and pseudo R2s suggest that
individual dimensions. The models with the best explanatory power, however, were achieved by
combining the EQ-VAS and significant dimensions of the EQ-5D (see columns “EQ-5D and EQ-VAS” in
the Appendix Tables A1–A3). This outcome is not observable in the “anxiety” dimension, as it will be
explained later.
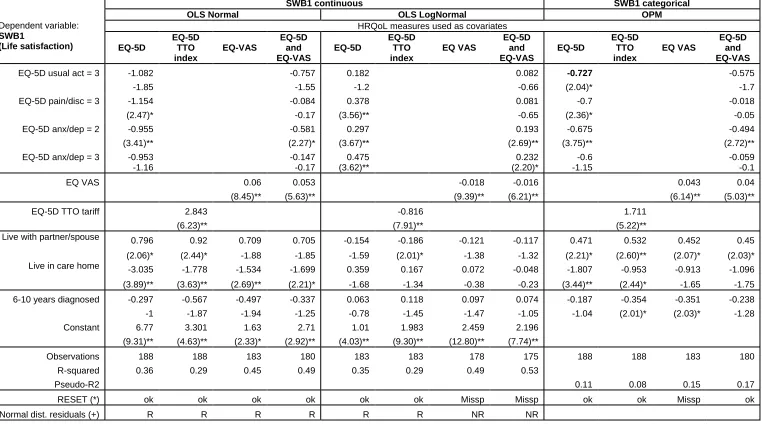
Overall, the model results for “life satisfaction” (Appendix Table A1) are as follows. Regardless of which
model we used (OLS or OPM), the EQ-5D TTO Index appeared to be the least useful of the HRQoL
variables in explaining the variance in “life satisfaction”. Only the dimensions of pain/discomfort (level 3)
and anxiety/depression (levels 2 and 3) were statistically significant across models, in addition to the
dimension of usual activities (level 3) in the OPM.
All the OLS Normal models for “life satisfaction” rejected the assumption of normality, and only two of the
OLS LogNormal models did not reject it. This suggests that the distribution of “life satisfaction” was
certainly skewed. Therefore, the OLS Normal models may not be capturing the distribution properly,
despite having a better goodness of fit.
Several socioeconomic factors that usually correlate with HRQoL indicators—such as education, gender
or employment status—were not statistically significant in the regressions. However, the household
composition seemed to be an important explanatory factor for life satisfaction. In particular, PD patients
living with a partner or with other family members report greater life satisfaction than those living alone.
This could support the hypothesis suggested by Helliwell et al. [11] that “having someone to count on in
times of difficulty” is a key determinant of SWB. It is also notable that patients living in health care homes
reported lower life satisfaction levels than those living alone. This result was not expected to be affected
by the severity of the illness or by the number of years with PD, since these variables were not statistically
significant in the models.
The model results for the SWB variable “life worthwhile”, shown in Table A2, were as follows.
The feeling was that “life is worthwhile” is apparently more difficult to model and explain than feelings of
life satisfaction, with (pseudo) R2s that are somewhat lower. The hypothesis of normal distribution of the
combining EQ-VAS and dimensions of EQ-5D yield the best-fitting models. Only anxiety/depression
(levels 2 and 3) and mobility (level 3) were significant in explaining the sense of life being worthwhile.
Household situation was again a consistently significant socioeconomic variable, with the same direction
of the effects as that for “life satisfaction”. The model assuming an OLS LogNormal distribution showed
that age above 50 seems to be directly correlated with life satisfaction, which may suggest that the
relationship between life satisfaction and age could be U-shaped –with the minimum occurring around the
age of 50-, as others have also suggested [24]. The same association was shown by the OLS Normal
regression, but not by the OPM one.
With respect to the models for “happiness” (Table A3), again the OLS Normal model combining EQ-VAS
and EQ-5D dimensions explained happiness the best. Similarly to the life-worthwhile models, mobility
(level 3) and anxiety/depression (levels 2 and 3) seemed to be the only EQ-5D dimensions that could
explain part of the happiness. Interestingly, and in contrast to the “life satisfaction” and “life worthwhile”
models, living with a spouse or family was no longer significant, perhaps illustrating the multi-dimensional
nature of SWB, and suggesting that having family may be worthwhile, but may not necessarily contribute
to happiness. Living in a care home was, however, associated with significantly lower levels of happiness
in some of the models, as was true in the other SWB dimensions. Age of the patient was also significant
here in some of the models, suggesting again that older patients are more likely to report a higher
category of happiness than younger ones, regardless of the number of years since diagnosis.
In the regressions for “anxiety” (Table A4), the EQ-5D dimension for anxiety/depression was found to be
significant, as expected. For instance, under the OLS Normal assumptions, a patient reporting “I am
extremely anxious or depressed” will be expected to choose a level of SWB “anxiety” four points higher
than a patient reporting “I am not anxious or depress”. In the same way, having problems with performing
the usual activities are associated with higher levels of SWB “anxiety”. Mobility and pain/discomfort were
not significant anymore, contrary to what was observed in the previous SWB dimensions. EQ VAS, when
used as the only health-related control variable, was found to be significant (same as EQ-5D TTO tariff).
However, it was not when used in combination with the EQ-5D dummies. Contrary to “life satisfaction”,
“anxiety”. Living in a care home was associated with significantly lower levels of anxiety in most of the
models, as in the other SWB dimensions. To a lesser extent, patients more than 20 years diagnosed
were associated with lower categories of anxiety.
The dimension of SWB for “anxiety“ produced some startling results, as well. Being unable to wash or
dress themselves was associated with lower level of anxiety, compared to those with “no problems in
self-care today”. This result was observable across the different models. Since such anomaly can be read as
a potential misinterpretation of the SWB anxious scale by the respondents, these results should be taken
with caution.
DISCUSSION
The purpose of the study was to examine the strength of the relationship between EQ-5D and SWB as
defined and measured by the ONS HIS [14]. The analysis has focused on people with PD, a disease for
which the usual measures of HRQoL may fail to capture some of the broader impact of a chronic
condition on SWB.
Regression analysis determined that EQ-5D, both its index and dimensions, have a moderate explanatory
power for SWB in PD in terms of life satisfaction, life being worthwhile, happiness and anxiety; adjusted
R2s in the OLS models ranged from 0.13-0.40 (OLS Normal) and 0.12-0.36 (OLS LogNormal). It
appeared that some dimensions, in particular self-care and ability to perform usual activities, were fairly
redundant in explaining SWB (with exception of the “anxiety” dimension) . In contrast, symptoms such as
anxiety/depression and, to a lesser extent, pain/discomfort and mobility, were more important. The
statistically significant coefficient was typically associated to level 3 and, in some cases, also to level 2.
Thus more severe health states seemed to have a higher impact in the SWB measures, compared to
lesser deviations from “full health”. Interestingly, the EQ-VAS performed generally better than the EQ-5D
index, with adjusted R2s in the range 0.36-0.45 (OLS Normal) and 0.32-0.49 (OLS LogNormal) for “life
satisfaction”, “life worthwhile” and “happiness”. Combining the EQ-VAS and EQ-5D dimensions into one
model yielded the best results with R2s in the range 0.40-0.49 (OLS Normal) and 0.36-0.53 (OLS
It is interesting to reflect on why the EQ-VAS should have performed better than the EQ-5D in predicting
SWB. First, if there are any aspects of HRQoL important to people but not reflected in the EQ-5D
dimensions, then this will act to influence the EQ-VAS, and probably SWB also. Second, as the EQ-VAS
is the overall assessment of their own (experienced) health state rather than the valuation of that
individual’s EQ-5D profile by members of the general public, intuitively it will be closer to SWB, which is
also self-rated, and may take account of phenomena such as adaptation, which EQ-5D does not reflect.
Another important finding of the research is that OPM and OLS regressions of SWB look similar in terms
of the significance of coefficients and direction of the effect, suggesting that the SWB data, although
strictly speaking ordinal, behaves similar to cardinal data on an interval scale, i.e. in a linear fashion. This
result is consistent with other authors’ as Ferrer-i-Carbonell and Frijters [23]. As such, it would be
tempting to treat SWB as interval data in future research. Dolan [6] supports this view, suggesting the
area under a happiness curve over time could be summed, in the same way that QALYs are derived,
although it would not represent the same value as a QALY. However SWB questions are not anchored in
the same way as, e.g. EQ-5D, that is by “dead” and “perfect health”, leading to potential problems of
interpersonal comparability. While it is difficult to conceive of anchoring SWB to death, other means of
calibrating the scale, e.g. the use of SWB vignettes, might be considered in future to address this
concern.
The results also suggest that usual measures of HRQoL fail to capture part of the broader impact of
disease on SWB. We observe that household composition is an important explanatory factor for all the
SWB dimensions. In particular, PD patients living with partners or relatives are more likely to report higher
levels of SWB than those living alone. This result is systematically observed across the models. Thus, the
SWB determinant suggested by the OECD as “having someone to count on in times of difficulty” does not
seem to be captured by the EQ-5D-related measures. It is notable that patients living in care homes
systematically report lower levels of SWB than those patients living alone, after controlling for age and
years since diagnosis. This finding suggests concerns that should be explored in more detail.
In terms of the SWB “anxious” measure, respondents appeared to have some difficulty interpreting the
questions. Interestingly, in the first release of the SWB data collected by the ONS opinion survey that was
made available in December 2011, the SWB anxious scores had a similarly large standard deviation (SD)
compared to our results, which was also larger than for the other SWB questions (see Table 3). This
suggested that respondents to the verbally-administered BHPS survey had interpretation difficulties
similar to the participants in our study; the format of the question therefore merits some reassessment.
These research findings have several implications. Although the relationship between EQ-VAS, EQ-5D
and SWB in PD was not especially strong, a mapping exercise of EQ-VAS and appropriate EQ-5D
dimensions onto SWB is not inconceivable if we take the step discussed above and treat SWB as
interval-scale data. Brazier et al. [25] noted in a recent literature review of models mapping HRQoL
instruments, both disease-specific and generic, that the explanatory power of models, mostly OLS,
ranged from a poor 0.17 to 0.71. The OLS models generated in this research fit easily within this range.
Such an exercise could potentially yield a wealth of information about the SWB benefits of health care
interventions in the past, where EQ-5D and EQ-VAS data were originally collected, to inform future SWB
based research and policy.
We should be mindful that the study had several limitations, including the focus on only one disease area,
potential selection bias, cross-sectional design due to time constraints, lack of income data collected, the
potential focusing effect of the way the happiness topic was presented to participants, and possible
problems with participants misinterpreting the SWB anxious scale. Future research should aim to address
these limitations, and potentially examine the relationship between EQ-5D and SWB in a more controlled
setting and through time—for example, in clinical trials—and in a wider variety of disease areas.
Consideration also should be given to mapping EQ-VAS and the EQ-5D index to SWB, as noted earlier.
In the longer term, if SWB is to gain further support, then attempts should be made to further standardise
its definition, similar to the generic HRQoL measures such as EQ-5D, and its collection should become
more routine and widespread. Thought also should be given to anchoring SWB states, as previously
CONCLUSION
The results of this pilot study indicate that the VAS, in combination with certain dimensions of the
EQ-5D, particularly anxiety/depression and pain/discomfort, taken together with some demographic variables,
can partially explain different SWB dimensions (life satisfaction, life worthwhile and happiness) both in PD
and potentially in other diseases. Nevertheless, and as expected, given the different conceptual basis for
the approaches, EQ-5D-related measures do not capture all the relevant factors affecting SWB. Evidence
is strong that SWB determinants such as “having someone to count on in times of difficulty” or “trust in
one’s community” may not be captured by the measures of health or utility typically used in health care
decision making. These findings suggest there may be a role for using SWB, as a complement to
conventional generic measures of HRQoL, as a basis for evaluations, where (1) interventions may affect
both health and social care outcomes, beyond those captured by measures such as EQ-5D, and (2)
where it is important to be able to compare outcomes and resource allocation across different areas of
the public sector.
As the interest in SWB as a policy tool gathers momentum, proxies for it may be developed using existing
data from generic HRQoL measures such as the EQ-5D profile and EQ-VAS. However, these conclusions
require further substantiation through a larger body of empirical research into SWB and EQ-5D/EQ-VAS,
in other diseases and through time. SWB definitions and measures may require further standardisation
and refinement in order to ensure they provide a valid and appropriate basis for social policies.
ACKNOWLEDGEMENTS
The authors would like to thank Parkinson’s UK, in particular Lubna Arif-Schmitt, for granting its consent
for this study, and to the members who kindly completed the questionnaires and provided such a warm
welcome at their local meetings. We would also like to thank the EuroQol Group for permission to use the
EQ-5D instrument, and also Joanna Coast and Hareth Al-Janabi at Birmingham University, and staff at
the PSSRU, Kent University for permission to use the ICECAP-A and ASCOT instruments, respectively,
OHE for their assistance with statistical analysis and advice on handling subjective well-being data,
respectively, to Bernard van den Berg (University of York) who assisted with initial advice; and to Martin
Buxton for his detailed comments on an earlier version of this paper.’ The original draft of this work was
written by Jane de Vries as an MSc dissertation at City University London. Revisions of the paper were
funded from the annual programme grant the OHE receives from the ABPI.
REFERENCES
[1] HM Treasury Budget 2010. Available from:
http://www.direct.gov.uk/prod_consum_dg/groups/dg_digitalassets/@dg/@en/documents/digitalasset/dg_
188581.pdf. [Accessed August 3, 2013].
[2] OECD (2011). How’s life? Measuring well-being. Available at:
http://www.oecd-ilibrary.org/economics/how-s-life_9789264121164-en. [Accessed 21 July 2013].
[3] The EuroQol Group. EuroQol: A new facility for the measurement of health-related quality of life.
Health Policy 1990;16(3):199-208.
[4] NICE. Guide to the methods of technology appraisal 2013, Available at:
http://publications.nice.org.uk/pmg9 [Accessed 10 October 2013].
[5] Mukuria C, Brazier J. Valuing the EQ5D and the SF6D health states using subjective well-being: A
secondary analysis of patient data. Soc Sci Med 2013;77:97-105.
[6] Dolan P. Using Happiness to Value Health. London: Office of Health Economics 2011.
[7] Powdthavee N, van den Berg B. Putting different price tags on the same health condition:
[8] Dolan P, Kahneman D. Interpretations of utility and their implications for the valuation of health. Econ
J 2008;118:215-234.
[9] Graham C, Higuera L, Lora E. Which health conditions cause the most unhappiness? Health Econ
2011;20:1431-1447.
[10] Layard R. Happiness: Lessons from a New Science. London: Penguin Books, 2005.
[11] Helliwell J, Layard R, Sachs J. (eds). World happiness report. New York: Earth Institute, Columbia
University, 2012.
[12] Dolan P, Lee H, King D, Metcalfe R. How does NICE value health? BMJ 2009;339: b2577.
[13] OECD. Guidelines on Measuring Subjective Well-Being. Paris: OECD Publishing, 2013.
[14] Dolan P, Metcalfe R, Layard R. Measuring Subjective Well-being for Public Policy. Office for National
Statistics, London 2011.
[15] Schrag A, Selai C, Jahanshahi M, Quinn NP. The EQ-5D—a generic quality of life measure—is a
useful instrument to measure quality of life in patients with Parkinson’s disease. J Neurol Neurosurg
Psychiatry 2000;69(1):67-73.
[16] Yan T, Curtin R, Jans M. Trends in income nonresponse over two decades. Journal of Official
Statistics 2010;26(1):145-164.
[17] Dolan P, Gudex C, Kind P, Williams A. The time trade-off method: Results from a general population
study. Health Econ1996;5(2):141–154.
[18] Erreygers G, van Ourti T. Measuring socioeconomic inequality in health, health care and health
financing by means of rank-dependent indices: A recipe for good practice. J Health Econ
[19] Van Doorslaer E, Jones AM. Inequalities in self-reported health: Validation of a new approach to
measurement. J Health Econ 2003;22:61–87.
[20] Cubí-Mollá P, Herrero C. Quality of life lost to non-fatal road traffic injuries. Health Econ
2012;21(5):528-550.
[21] Office for National Statistics (2011). Happiness measured 2011. Available at:
https://docs.google.com/spreadsheet/ccc?key=0AonYZs4MzlZbdDBwREJDT0lqZzJuY0dSbklD
ZDY1TVE#gid=25 [Accessed 21 July 2013].
[22] Parkin D, Devlin N, Feng Y. What determines the shape of an EQ-5D index distribution? Paper
presented at the Health Economics Research Group meeting. University of Exeter Medical School. 9-11
January 2013.
[23] Ferrer-i-Carbonell A, Frijters P. How important is methodology for the estimates of the determinants
of happiness? Econ J 2004;114(497):641-659.
[24] Blanchflower DG, Oswald AJ. Is well-being U-shaped over the life cycle? Soc Sci Med
2008;66(8):1733-1749.
[25] Brazier JE, Yang Y, Tsuchiya A, Rowen DL. A review of studies mapping (or cross walking)
non-preference based measures of health to generic non-preference-based measures. Eur J Health Econ
Table 1. Summary descriptive statistics for control variables
Years since diagnosed Ref N %
less than 5 years * 198 47.5%
6–10 years 198 27.3%
11–15 years 198 15.7%
16–20 years 198 6.1%
more than 20 years 198 3.5%
Age
41-50 * 198 4.0%
51-60 198 15.2%
61-70 198 34.3%
71 or older 198 46.5%
Gender
male 196 60.2%
Education
beyond leaving school 195 67.7%
Household (with whom do you live?)
alone * 197 17.8%
with partner/spouse 197 76.2% with other family members 197 3.6%
Figure 1. Histograms of EQ-5D index, EQ-VAS and SWB scores º 0 .0 0 5 .0 1 .0 1 5 .0 2 .0 2 5 D e n si ty
0 20 40 60 80 100
EQVAS EQ-VAS 0 .5 1 1 .5 2 D e n si ty
-.5 0 .5 1
EQ5DTTO EQ-5D TTO index
0 .0 5 .1 .1 5 .2 .2 5 D e n si ty
0 2 4 6 8 10
SWB LifeSat SWB 1 - Life satisfaction
0 .1 .2 .3 D e n si ty
0 2 4 6 8 10
SWB worthwhile SWB 2 - Life worthwhile
0 .0 5 .1 .1 5 .2 .2 5 D e n si ty
0 2 4 6 8 10
SWB Happy SWB 3 - Happiness
0 .0 5 .1 .1 5 .2 D e n si ty
0 2 4 6 8 10
Table 2. Distribution of EQ-5D responses by dimension and level
EQ-5D profile No problems
(1)
Some problems (2)
Extreme
problems (3) Total
Mobility 45 (23%) 150 (76%) 1 (1%) 196 (100%)
Self-care 100 (51%) 92 (46%) 5 (3%) 197 (100%)
Usual activities 35 (18%) 150 (76%) 12 (6%) 197 (100%)
Pain / Discomfort 53 (27%) 126 (64%) 18 (9%) 197 (100%)
Table 3. Summary descriptive statistics for SWB, EQ-5D index and EQ-VAS in PD survey respondents and general UK population
PD Survey Respondents
ONS IHS Respondents
Variable Obs Mean (sd) Obs Mean (sd)
Life satisfaction 195 6.22 (1.96) 4,166 7.4 (2.0)
Life worthwhile 194 6.58 (2.08) 4,163 7.6 (1.9)
Happy yesterday 195 6.55 (2.16) 4,168 7.4 (2.3)
Anxious yesterday 195 3.98 (2.51) 4,162 3.4 (3.0)
EQ-VAS 190 62.92 (18.89)
APPENDICES
Dependent variable: SWB1
(Life satisfaction)
SWB1 continuous SWB1 categorical
OLS Normal OLS LogNormal OPM
HRQoL measures used as covariates
EQ-5D EQ-5D TTO index EQ-VAS EQ-5D and EQ-VAS EQ-5D EQ-5D TTO index EQ VAS EQ-5D and EQ-VAS EQ-5D EQ-5D TTO index EQ VAS EQ-5D and EQ-VAS
EQ-5D usual act = 3 -1.082 -0.757 0.182 0.082 -0.727 -0.575
-1.85 -1.55 -1.2 -0.66 (2.04)* -1.7
[image:26.842.38.800.51.475.2]EQ-5D pain/disc = 3 -1.154 -0.084 0.378 0.081 -0.7 -0.018
(2.47)* -0.17 (3.56)** -0.65 (2.36)* -0.05
EQ-5D anx/dep = 2 -0.955 -0.581 0.297 0.193 -0.675 -0.494
(3.41)** (2.27)* (3.67)** (2.69)** (3.75)** (2.72)**
EQ-5D anx/dep = 3 -0.953 -0.147 0.475 0.232 -0.6 -0.059
-1.16 -0.17 (3.62)** (2.20)* -1.15 -0.1
EQ VAS 0.06 0.053 -0.018 -0.016 0.043 0.04
(8.45)** (5.63)** (9.39)** (6.21)** (6.14)** (5.03)**
EQ-5D TTO tariff 2.843 -0.816 1.711
(6.23)** (7.91)** (5.22)**
Live with partner/spouse 0.796 0.92 0.709 0.705 -0.154 -0.186 -0.121 -0.117 0.471 0.532 0.452 0.45
(2.06)* (2.44)* -1.88 -1.85 -1.59 (2.01)* -1.38 -1.32 (2.21)* (2.60)** (2.07)* (2.03)*
Live in care home -3.035 -1.778 -1.534 -1.699 0.359 0.167 0.072 -0.048 -1.807 -0.953 -0.913 -1.096
(3.89)** (3.63)** (2.69)** (2.21)* -1.68 -1.34 -0.38 -0.23 (3.44)** (2.44)* -1.65 -1.75
6-10 years diagnosed -0.297 -0.567 -0.497 -0.337 0.063 0.118 0.097 0.074 -0.187 -0.354 -0.351 -0.238
-1 -1.87 -1.94 -1.25 -0.78 -1.45 -1.47 -1.05 -1.04 (2.01)* (2.03)* -1.28
Constant 6.77 3.301 1.63 2.71 1.01 1.983 2.459 2.196
(9.31)** (4.63)** (2.33)* (2.92)** (4.03)** (9.30)** (12.80)** (7.74)**
Observations 188 188 183 180 183 183 178 175 188 188 183 180
R-squared 0.36 0.29 0.45 0.49 0.35 0.29 0.49 0.53
Pseudo-R2 0.11 0.08 0.15 0.17
RESET (*) ok ok ok ok ok ok Missp Missp ok ok Missp ok
Normal dist. residuals (+) R R R R R R NR NR
SWB2 continuous SWB2 categorical
OLS Normal OLS LogNormal OPM
HRQoL measures used as covariates Dependent variable: SWB2 (Life worthwhile) EQ-5D EQ-5D TTO index EQ VAS EQ-5D and EQ-VAS
EQ-5D EQ-5D TTO
index EQ VAS
EQ-5D and EQ-VAS EQ-5D EQ-5D TTO index EQ VAS EQ-5D and EQ-VAS
EQ-5D mob = 3 -2.37 -1.051 0.567 0.185 -1.184 -0.524
(2.53)* -1.05 (2.17)* -0.68 (2.22)* -0.86
EQ-5D anx/dep = 2 -1.016 -0.736 0.215 0.154 -0.581 -0.458
(3.18)** (2.32)* (2.18)* -1.55 (3.24)** (2.44)*
EQ-5D anx/dep = 3 -1.474 -0.613 0.431 0.252 -0.856 -0.421
-1.78 -0.67 (2.25)* -1.23 -1.69 -0.72
EQ VAS 0.05 0.044 -0.014 -0.012 0.03 0.027
(6.28)** (4.02)** (5.62)** (3.40)** (5.39)** (3.90)**
EQ-5D TTO tariff 2.208 -0.662 1.203
(3.87)** (4.27)** (3.72)**
age51_60 1.366 1.456 0.793 0.799 -0.643 -0.675 -0.338 -0.448 0.77 0.78 0.439 0.474
-1.89 (1.98)* -1.23 -1.08 (3.63)** (4.02)** -1.58 (2.11)* -1.74 -1.73 -1.05 -0.98
age61_70 0.369 0.451 0.013 -0.065 -0.319 -0.354 -0.069 -0.162 0.133 0.173 -0.086 -0.123
-0.53 -0.63 -0.02 -0.1 (2.07)* (2.44)* -0.38 -0.93 -0.32 -0.4 -0.23 -0.27
age71_ 0.352 0.545 -0.058 -0.118 -0.325 -0.373 -0.06 -0.157 0.075 0.189 -0.165 -0.209
-0.49 -0.77 -0.1 -0.17 (2.12)* (2.66)** -0.34 -0.92 -0.17 -0.44 -0.44 -0.46
Live with partner/spouse
[image:27.842.31.816.64.462.2]0.85 1.009 0.724 0.697 -0.231 -0.249 -0.173 -0.188 0.514 0.577 0.453 0.457
(2.16)* (2.53)* (1.98)* -1.82 (2.16)* (2.33)* -1.8 -1.84 (2.49)* (2.88)** (2.31)* (2.17)*
Live with othe family members
1.221 1.05 0.617 0.818 -0.561 -0.519 -0.342 -0.421 0.752 0.624 0.418 0.565
-1.86 -1.37 -0.91 -1.21 (2.81)** (2.31)* -1.66 (2.14)* (2.10)* -1.52 -1.11 -1.48
Live in care home -4.921 -3.019 -2.699 -3.081 0.755 0.454 0.392 0.41 -3.9 -2.428 -2.517 -2.76
(4.97)** (4.77)** (4.63)** (3.34)** (2.94)** (2.47)* -1.85 -1.59 (4.40)** (3.57)** (4.05)** (3.45)**
16-20 years diagnosed
-0.74 -0.388 -0.609 -0.729 0.293 0.258 0.2 0.234 -0.433 -0.171 -0.37 -0.46
-1.48 -0.61 -1.26 -1.52 (2.00)* -1.69 -1.46 -1.64 -1.62 -0.49 -1.48 -1.73
Constant 7.111 4.253 3.173 4.021 1.225 2.013 2.163 1.98
(8.08)** (5.29)** (4.01)** (3.63)** (5.65)** (11.27)** (9.55)** (6.08)**
Observations 187 187 182 179 178 178 173 171 187 187 182 179
R-squared 0.32 0.24 0.36 0.41 0.28 0.24 0.32 0.36
Pseudo-R2 0.1 0.07 0.11 0.13
RESET (*) ok ok ok ok ok ok ok ok ok Missp ok ok
Normal dist residuals (+) NR NR NR NR NR R NR NR
Table A2.Model results for “life worthwhile”. (*) The Ramsey RESET test has been used as a diagnostic test for the correctness of the functional form (“ok” if the test has not detected misspecification, “Missp” otherwise). (+) “Normal dist residuals” shows the results of a test to check the
SWB3 continuous SWB3 categorical
OLS Normal OLS LogNormal OPM
HRQoL measures used as covariates Dependent variable: SWB3 (Happiness) EQ-5D EQ-5D TTO index EQ VAS EQ-5D and EQ-VAS EQ-5D EQ-5D TTO index EQ VAS EQ-5D and EQ-VAS EQ-5D EQ-5D TTO index EQ VAS EQ-5D and EQ-VAS
EQ-5D mob = 3 -2.442 -1.453 0.649 0.348 -1.278 -0.792
(2.51)* -1.42 (2.31)* -1.2 (2.46)* -1.35
EQ-5D anx/dep = 2 -1.547 -1.126 0.459 0.353 -0.892 -0.74
(5.02)** (3.94)** (4.56)** (3.69)** (5.11)** (4.00)**
EQ-5D anx/dep = 3 -2.119 -1.266 0.528 0.286 -1.189 -0.757
(2.59)* -1.57 (2.19)* -1.19 (2.85)** -1.69
EQ VAS 0.06 0.056 -0.017 -0.016 0.035 0.035
(7.94)** (5.86)** (7.67)** (6.23)** (7.11)** (5.97)**
EQ-5D TTO tariff 2.459 -0.669 1.249
(4.08)** (3.73)** (3.90)**
age51_60 1.308 1.635 0.909 0.918 -0.328 -0.415 -0.252 -0.163 0.712 0.823 0.378 0.527
-1.82 (2.10)* -1.22 -1.21 -1.41 -1.64 -0.94 -0.66 -1.89 (2.11)* -0.78 -1.2
Live in care home -3.223 -1.993 -1.657 -1.345 0.442 0.357 0.228 0.09 -1.815 -0.921 -0.799 -0.677
(2.91)** (2.36)* (2.79)** -1.32 -1.69 -1.96 -1.25 -0.34 (2.84)** (2.16)* (2.18)* -1.1
Between 16 and 20 years diagnosed -1.209 -0.821 -1.079 -1.214 0.369 0.322 0.261 0.317 -0.604 -0.355 -0.597 -0.714
(2.07)* -1.05 -1.87 (2.09)* (2.93)** (2.06)* -1.89 (2.55)* (2.13)* -0.9 (2.08)* (2.42)*
Constant 7.201 3.848 2.207 2.803 0.842 1.706 2.252 2.033
(8.48)** (4.19)** (2.35)* (2.48)* (3.27)** (6.45)** (7.71)** (6.17)**
Observations 188 188 183 180 181 181 176 174 188 188 183 180
R-squared 0.3 0.19 0.36 0.42 0.29 0.18 0.34 0.42
Pseudo-R2 0.09 0.05 0.1 0.13
RESET (*) ok ok ok ok ok ok Missp ok ok ok ok ok
[image:28.842.34.813.76.422.2]Normal dist residuals R R NR NR NR NR NR NR
SWB4 continuous SWB4 categorical
OLS Normal OLS LogNormal OPM
HRQoL measures used as covariates
Dependent variable: SWB4 (Anxiety) EQ-5D EQ-5D TTO index EQ VAS EQ-5D and EQ-VAS EQ-5D EQ-5D TTO index EQ VAS EQ-5D and EQ-VAS EQ-5D EQ-5D TTO index EQ VAS EQ-5D and EQ-VAS
EQ-5D self care = 3 -3.001 -2.795 -0.931 -1.043 -2.603 -2.469
(4.54)** (4.12)** (2.54)* (2.80)** (4.97)** (4.89)**
EQ-5D usual act = 2 1.043 1.097 0.352 0.376 0.565 0.593
(2.35)* (2.40)* (2.36)* (2.46)* (2.54)* (2.60)**
EQ-5D usual act = 3 2.144 2.22 0.7 0.74 1.199 1.232
(3.04)** (2.81)** (3.15)** (3.08)** (3.11)** (2.94)**
EQ-5D anx/dep = 2 2.238 2.149 0.492 0.471 1.098 1.049
(5.95)** (5.36)** (4.93)** (4.34)** (5.33)** (4.84)**
EQ-5D anx/dep = 3 3.961 4.309 0.788 0.863 2.091 2.261
(4.70)** (5.13)** (4.35)** (4.76)** (4.62)** (4.84)**
EQ VAS -0.042 -0.011 -0.008 -0.002 -0.019 -0.006
(3.87)** -0.89 (2.94)** -0.65 (4.00)** -1.06
EQ-5D TTO tariff -2.99 -0.784 -1.313
(3.76)** (4.54)** (3.54)**
Live with partner/spouse -0.161 -0.54 -0.198 -0.119 -0.245 -0.317 -0.233 -0.23 -0.076 -0.24 -0.089 -0.057
-0.32 -0.89 -0.33 -0.23 (2.28)* (2.58)* -1.83 (2.07)* -0.3 -0.89 -0.34 -0.22
Live in care home 2.964 0.904 1.613 2.668 0.575 -0.096 0.175 0.634 2.149 0.339 0.593 1.96
(2.75)** -0.98 (1.98)* (2.20)* -1.91 -0.52 -0.95 -1.96 (3.37)** -0.81 -1.59 (3.12)**
More than 20 years diagnosed -1.857 -1.538 -0.011 -1.774 -0.087 0.115 0.405 -0.07 -1.097 -0.779 -0.06 -1.049
(2.14)* -1.28 -0.01 -1.98 -0.63 -0.54 -1.68 -0.46 (2.03)* -1.32 -0.1 -1.91
Constant 0.934 5.85 6.538 2.231 0.897 2.046 2.132 1.134
-1.11 (5.68)** (6.04)** -1.77 (4.11)** (8.47)** (8.10)** (3.14)**
Observations 188 188 183 180 169 169 164 162 188 188 183 180
R-squared 0.38 0.14 0.13 0.4 0.34 0.16 0.12 0.36
Pseudo-R2 0.11 0.03 0.03 0.11
RESET (*) ok ok ok ok ok Missp ok ok ok ok ok ok
[image:29.842.44.773.75.498.2]Normal dist residuals NR R R NR R R R R
Table A4.Model results for ‘anxiety’. (*) The Ramsey RESET test has been used as a diagnostic test for the correctness of the functional form (“ok”