Active Distribution Power System with Multi-terminal MVDC
Links
Dong Chen, Lie Xu and Wendian Zhang
Department of Electrical Engineering, Strathcldye University,UK [email protected]
[email protected] [email protected]
Keywords: Active distribution power system; DC power system; voltage source converter; AC fault
Abstract
An active distribution power system with multi-terminal MVDC links is investigated in this paper. A sample system is established with 3 terminal MVDC links, which connect charging station and feeders. This active distribution power system benefits from a more flexible power flow control with high penetration of distributed generation and limited fault current. Simulation results using Matlab/Simulink are provided to validate the system performance during fault.
1 Introduction
The development of renewable power generation [13] and advance of Electric Vehicle (EV) [1] are changing the configuration of the traditional distribution power system. Renewable power, such as wind [14] and solar [8], are naturally dispersed and compatible for distribution side. The advantage of such distributed generation is obvious, the power are more likely to be consumed locally hence no transmission loss. Comparing with centralised renewable generation, which are normally far away from load centre, there is no need to build up extra transmission corridor [10] for distributed generations. The problem of distributed generations is that they are intermittent sources. Therefore possible mismatch between loads and generations would cause overvoltage within distributed networks [11]. The potential demand from the electric vehicle battery charging can seriously challenge the distribution network as the charging load can be much larger than conventional housing and commercial appliances. With random charging demand from EV, overloading could be the major potential problem for such distribution systems [6]. One way to solve this problem is to build up centralised charging stations with a predefined energy management scheme and integrate them into the existing power system in a proper way.
In order to reduce the distribution loss and enhance power supply reliability, the concept of active distribution power system is proposed with hard load switch spread among certain feeders [9]. Such reconfigurable distribution power system can actively change power flow by switching the ties between the feeders, hence the possibility of power flow optimization. A variety of management methods have been
proposed for optimized power flow management based on hard switches [2][12]. However, the employment of hard switches forces the voltages across matches, which means that the flexibility of power flow control is limited since the real time power flow is actually passively determined by the impedances of a certain configuration.
Though radial topology is most commonly used in distribution network for its simplicity feature [5], mesh topology is now suggested to enhance power supply reliability and load ability with higher penetration of DG and EV charging demand. By closing some normal open switches in a traditional active distribution power system, a meshed topology of distribution power system can be formed. However, the consequent problem is that the closing of normal open switches increases the fault current during short transients, which could possibly undermine the existing protection and relay system.
In order to deal with the challenge brought by higher DG and EV penetration to distribution power system, DC links are introduced in distribution power system level, which benefits from more flexible and fast power flow control [4][7] without significant contribution to fault current. In this paper a three-terminal DC links is proposed to insert into a typical distribution power system. Apart from the fore cited benefits, the system also benefits from its excellent and flexible capability of power supply restoration after a fault. Such hybrid distribution power system is able to employ the battery array of the charging station within the DC network for temporary power supply.
This paper is organized as follows. System modelling is introduced in Section 2 and the specific operational schemes are described in Section 3. Case study is then performed in Section 4 and finally the conclusion is drawn in Section 5.
2 System modelling
Two kinds of distributed generation (DG) are considered – converter interfaced and synchronous generators. The converter interfaced models are proposed for distributed renewable sources. They are supposed to be able to export power to the grid independently with close loop power control as is shown in Figure. 1. As shown, the renewable DG control concerns an outer MPPT. The dynamics of current loop is assumed as an ideal controllable current source with first order delay for simplicity. Such sources are assumed to be able limit its current during a fault with current limiting capability. The synchronous machines, on the other hand, are modelled as a controllable voltage source connected to the AC network via impedances.
P
Q
Id calculation
dq/abc
ia
ib
ic PLL
uabc
MPPT
Current Limiting
Iq calculation
id
iq
θ ||u||
1 1T sd
[image:2.595.346.501.96.522.2]1 1T sd
Figure 1: Control scheme of converter interfaced DG
iabc
abc/dq
PI ud
uq Current
Limiting
id
iq PI
-PLL
θ +
-+ idref
+ + iqref
dq/αβ
Driving Pulse
SVPWM
[image:2.595.45.292.246.308.2]uabc
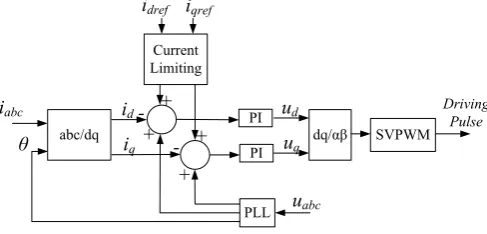
Figure 2: Current control scheme of VSC
As the paper concerns transient behaviour of power system, a detailed switching model is used in voltage source converter with standard current control as depicted in Figure. 2. Current limiting block is applied to limit current within the switching device rating.
Based on the modelling principles cited above, a benchmark distribution power system is established by modifying an established model [7] (with distribution line impedances unchanged) and the single line diagram is demonstrated as is shown in Figures 3 (a) and (b), where an extra AC link is added between Feeders 8 and 14 in Figure 3(a) and a DC network is employed to replace the AC link for comparison. Distributed generation, including both full-power converter-interfaced and direct coupled synchronous generator, and loads are integrated at certain feeders. A medium voltage DC power system is injected into the distribution power system between Feeders 8 and 14 with galvanic isolated Voltage Source Converter (VSC). A charging station in the medium voltage DC system is modelled as a controllable DC current source. The DC distribution line impedance is assumed to be negligible in this paper for simplification. Circuit breaker (recloser) is placed at the downstream side of each feeder.
132/33 20
kV MVA Transmission Grid
132/33 20
kV MVA
Circuit breaker 1
13
14 2
3
4
5
6 7 8
9 10
11 AC link
12
(a) With extra AC link
132/33 20
kV MVA
Charging Station VSC 1
VSC 2 Transmission Grid
132/33 20
kV MVA
Circuit breaker
DC network
1
13
14 2
3
4
5
6 7 8
9 10 11
12
(b) With extra DC link
Figure 3: Benchmark model of distribution power system
3 Operational Scheme
During steady state, the distribution power system operates with a centralised control. The amount of power of one VSC terminal is determined by the distribution power system operator.
[image:2.595.44.288.348.465.2]to be defined for the charging station converter and other VSCs.
3.1 Voltage source converter
A predefined VSC is able to operate in both current/power control and AC voltage control mode. The DC and AC voltage control of VSC can be carried out as Figure 4 shows. As shown, when a VSC is employed to control the DC voltage, a PI regulator is used to eliminate the difference between the reference DC voltage Vdcref and Vdc. The output
reference current in d-axis is fed to the current control shown in Figure 2. The control scheme of AC voltage control is shown Figure 4(b), where Vdref and Vqref are the reference
values of the dq AC voltage components and ωref is the
reference frequency. PI regulators are used here to produce the reference values of dq current components in Figure 2. And the VSC is also able to provide active resynchronization when there is a need to reconnect the AC island to the established utility side and the control scheme is depicted in Figure 4(c), where the difference between utility side voltage angle θ1 and island side angle θ2 across the switch is passed to
a PI regulator to produce the frequency correction to eliminate the angular difference.
-+ Vdcref
Vdc
PI idref
(a) DC voltage control mode
-+ Vdref
Vd
PI idref
-+ Vqref
Vq
PI iqref
abc/dq Vabc θ
1
Z Z
ωref
(b) AC voltage control mode
+ +
ωn
PI ωref
-+ θ1
θ2
Δω
(c) Resynchronization control
Figure 4: Voltage control of VSC
P
ESS 1U
i
ESS(a) Power terminal mode
-+
Vdcref
Vdc
PI iESS
(b) Slack terminal mode
Figure 5: Operational mode of charging station
3.2 Charging station DC/DC converter
As the charging station is able to manage its own storage energy and provide temporary power supply to the distribution power system, two modes are considered during normal operation, which correspond to the power terminal operation and slack terminal operation in a DC power system, as is shown in Figure 5.
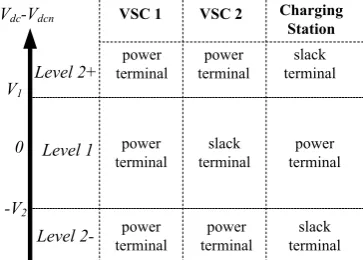
3.3 The control scheme of DC power system
Vdc-Vdcn
0 V1
-V2
VSC 1 VSC 2 Charging Station
slack terminal
slack terminal slack
terminal power
terminal
power terminal power terminal
power terminal
Level 1
Level
2-Level 2+ terminalpower
[image:3.595.337.519.215.345.2]power terminal
Figure 6: DC power system control scheme
A voltage variation based autonomous control scheme is proposed for the MVDC subsystem, which is shown in Figure 6. The DC power system has to have at least one live slack terminal to ensure stable operation. In this paper, VSC 1 is responsible to respond to the power distribution order given by the distribution system operator and it operates at power control mode throughout steady state. When there is a fault at the AC side, VSC 1 may need to operate at current limit mode to ride through the fault. VSC 2 acts as the slack terminal during steady state operation, accommodating the power transferring through VSC 1 and the power demand from the charging station.
[image:3.595.102.231.367.595.2]4 Case study
4.1 Faulty current in distribution power system without DC links
Based on a modified benchmark system demonstrated in Figure 3(a), a comparison case study is carried out to demonstrate the transient behaviour of the distribution power system after a 3-phase fault between Feeders 12 and 13 shown in Figure 3(a).
Ifabc
/k
A
I12ab
c
/k
A
I13ab
c
/k
A
I14ab
c
/k
A
V13
ab
c
/k
V
-50 0 50
-200 20
-20 0 20
-20 0 20
0 0.1 0.2 0.3 0.4
-20 0 20
T/s
(a) without link between Feeders 8 and 14
-50 0 50
-200 20
-200 20
-200 20
0 0.1 0.2 0.3 0.4
-200 20
I
fabc/k
A
I
12abc
/k
A
I
13abc
/k
A
I
14abc
/k
A
V
13ab
c
/k
V
T/s
[image:4.595.64.274.212.436.2](b) with AC link between Feeders 8 and 14
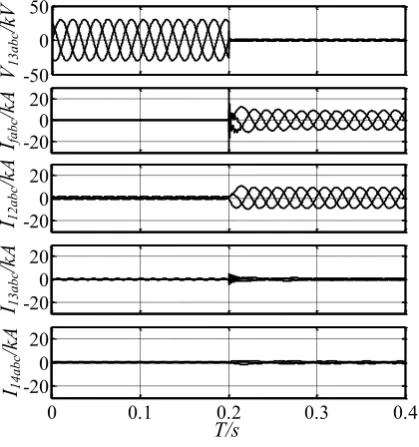
Figure 7: Fault current without DC linkFigures
7(a) and (b) shows the system transient behaviours with and without AC links between Feeders 8 and 14 respectively. The
system starts from steady state operation from T = 0 s. At T = 0.2 s, a 3-phase short occurs between Feeders 12 and 13.
When there is no link between Feeders 8 and 14, as shown in Figure 7 (a), the fault current Ifabc, which flows into the faulty
point, rises up immediately and the fault current reaches approximately 10 kA. Meanwhile, the fault current flowing through Feeder 12, I12abc, has similar magnitude as the total
fault current. The fault current of I13abc and I14abc from Feeder
13 and DG14 are comparably small as their fault current mainly comes from the synchronous machine based DG at Feeder 14.
When Feeders 8 and 14 are directly coupled with an AC link, the fault simulation is shown in Figure 7(b), where the total fault current almost twice as much as the one without link. It can be seem that the fault current I12abc is generally similar to
Figure 7(a), yet the current of I13abc is much larger due to the
fault current from the transmission grid along with the DG sources within the distribution system via the injected AC link.
From the test shown in Figure 7, it can be inferred that the fault current of the distribution system can be significantly enlarged if the radial topology is transformed into a ring or meshed configuration via direct AC link as the equivalent impedance to the fault point can be significantly decreased.
4.2 System operation of a distribution power system with multi-terminal DC links
In order to demonstrate the advantage of the power supply restoration and to validate the proposed control scheme for DC links, simulation is carried out to test transient behaviour of the system after the fault. The specific actions are described in Table 1. After a 3-phase fault at the distribution line, the circuit breaker will isolate the fault according to the fault current detection. The protections, relays and communication delays are assumed to be ideal in this test according to Table I.
No. Time (s)
Fault Event Reaction of DC link system
0.0 Power control for VSC 1; DC voltage control for VSC 2; Charging station in power terminal mode
① 0.1 3-phase fault between Feeder12 and 13
VSC 1 and 2 in low voltage operation; Charging station ready to operate in slack terminal mode
② 0.2 CB-13 Open; DG-14 tripped; VSC 2
in AC voltage mode;
③ 0.3 CB-12 Open
④ 0.4 Fault Cleared
⑤ 0.5 CB-12 reclose; VSC 2 start to
resynchronize Feeders 12 and 13
⑥ 0.7 CB-13 reclose; VSC 2 takes over DC
[image:4.595.62.274.212.677.2]voltage control; Charging station ready to switch to power terminal mode
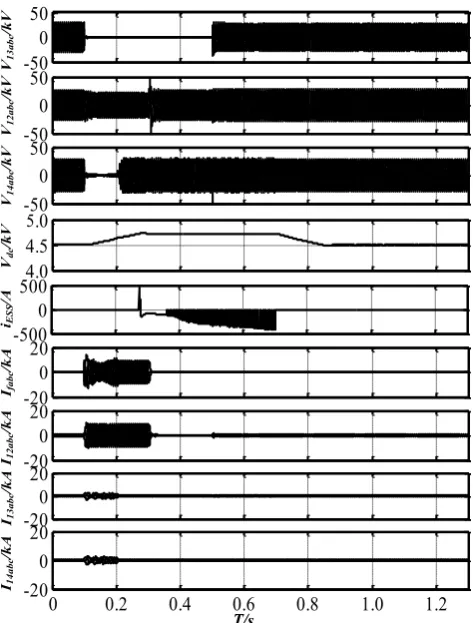
[image:4.595.61.273.459.682.2] [image:4.595.306.552.549.724.2]The test results are shown in Figure 8. The system starts from steady state operation with VSC 1 operation in power control mode and VSC 2 in DC voltage control mode. The feeder phase voltages of V12abc, V13abc and V14abc are at normal
adjacencies of the nominal voltage of the distribution system. The charging station operates in power terminal mode and in this case, its output current iESS is 0 for simplification. The DC
voltage Vdc is at its nominal voltage during steady state. The
current flowing through CB-12 and CB-13, I12abc and I13abc ,
are with normal value before a 3-phase fault occurs. And so is the DG-14 current.
-50 0 50
-50 0 50
-50 0 50
4.0 4.5 4.0
-500 0 500
-20 0 20
-20 0 20
-20 0 20
0 0.2 0.4 0.6 0.8 1.0 1.2
-20 0 20
V13
ab
c
/k
V
V12
ab
c
/k
V
V14
ab
c
/k
V
Vdc
/k
V
iES
S
/A
Ifabc
/k
A
I12ab
c
/k
A
I13ab
c
/k
A
I14ab
c
/k
A
T/s
[image:5.595.52.289.219.531.2]5
Figure 8: System behaviour with multi-terminal DC link
At the time point of T = 0.2 s, a 3-phase fault occurs between Feeder 12 and 13 (with close adjacency of Feeder 13). The
V13abc drops to almost 0. Both V12abc and V14abc drops as well
with V14abc lower as it is more close to the fault point. Large
fault current Ifabc , approximately 12 kA, can be seen flowing
into the fault point with most contribution from
I12abc ,approximately 10 kA, from the transmission grid side
and minor contribution from DG14 I14abc and the DC link side
I13abc. This behaviour is similar to the case when there is no
link between Feeder 14 and 8. The fault current demonstrated in this test slightly higher than that of the original configuration shown in Figure 7 (a) but much lower than AC link based system in Figure 7 (b). The extra fault current is limited in that the fault current from the link is well harnessed by the VSC 2. During the fault transient, both VSCs are operating in low voltage conditions and VSC 2 is more severe as it is closer to the fault. As a result, VSC 2 starts to be
incapable to accommodate the power transfer from VSC 1. The charging station, as is designed in Figure 6, consequently becomes power terminal shortly after the fault Then Vdc starts
to deviate from its nominal value of 4.5 kV at T = 0.11 s and rises up since the power imported from the VSC 1 side build up the power surplus of the DC system. When the Vdc deviates
to more than 105% of the nominal voltage, the charging station take over the DC voltage control to settle the DC voltage at 4.725 kV. In other word, the power difference between VSC 1 and 2 are accommodated by the charging station during the fault transient.
At T = 0.2 s, CB-13 is open upon the detection of the local fault current and 14 tripped so the fault current from DG-14 becomes 0 and fault current are solely from the Feeder 12. VSC 2 switches to AC voltage mode from current limit mode. The Feeder 14 side becomes an AC island, which is supported by VSC 2. Feeder 14 power supply is restored.
At T = 0.3 s, CB-14 is open. The fault is isolated on both sides. The pulse current results from the low voltage ride through operation of VSC 1 when it is still trying to import power in a ramp rate.
At T = 0.4 s, the fault is cleared.
At T = 0.5 s, CB-12 is reclosed. Feeder 13 is re-energized. Upon detecting that the voltage of Feeder 13 return to normal condition, VSC 2 starts to re-synchronize the voltages on Feeders 13 and 14.
At T = 0.7 s, CB-13 is reclosed. The system goes back to its normal steady state operation. VSC 2 switches back to operate in DC voltage control mode again. It starts to push the Vdc back to its nominal value. The charging station current
consequently returns back to 0, as it is before the fault.
In this test, the actions of protections and communication delays are assumed to be ideal and the resynchronization process could be longer due to practical communication delay. Even though, this test shows that a fast power supply restoration can be achieved for an AC power supply island with the multi-terminal MVDC link with insignificant additional fault current.
5 Conclusion
Acknowledgements
This work was supported in part by the UK Engineering and Physical Sciences Research Council: Grant EP/K03619X/1.
References
[1] C.C. Chan. “An overview of electric vehicle technology”, Proceedings of the IEEE, volume 81, no.9, pp. 1202-1213, (1993).
[2] C. C. Liu, S. J. Lee, K. Vu, “Loss minimization of distribution feeders: optimality and algorithms”, IEEE Transactions on Power Delivery., volume 4, no. 2, pp.1281 -1289, (1989)
[3] D. Chen, L. Xu, L. Yao, “DC voltage variation based autonomous control of DC microgrids”, IEEE Transactions on Power Delivery, volume 28, no. 2, pp.637 -647, (2013).
[4] J. Alcala, V. Cardenas, J. Perez-Ramirez, R.J. Betancourt, H. Miranda, “Improving power flow in transformers using a BTB converter to balance low voltage feeders”, Energy Conversion Congress and Exposition (ECCE), pp.2038-2044, (2012).
[5] J. S. Wu , K. L. Tomsovic, C. S. Chen “A heuristic search approach to feeder switching operations for overload, faults, unbalanced flow and maintenance”, IEEE Transactions on Power Delivery, volume 6, no. 4, pp.1579 -1585, (1991)
[6] K. Qian , C. Zhou , M. Allan, Y. Yuan, “Modeling of load demand due to EV battery charging in distribution systems”, IEEE Transactions on Power System., volume 26, no. 2, pp.802 -810, (2011).
[7] M. Barragan, J.M. Mauricio, A. Marano, M. Nieves, C J. hurio, J.M. Maza-Ortega, E. Romero, A. Gomez. “Operational benefits of multiterminal DC-links in active distribution networks”, Power and Energy Society General Meeting, pp.1-6, (2012).
[8] M. Calais, H. Hinz. “A ripple-based maximum power point tracking algorithm for a single-phase grid connected photovoltaic system”, Solar Energy, volume 63, no. 5, pp.277 -282, (1998)
[9] M. E. Baran, F. F. Wu, “Network reconfiguration in distribution system for loss reduction and load balancing”, IEEE Transactions on Power Delivery, volume 4, no. 2, pp.1401 -1407, (1989)
[10] P. Bresesti , W. Kling , R. Hendriks, R. Vailati, “HVDC connection of offshore wind farms to the transmission system”, IEEE Transactions on Energy Conversion, volume 22, no. 1, pp.37 -43, (2007).
[11] P. Chen , R. Salcedo , Q. Zhu , F. D. Leon , D. Czarkowski , Z. P. Jiang , V. Spitsa , Z. Zabar, R. Uosef. “Analysis of voltage profile problems due to the penetration of distributed generation in low-voltage secondary distribution networks”, IEEE Transactions on Power Delivery., volume 27, no. 4, pp.2020 -2028, (2012).
[12] Q. Zhou, D. Shirmohammadi, W. H. E Liu, “Distribution feeder reconfiguration for service restoration and load balancing”, IEEE Transactions on Power System, volume 12, no. 2, pp.724 -729, (1997) [13] R. Lasseter. “MicroGrids”, IEEE PES Winter Meeting,
(2002).
[14] S.K. Salman, A.L.J. Teo, “Windmill modeling consideration and factors influencing the stability of a grid-connected wind power-based embedded generator” Power Systems, IEEE Transactions on Power System, volume 18, no.2, pp.793-802, (2003)
Appendix: model parameters
Un: 33 kV
DC link Capacitance: 50 mF DG-3: 20 kW (converter interfaced) DG-4: 20 kW (converter interfaced) DG-5: 663 kW (converter interfaced) DG-6: 20 kW (converter interfaced) DG-7: 1.5 MW (converter interfaced) DG-8: 20 kW (converter interfaced) DG-9: 242 KW (converter interfaced) 310 KW (converter interfaced) DG-10: 254 kW(converter interfaced) DG-14: 1 MW (synchronous machine) Load-12: 4 MW, 820 kVar