1
Abdullahi Abubakar Mas’ud1*, Brian G. Stewart2, Scott G. McMeekin2 2
Department of Electrical and Electronic Engineering Technology, Jubail Industrial College, KSA1 3
School of Engineering and Built Environment, Glasgow Caledonian University, 70 Cowcaddeens Road, Glasgow, G4 0BA, UK2 4
Email address: [email protected] 5
6
Abstract
7
This paper investigates the sensitivity of statistical fingerprints to different phase resolution 8
(PR) and amplitude bins (AB) sizes of partial discharge (PD) φ-q-n (phase-amplitude-9
number) patterns. In particular, this paper compares the capability of the nsemble neural 10
network (ENN) and the single neural network (SNN) in recognizing and distinguishing 11
different resolution sizes of φ-q-n discharge patterns. The training fingerprints for both the 12
SNN and ENN comprise statistical fingerprints from different φ-q-n measurements. The 13
result shows that there exists statistical distinction for different PR and AB sizes on some of 14
the statistical fingerprints. Additionally, the ENN and SNN outputs change depending on 15
training and testing with different PR and AB sizes. Furthermore, the ENN appears to be 16
more sensitive in recognizing and discriminating the resolution changes when compared with 17
the SNN. Finally, the results are assessed for practical implementation in the power industry 18
and benefits to practitioners in the field are highlighted. 19
Keywords— classification, partial discharge and ensemble neural network, phase
20
resolution and amplitude bin sizes. 21
22 23 24 25 26 27 28
An investigative study into the sensitivity of different
partial discharge
φ
-q-n pattern resolution sizes on
Abbreviations
29
NN neural networks 30
SNN single neural network 31
ENN ensemble neural network 32
PR phase resolution 33
AB amplitude resolution 34
PD partial discharge 35
HV high voltage 36
CI confidence intervals 37
φ-q-n phase-amplitude-number 38
IEC international electrotechnical commission 39
Hn(φ) pulse count distribution
40
Hqn(φ) mean pulse-height
41
Hn(q) amplitude-number
42
DEM dynamically weighted ensemble network 43
DAN dynamically averaged network 44
sk skewness
45
ku kurtosis
46
Q discharge factor
47
cc cross-correlation
48
mcc modified cross-correlation
49
µS average recognition rates of the SNN
50
µE mean of the recognition efficiencies of the ENN
51
σS variance of the recognition efficiencies of the SNN
52
σE variance of the recognition efficiencies of the ENN
53
SEM standard error of the mean 54
σSM SEM of the recognition efficiencies of the SNN
55
σEM SEM of the recognition efficiencies of the ENN
56 57 58
1.
Introduction
59 60
Partial discharge (PD) measurements have been a vital index for evaluating electrical 61
insulation degradation under high voltage (HV) electrical stress. It is important to understand 62
the extent of insulation damage and the nature of an insulation fault through PD measurement 63
for reliable insulation assessment. PD is an electrical discharge that occurs within a localised 64
position of the electrical insulation when the insulation starts to degade [1] . If PD is detected, 65
it is also essential to recognize the nature and extent of the insulation defect, since each 66
particular PD fault has a distinct footprint pattern of discharge behaviour [2,3,4,5]. Over the 67
years, several techniques have been investigated for use in PD pattern recognition. These 68
include the neural network (NN)[1,6,7,8,9], fuzzy logic controllers [10], data mining 69
resonance theory [14]. Such research has recorded successful recognition performance with 71
recognition rates reaching as high as 90% for unseen PD fault examples. Thesuccesful rates 72
eere achieved through several feature extraction techniques when applied to acquire training 73
and testing parameters for the pattern recognition tools. Statistical fingerprints from φ-q-n 74
(phase-amplitude-number) patterns have been the most widely applied measures [1,15] for 75
PD recognition because of their capability for well-defined PD pattern quantification. 76
However, due to the complex nature of PD, coupled with degradation consequences, these 77
statistical fingerprints may show different characteristics over different insulation degradation 78
periods [16]. 79
To improve the reliability and uniqueness of statistical fingerprints in being able to identify 80
PD defects, Gulski and Krivda [1] made significant efforts by establishing 95% mean 81
confidence intervals (CI) for statistical features for classes of several artificially created two 82
electrode PD defects. The statistical mean error tolerances as obtained by Gulski and Krivda 83
were based on fixed PR and AB sizes of the φ-q-n patterns and were determined from a series 84
of measurements ranging from 4 to 23 separate φ-q-n patterns for the same type of PD fault. 85
In this context, the research question is posed in relation to evaluating the sensitivity of 86
statistical fingerprints for different φ-q-n PR and AB changes and how such variations in PR 87
and AB could potentially influence classification outcomes when pattern recognition tools are 88
applied. Moreover, further research is important because different measuring instruments 89
may have different resolution settings for the φ-q-n pattern assessmentand thus training data 90
captured using a different set-up may vary from the actual measurement which may lead to 91
an unreliable classification outcome. 92
In an attempt to address these situations, this paper aims at determining the sensitivity of 93
statistical fingerprints as a function of PR and AB sizes of the φ-q-n patterns. For each 94
statistical fingerprint defining a particular PD defect, statistical 95% mean error tolerances for 95
different resolution sizes are compared, quantified and evaluated. To achieve this, a number 96
of φ-q-n samples (ranging from 40 to 215) for different PD fault scenarios are considered. 97
This is used to quantify the statistical behaviour as a function of PR or AB and provide 98
potentially an improved classification tool since large datasets of the same PD sources are 99
considered. Due to the success of the ensemble neural network (ENN) in classifying PD 100
patterns [15], this paper extensively compares the ENN’s capability with the single neural 101
network (SNN) in classifying and discriminating different resolution sizes of the φ-q-n 102
the statistical error bounds recognition rates of the SNN and ENN for different resolution 104
sizes. 105
106
2.
Experimental set-up and feature extraction
107 108
2.1
Artificially created PD faults
109 110
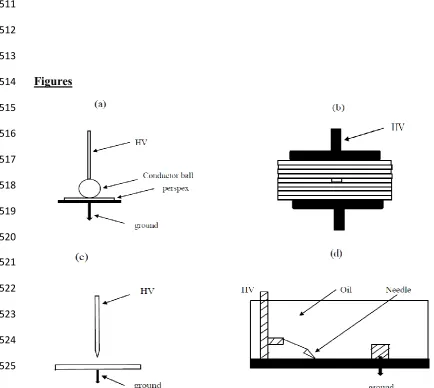
To obtain the PD samples for investigation, four different fault geometries were fabricated in 111
a HV laboratory to simulate PD faults currently occurring in practice (see Fig. 1). These 112
comprise corona in air and oil, surface discharges in air and oil, single voids and an electrode 113
bounded cavity. The corona discharge model is a point-plane arrangement. A needle of length 114
3 cm and tip radius of approximately 10 m is connected to the HV, while an electrode is of 115
60 mm in diameter is connected to the ground. The voids are of 0.6 mm diameter and 50 µm 116
thickness, created at the center of the middle layer of 7 poly-ethylene-terephthalate (PET) 117
samples. The surface discharge in air was simulated by placing a small brass ball of 55 mm 118
diameter on perspex of geometrical size 65 mm x 65 mm x 8 mm. The surface discharge in 119
oil is simulated by a pressboard embedded in a container with Castrol insulating oil [15]. A 120
needle was placed at a predetermined angle to the surface of the pressboard and 45 mm 121
distance from a block earth electrode, also placed on the pressboard surface[17]. Examples of 122
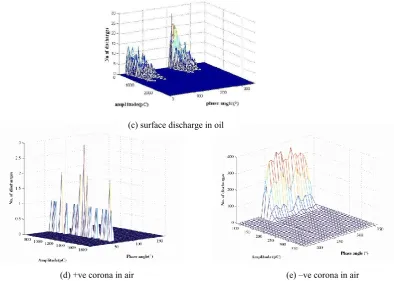
the φ-q-n patterns for several of the considered PD fault geometries are shown in Fig. 2. For 123
corona in air, the positive and negative φ-q-n patterns have been separated for improved 124
visibility of the positive corona discharges characterized by their small repetition rate. 125
Fig 1: Simulated PD faults: a) surface discharge in air, b) single void in PET, c) corona in air 126
and d) surface discharges in oil. 127
The experimental conditions and test φ-q-n samples generated for each PD fault type is 128
shown in Table 1. For each fault, relatively large φ-q-n samples were generated so as to 129
determine reliable 95% mean CI limits for improved evaluation by the SNN and ENN. For 130
corona in air, measurements were taken at several voltages over two gap distances of 5mm 131
and 10mm because of the discharge behaviour of the positive corona discharge which have 132
low repetition rate and higher amplitude [18]. They are then combined to form the φ-q-n 133
corona set for SNN and ENN evaluation. 134
Fig.2: Example of the φ-q-n patterns for the PD faults considered. 135
136
138
2.2 Experimental test arrangement
139
The PD measurement process was performed in accordance with the IEC60270 PD 140
standard[19]. The PD detection system produces a power cycle whioch is used to synchronize 141
real time φ-q-n patterns and possess functions for automatic data logging these patterns at 142
different time periods as well as controlling changes in PR and AB sizes. This is important 143
for the work presented in this paper, as several experiments require longer stressing periods 144
and data is required to be captured and stored systematically over certain resolution size for 145
analysis. PD calibration was carried out for PD apparent charge determination. 146
2.3
Choice of statistical fingerprints for PD analysis
147 148
For φ-q-n evaluation, statistical fingerprints have been widely applied because of their 149
capability for well-defined pattern quantification [1,15]. In order to simplify the φ-q-n 150
analysis, statistical fingerprints are usually extracted from 2D plots derived from the φ-q-n 151
patterns. The key 2D distributions of interest are the pulse count Hn(φ), mean pulse-height 152
Hqn(φ) and amplitude number Hn(q) plots. These plots are presented in both the positive (+)
153
and negative half power cycles (-). 154
155
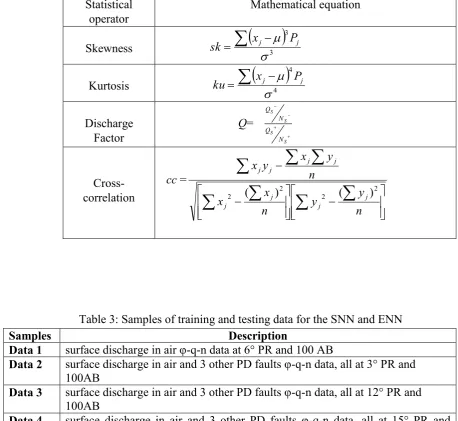
Similar to other literature [4], this paper applies 15 statistical parameters that serve as input 156
fingerprints for training and testing both the ENN and SNN. These include the skewness (sk) 157
and kurtosis (ku) of the Hqn(φ)+, Hqn(φ)-, Hn(q)+, Hn(q)-, Hn(φ)+ and Hn(φ)- distributions, 158
the cross-correlation (cc), discharge factor (Q) and modified cross-correlation (mcc). 159
Definitions of these statistical parameters are available in [1] and their mathematical 160
expressions are shown in Table 2. In this table, µ represents the mean value, σ is the standard 161
deviation, n represents the size of the data and Pj is the probability of the discrete values xj
162
and yj. Q+
s and Q-s represent the sum of discharge magnitudes in the positive and negative
163
half cycles while N+
s and N-s represent the number of discharges in the positive and negative
164
half power cycle. 165
166
Table 2: Mathematical expressions of statistical fingerprints 167
168
3.
Description of the ENN algorithm
An ENN is a learning model comprising a limited number of NNs trained for the same task 171
[20]. The ENN can enhance the generalization performance of the SNN by simply training a 172
number of SNNs and combining their output predictions. Diverse types of ENN architectures 173
have evolved. These include the simplest ENN, The Naive classifier technique, the 174
generalised ENN and the dynamically weighted ensemble method (DEM) [21]. The latter 175
determines the neural network weight at any time the network is estimated and provides the 176
best performance at any instant [21]. The weight is proportional to the certainty of the 177
individual NN prediction and this certainty evaluates how close the output is to any known 178
target value. The prediction of the NN can be regarded to be a probability of any occurrence. 179
For example, assume that b= f (a) is the output of the network and a represents the input 180
variables. If b approaches unity, it is more certain that it belongs to a certain class. When b is 181
close to 0, it is certain that this instance is not in that particular class. The certainty of the NN 182
is computed as follows[10], 183
b b b
c
1 )
( (1) 184
The prediction of the Dynamically Averaged Network (DAN) can be computed as follows: 185
186
(2)
187 188
189 190
where the weights wi are defined based on 191
192
n
j j
j j
a f c
a f c w
1 ( ( )) )) ( (
. (3)
193
194
Figure 3 shows the proposed ENN model for recognition of the PD patterns. The ENN 195
developed in this work comprises several SNN architectures having the same configuration 196
but with different initial parameters. To obtain accurate values of bias and variance [22], the 197
ENN model is trained from bootstrapped resample data. Bootstrap resampling is a criterion 198
employed at the instance when the input fingerprints for the NN are limited. It is 199
implemented so as to have a number of resampled datasets that can be applied as input (i.e. 200
training) fingerprints for several NNs. With this strategy, the resampled datasets have the 201
same dimension as the original dataset in such a way that some samples are replicated while 202
others are discarded. Bootstrap resampling provides an accurate value of the variance and 203
if b ≥ 0.5
otherwise
n
j j j
DAN w f a
f
1
bias of the NN. This technique has been successfully applied to the ENN of various 204
categories of data in the medical and engineering related fields and has demonstrated 205
improved results [20,21,22]. 206
Fig.3: The ENN model. 207
Among the various ENN data aggregation techniques, the dynamically weighted ensemble 208
has been shown to outperform others in different application scenarios, e.g. in Ref [23], and 209
therefore as a consequence this paper applies the same techniques to evaluate the SNN 210
outputs in the ensemble. Six SNNs are applied in this work in order to have a reasonable 211
number of diverse models to improve the generalization. 212
213 214 215
4 PD faults analysis
216
This section presents the results of statistical fingerprint classification sensitivity to different 217
PR and AB resolution sizes of the Hqn(φ)+, Hqn(φ)-, Hn(q)+, Hn(q)-, Hn(φ)+ and Hn(φ
)-218
distributions. In evaluating fingerprints for variable PR the Hn(q) distributions have not been 219
considered because they do not demonstrate any statistical variation. This is expected because 220
PR change only affect the phase bins not the amplitude bins. Similarly when evaluating AB, 221
the Hn(φ) statistics have not been considered. Additionally, the sensitivity of Q, cc and mcc
222
were not considered, because they are found to be insensitive to different resolution sizes. For 223
Q, the mean discharge level is undoubtedly the same for any φ-q-n resolution changes, while 224
for cc the correlation of the positive and the negative half power cycles remain unchanged for 225
φ-q-n resolution variations. 226
227
As an example, the influence of the change in PR and AB sizes on phase and amplitude 228
resolved patterns for surface discharge in air is shown in Fig.4. The φ-q-n patterns were 229
initially captured at 1° PR and 100 AB. Then, two approaches were implemented for data 230
transformation. First, φ-q-n fingerprints were captured at 1° PR and 100 AB over the 360o 231
cycle and transformed to 3°, 6°, 9°, 12° and 15° PR, keeping the AB size constant. Second, 232
based on the transformation of the φ-q-n fingerprint in the first strategy, samples having 6° 233
PR and 100AB are futher transformed to 50 AB and 25 AB, keeping the PR size constant. 234
The plots visually show that as the resolution is varied from 1° to 15° or 100 AB to 25 AB, 235
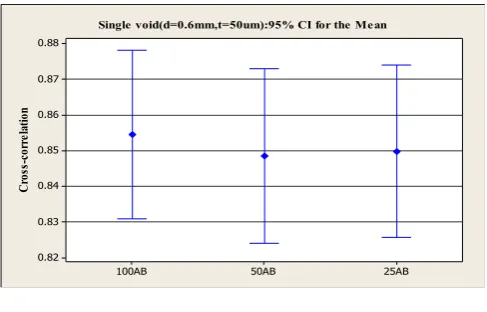
variability of the φ-q-n patterns. For reliable statistical evaluation, 95% CI for different PR 237
and AB sizes were obtained over large φ-q-n samples as summarised in Table 1. As an 238
example, the 95% statistical CIs for air surface discharges and the dielectric bounded void are 239
presented in the Appendix for different PR and AB sizes. 240
241
There are three essential deductions: 242
243
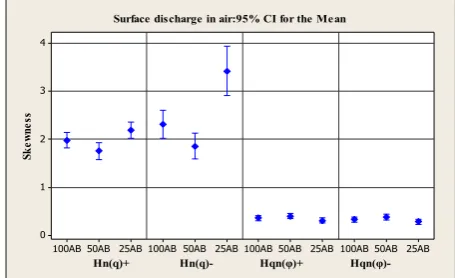
1) The sk and ku mean values and CIs of Hn(q) are more sensitive to different PR sizes than 244
AB sizes when compared to that of the sk and ku of other distributions, e.g. Hn(φ) and 245
Hqn(φ). This is attributed to the Hn(q) distributions becoming increasingly peaked as the AB
246
sizes are reduced. 247
2) The sk and ku mean values and CIs of the Hqn(φ) appear to show higher sensitivity levels 248
to different PR sizes than AB. As the PR increases, PD patterns become flatter across the 249
phase dimension resulting in statistical changes. 250
3) The cc is sensitive to different PR and AB sizes, but no defined variation trend is visible 251
across the various geometries considered. This is due to several factors affecting the cc which 252
varies from one PD fault to the other e.g. the discharge amplitude distribution, flatness and 253
peakedness of the distribution. 254
255
Fig. 4: Processed surface discharge in air patterns. 256
257
5.
Application of the ENN to discriminate different PD φ-q-n resolutions
258 259
5.1 SNN and ENN training and testing approaches
260
To evaluate the robustness of the SNN and ENN in classifying and discriminating the 261
statistical variations for different PR or AB sizes of the φ-q-n patterns, two strategies were 262
implemented: 263
1) Firstly, both the SNN and ENN were trained with the 6° PR, 100 AB captured φ-q-n 264
fingerprints and then tested with the same data, but using 3°, 12° and 15° PR and 100
265
AB. This was to determine the robustness of the SNN and ENN in capturing statistical 266
variations arising from different PRsize of the φ-q-n patterns. 267
2) Secondly, the first strategy was repeated except that the testing was carried out with 269
25AB and 50AB φ-q-n data but all at 6° PR. This aims at determining whether the
270
SNN and ENN can still capture statistical variations that may arise from a different 271
AB resolution of the φ-q-n patterns. 272
273 274
5.2 Statistical merit indicators for comparing the SNN and ENN
275
recognition rates
276
As stated in the literature [22], the major weakness of the SNN lies with its various 277
performance evaluation, when trained with several initial conditions (i.e. weights and biases). 278
To improve the situation, this paper applied statistical measures such as the average, variance 279
and standard error of the mean (SEM) for the SNN and ENN comparison[15].To obtain a 280
certain degree of precision on the classification outcomes and as used in a previous paper, 281
100 iterations were chosen for all statistical determinations[15]. This aims at developing and 282
comparing statistical error bound recognition eficiencies of the SNN and ENN for the various 283
φ-q-n resolution sizes. 284
5.3 Results and discussion
285
Similar to previous research work [1,15,24],statistical measures extracted from φ-q-n 286
fingerprints at different resolution dimensions form the input fingerprints for SNN and ENN 287
evaluation. To classify and discriminate these extracted statistical features, as a case study, 288
this paper considered surface discharge in air patterns as the training set, while testing was 289
carried out with the same surface discharge data and other PD faults of different PR and AB 290
dimensions. Six generated φ-q-n datasets, Data 1 through to Data 6 are shown in Table 3. 291
292
Table 3: Samples of training and testing data for the SNN and ENN 293
294
Both the SNN and ENN were evaluated using statistical data of Data 1, Data 2, Data 3, Data 295
4, Data 5 and Data 6. Each set of fingerprints was composed of a matrix of size 28 rows x 17 296
columns. The first 15 columns were considered to be the input data, while the remaining 2 297
were the output fingerprints. The input fingerprints into the SNN and ENN are the PD 298
samples shown in Table 3, while the output parameters for the PD sample fault are chosen to 299
be [0 1], [1 0], [0 0] and [1 1]. For each PD fault data matrix, 8 rows out of 28 were selected 300
as the testing fingerprints for the SNN and ENN. The ENN configuration is composed of six 301
resampled data. In order to choose the best SNN set-up for the ensemble, the hidden layer, 303
learning and momentum rates were adjusted and optimum parameters chosen for comparison 304
with the SNN with these forming the configurations for the ENN. One hidden layer with 25 305
neurons was selected, having momentum and learning rates of 0.9 and 0.06 respectively. 306
307
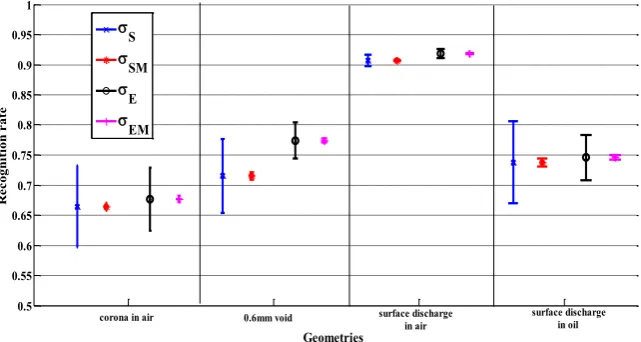
Figs. 5, 6, 7 and 8 show the classification performance of the SNN and ENN when Data 1 is 308
used for training and then testing undertaken with Data 1, Data 2, Data 3 and Data 4 309
respectively. Similarly, Figs. 9 and 10 demonstrate the classification result of the SNN and 310
ENN when Data 1 is used for training and then testing undertaking with Data 5 and Data 6. 311
From these figures, the following information have been deduced: 312
313
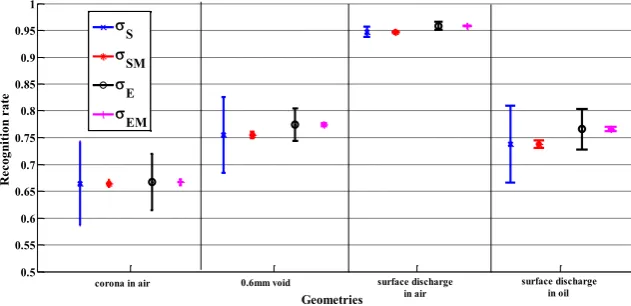
1) When either the SNN or ENN is trained and tested with the same PD fault having the 314
same PR and AB size of the φ-q-n patterns, the ENN shows improved recognition 315
performance over the SNN (see Fig.5). It is obvious that µE, σE and σEM shows higher 316
recognition values than that of µS, σS and σSM. For the SNN and ENN trained with one 317
PD fault and test with another, the ENN does not always produce an improved 318
recognition performance over the SNN. This is clearly demonstrated by the σE and σEM 319
having identical recognition intervals to σS and σSM, but still µE is greater than µS, 320
showing that on average the ENN has an improved recognition result in comparison to 321
the SNN. 322
323
2) For the SNN and ENN trained with surface discharge in air data of one resolution size 324
and then tested with the same data having different resolution sizes (Figs. 6-10), the 325
ENN and SNN both appear to show higher average recognition probability compared to 326
the other PD faults. However, the ENN appears to be better in this case as its variance 327
intervals are always higher than any other tested PD faults (σE and σEM shows higher 328
recognition values than that of the σS and σSM), indicating the ENN’s improved 329
capability to recognize closely similar PD statistical fingerprints. This result implies 330
that even with a change in resolution sizes, it is possible to determine closely similar 331
PD fault scenarios using the SNN and the ENN. 332
333
3) To examine the capabilities of the SNN and ENN in relation to two PR sizes of the φ-q-334
n patternsFigs. 5-8 were evaluated. The most visible change is between Figs. 5 and 8 335
i.e. when the resolution size is changed from 6º to 15º, whilst there is insignificant 336
changed from 6º to 12º or from 6o to 3º. There is basically very little decrease in the 338
values of µS and µE that can be statistically quantified. Comparing Figs. 5 and 8 shows 339
that there is a slight decrease in the values of µS and µE in Fig.8 compared to that of 340
Fig.5, which appears not to be statistically significant. Generally, there is rise in the 341
values of µS, µE, σE, σS, σEM and σSM for untrained PD faults in Fig.8 when compared to 342
these parameters in Fig. 5, but the ENN parameters clearly show a rise in the statistical 343
indicators compared to the SNN. This result implies that the ENN appears to be more 344
sensitive in discriminating the 2 PRs of the φ-q-n patterns, however there exists little 345
variation in the 2 PR φ-q-n patterns applied for training and testing both the ENN and 346
SNN. 347
348
4) To examine the performance of the SNN and ENN in capturing two AB sizes of the φ-349
q-n patterns, Figs. 9, 10 and 5 were compared. Generally, lower values of µS and µE are 350
visible for surface discharge in air (when compared to training and testing surface 351
discharge in air at the same resolutions or 2 PRs of the φ-q-n patterns i.e. Figs. 5-8). 352
The change appears to be more visible in the SNN and ENN recognition rates when the 353
AB resolution size is changed from 100AB to 25AB rather than 50AB. For both 354
changes there is at least a 5% reduction in the recognition rates of the SNN and ENN 355
for surface discharge in air. However, when the resolution size is changed from 100AB 356
to 25AB it is obvious that σE, σS, σEM, σSM values of Fig. 10 appear to be higher than 357
those of Fig. 5 and Fig. 9. This shows a much wider correlation exists of the testing 358
data with the training data. Comparing Fig. 10 and Fig. 5 shows that the ENN has 359
higher sensitivity in statistical operator variations compared to the SNN. This results 360
implies that there exists significant variations between the training and testing data 361
caused by the change in the AB size of the φ-q-n patterns. 362
363
Fig. 5. Plot of µS , µE , σS , σE, σSM and σEM when both SNN and ENN are trained with 364
surface discharge in air 6° PR and 100 AB and tested with the same surface discharge and 3 365
other PD faults but at 6° PR and 100 AB. (µS and µE values are the centre of variances of 366
SNN and ENN). 367
Fig. 6. Plot of µS , µE , σS , σE, σSM and σEM when both SNN and ENN are trained with 368
surface discharge in air 6° PR and 100 AB and tested with the same surface discharge and 3 369
other PD faults but at 3° PR and 100 AB µS and µE values are the centre of variances of 370
SNN and ENN). 371
Fig. 7. Plot of µS , µE , σS , σE, σSM and σEM when both SNN and ENN are trained with 372
other PD faults but at 12° PR and 100 AB (µS and µE values are the centre of variances of 374
SNN and ENN). 375
Fig. 8 Plot of µS , µE , σS , σE, σSM andσEM when both SNN and ENN are trained with surface 376
discharge in air 6° PR and 100 AB and tested with the same surface discharge and 3 other PD 377
faults but at 15° PR and 100 AB (µS and µE values are the centre of variances of SNN and 378
ENN). 379
Fig. 9 Plot of µS , µE , σS , σE, σSM andσEM when both SNN and ENN are trained with surface 380
discharge in air 6° PR and 100 AB and tested with the same surface discharge and 3 other PD 381
faults but at 6° PR and 50 AB( µS and µE values are the centre of variances of SNN and 382
ENN). 383
Fig. 10 Plot of µS , µE , σS , σE, σSM and σEM when both SNN and ENN are trained with 384
surface discharge in air 6° PR and 100 AB and tested with the same surface discharge and 3 385
other PD faults but at 6° PR and 25 AB (µS and µE values are the centre of variances of SNN 386
and ENN). 387
6. Conclusions
388
For the majority of the PD sources considered, statistical mean CI variations exist for 389
different PR and AB sizes. This has been shown to be most significant in the Hn(q)+ and 390
Hqn(φ)- plots but less significant in the Hn(φ) plots. Both the SNN and ENN capabilities have 391
been tested for recognizing and discriminating resolution sizes of the φ-q-n patterns and the 392
results clearly show that they can detect slight changes in resolution sizes of these patterns. 393
Additionally, the results shows that the ENN, being more capable, is more sensitive in 394
capturing several resolution changes. These results imply that for practical PD recognition 395
applications, care has to be taken not to simply train SNN or ENN with any PD φ-q-n 396
resolution data and test with another φ-q-n resolution data and expect to obtain reliable 397
results. Furthermore, since different measuring instruments may have different settings for 398
the φ-q-n patterns which are captured and stored for analysis, it is important that certain φ-q-n 399
PR and AB sizes be maintained for consistency of recognition, otherwise unreliable 400
predictions may be incurred. 401
402
Acknowledgment
403
The authors are grateful to the Petroleum Technology Development Fund, Nigeria for 404
providing financial support. 405
406 407 408 409
References
1) E. Gulski and A. Krivda, Neural Network as a tool for recognition of partial discharges, 411
IEEE Trans. on Electrical Insulation. 28(6) (1993) 984-1001. 412
413
2) CIGRE, Working group report 21.03. Recognition of discharges. Electra 11(1969) 61–98. 414
415
3) A. Krivda, Automated recognition of partial discharges, IEEE Trans. on Dielectrics and 416
Electrical Insulation. 2(5) (1995) 792-821. 417
418
4) J. Granadoa, C. Álvarez-Arroyo, A. Torralbaa, J.A. Rosendo-Macıas, A. Chávez, M. 419
Burgos-Payánb, Time domain analysis of partial discharges envelope in medium voltage 420
XLPE cables, Electric Power System Research. 125 (2015) 220-227. 421
422
5) R. Albarracín, J.A. Ardila-Rey and A. Abubakar Mas’ud, On the use of monopole 423
antennas for determining the effect of the enclosure of a power transformer tank in partial 424
discharges electromagnetic propagation, Sensors. 16(2) (2016) 148. 425
426 427
6) Y. Tu, Z. Wang, and P. Crossley, Partial discharge pattern recognition based on 2D 428
wavelet transform and neural networks techniques. Power Engineering Society SUMMER 429
Meetings 1(2002) 411-416. 430
431
7) M. Majidi, M.S. Fadali, M. Etezadi-Amoli and M. Oskuoee, Partial discharge pattern 432
recognition via sparse representation and artificial neural network, IEEE Transactions 433
on Dielectrics and Electrical Insulation. 22(2) (2015) 1061-1070. 434
435
8) E. Gulski, F. Krueger, Computer aided analysis of discharge patterns, Journal of Applied 436
Physics. 23(1990) 1569-1575. 437
438
9) W. J. K. Raymond, H. A. Illias, A. H. A. Bakar and H. Mokhlis, Partial discharge 439
classifications: review of recent progress, Measurement. 68 (2015) 164-181. 440
441
10) T. Abdel Galil, R. Sharkawy and M. Salama, Partial discharge pattern classification using 442
the fuzzy decision tree approach, IEEE Trans on Instrumentation and Measurement. 54(6) 443
(2005) 2258-2263. 444
445
11) T. Babnik, R. Aggarwal, and P. Moore, Data mining on a transformer partial discharge 446
data using the self-organizing map, IEEE Transactions on Dielectrics and Electrical 447
Insulation. 14(2) (2007) 444-452. 448
449
12)Y. Khan, A. Khan, F.N. Budimana, A. Beroual, N. H. Malika and A. A. Al-Arainya. Partial 450
discharge pattern analysis using support vector machine to estimate size and position of 451
metallic particle adhering to spacer in GIS, Electric Power System Research. 116 (2014) 452
391-398. 453
454
13)T. K. Abdel-Galil, Y. G. Hegazy, M. M. A. Salama and R. Bartnikas, Partial discharge 455
pulse pattern recognition using hidden Markov models, IEEE Transactions on Dielectrics 456
and Electrical Insulation. 11 (4) (2004) 715-723. 457
458
14)B. Karthikeyan, S. Gopal and S. Venkatesh, ART 2—an unsupervised neural network for 459
PD pattern recognition and classification, Expert Systems with Applications. 31(2) (2006) 460
345-350. 461
15)A. Abubakar Mas’ud, B. G. Stewart, S. G. McMeekin, Application of Ensemble neural 463
networks for classifying partial discharge patterns, Electric power system research. 110 464
(2014) 154-162. 465
466
16) C. Kuo, Artificial identification system for transformer insulation aging, Expert Systems 467
with Applications. 37(6) (2010) 4190-4197. 468
469
17)A. Abubakar Mas’ud, B. G. Stewart, S. G. McMeekin and A. Nesbitt, Partial discharge 470
pattern classification for angled point-oil-pressboard degradation, IEEE Conference of 471
Electrical Insulation and Dielectric Phenomena. (2013) 217-220. 472
473
18)N. Trinh, Partial discharge XIX: Discharges in air Part I: Physical mechanisms, IEEE 474
Insulation Magazine. 11(2) (1999) 23-29. 475
476
19)IEC 60270, British standard guide for partial discharge measurement (2001). 477
478
20)I. Maqsood, M. Khan and A. Abraham, An ensemble of NNs for weather forecasting, 479
Neural Computing and Application.13 (2004) 112-122. 480
481
21)D. Jiminez, Dynamically weighted ensemble of neural network for classification, World 482
Congress on Computational Intelligence. (1998) 753-756. 483
484
22)P. Cunningham, J. Carna and S. Jacob, Stability Problems with the artificial neural 485
networks and the ensemble Solution, Art. Intelligence in Medicine. 20(3) (2000) 217-225. 486
487
23)H. Navone, P. Grannito, P. Verdes, H. Ceccato, A learning algorithm for NN ensemble, 488
Artificial Intelligence. 12 (2001) 70-74. 489
490
24)M. Majidi, M. Oskuoee, Improving pattern recognition accuracy of partial discharges by 491
new data preprocessing methods, Electric power system research. 119 (2015) 100-110. 492
505 506 507 508 509 510 511 512 513
Figures 514
[image:15.595.338.486.692.791.2]515 516 517 518 519 520 521 522 523 524 525 526
Fig. 1: Simulated PD faults a) surface discharge in air b) single void in PET c) corona in air d) surface
527
discharges in oi
528
529
530
531
[image:16.595.119.514.81.362.2]
532 533
Fig. 2: Example of the φ-q-n patterns for the PD faults considered
534 535 536 537 538 539
540
541
[image:16.595.43.518.376.803.2]
542 543
Fig. 3: The ENN model[10]
544 545 546 547 548
549
(c) surface discharge in oil
(d) +ve corona in air (e) –ve corona in air
Train data (1)
Train data (2)
Train data (n)
NN (1)
NN (2)
NN (n)
Aggregate result
Available training data
550
551 552
553
554
555
[image:17.595.324.503.94.212.2]
556
Fig. 4: Processed surface discharge in air patterns.
557 558 559 560 561 562 563 564 565
Hn(q)- at 6°PR and 100 AB Hn(q)- at 6°PR and 100 AB
Hn(q)+ at 6°PR and 25 AB Hn(q)+ at 6°PR and 25 AB
566
Fig. 5. Plot of µS , µE , σS , σE, σSM andσEM when both SNN and ENN are trained with surface discharge in air 6°
567
PR and 100 AB and tested with the same surface discharge and 3 other PD faults but at 6° PR and 100 AB. (µS
568
and µE values are the centre of variances of SNN and ENN)
569
[image:18.595.159.459.329.490.2]570
Fig. 6. Plot of µS , µE , σS , σE, σSM andσEM when both SNN and ENN are trained with surface discharge in air 6°
571
PR and 100 AB and tested with the same surface discharge and 3 other PD faults but at 3° PR and 100 AB µS
572
and µE values are the centre of variances of SNN and ENN)
573 574
575
Fig. 7. Plot of µS , µE , σS , σE, σSM andσEM when both SNN and ENN are trained with surface discharge in air 6°
576
PR and 100 AB and tested with the same surface discharge and 3 other PD faults but at 12° PR and 100 AB (µS
577
and µE values are the centre of variances of SNN and ENN)
578
0.5 0.55 0.6 0.65 0.7 0.75 0.8 0.85 0.9 0.95 1
Geometries
R
ec
ogn
iti
on
r
ate
S SM E EM
corona in air 0.6mm void surface discharge
in air surface discharge in oil
0.5 0.55 0.6 0.65 0.7 0.75 0.8 0.85 0.9 0.95 1
Geometries
R
eco
g
ni
ti
o
n
ra
te
S
SM
E
EM
corona in air 0.6mm void surface discharge in oil surface discharge
in air
0.5 0.55 0.6 0.65 0.7 0.75 0.8 0.85 0.9 0.95 1
Geometries
R
ec
ogn
iti
on
r
ate
S SM E EM
corona in air 0.6mm void surface discharge
[image:18.595.148.464.585.738.2]579
Fig. 8 Plot of µS , µE , σS , σE, σSM andσEM when both SNN and ENN are trained with surface discharge in air 6°
580
PR and 100 AB and tested with the same surface discharge and 3 other PD faults but at 15° PR and 100 AB (µS
581
and µE values are the centre of variances of SNN and ENN)
582
583
Fig. 9 Plot of µS , µE , σS , σE, σSM andσEM when both SNN and ENN are trained with surface discharge in air 6°
584
PR and 100 AB and tested with the same surface discharge and 3 other PD faults but at 6° PR and 50 AB ( µS
585
and µE values are the centre of variances of SNN and ENN
586 587 588
0.5 0.55 0.6 0.65 0.7 0.75 0.8 0.85 0.9 0.95 1
Geometries
R
ec
ogn
iti
on
r
ate
S SM E EM
corona in air 0.6mm void surface discharge
in air surface discharge in oil
0.5 0.55 0.6 0.65 0.7 0.75 0.8 0.85 0.9 0.95 1
Geometries
R
ec
ogn
iti
on
r
ate
S
SM E EM
corona in air 0.6mm void surface discharge in air
[image:19.595.151.472.342.513.2]589
Fig. 10 Plot of µS , µE , σS , σE, σSM andσEM when both SNN and ENN are trained with surface discharge in air
590
6° PR and 100 AB and tested with the same surface discharge and 3 other PD faults but at 6° PR and 25 AB (µS
591
and µE values are the centre of variances of SNN and ENN)
592
0.55 0.6 0.65 0.7 0.75 0.8 0.85 0.9 0.95 1
Geometries
R
ec
ogn
iti
on
r
ate
S SM E EM
surface discharge in air
surface discharge in oil 0.6mm void
APPENDIX: The 95% CI of statistical fingerprints with different PR and AB sizes
593
594 595
a) sk of the 1°, 3°, 6°, 9°, 12° and 15° PR for the Hn(φ) and Hqn(φ) plots at 100 AB
596 597
598 599 600
b) ku of 1°, 3°, 6°, 9°, 12° and 15° for the Hn(φ) and Hqn(φ) plots at 100 AB
601 602
603
c) cc of 1°, 3°, 6°, 9°, 12° and 15° PR for the Hn(φ) and Hqn(φ) plots at 100 AB
604 605 606
15° 12° 9° 6° 3° 1° 15° 12° 9° 6° 3° 1° 15° 12° 9° 6° 3° 1° 15° 12° 9° 6° 3° 1°
1.5
1.0
0.5
0.0
-0.5
-1.0
Hn(φ)+ Hn(φ)- Hqn(φ)+
Hqn(φ)-K
ur
to
si
s
Surface discharge in air:95% CI for the Mean
15° 12° 9° 6° 3° 1° 0.85
0.80
0.75
0.70
0.65
C
ro
ss
-c
or
re
la
tio
n
607
d) sk of the 100AB, 50AB and 25AB PR for Hn(q) and Hqn(φ) plots at 6° PR
608 609
610
e) ku of the 100AB, 50AB and 25AB PR for Hn(q) and Hqn(φ) plots at 6° PR
611 612
613
f) cc of 100AB, 50AB and 25AB data all at 6° PR.
[image:22.595.204.432.73.212.2]614 615 616
Fig. A1: The mean values and 95% CI of the mean for surface discharge in air 617
618
a) sk of the 1°, 3°, 6°, 9°, 12° and 15° PR for the Hn(φ) and Hqn(φ) plots at 100 AB
619 25AB 50AB 100AB 25AB 50AB 100AB 25AB 50AB 100AB 25AB 50AB 100AB 4 3 2 1 0
Hn(q)+ Hn(q)- Hqn(φ)+
Hqn(φ)-Sk
ew
ne
ss
Surface discharge in air:95% CI for the Mean
25AB 50AB 100AB 25AB 50AB 100AB 25AB 50AB 100AB 25AB 50AB 100AB 25 20 15 10 5 0
Hn(q)+ Hn(q)- Hqn(φ)+
Hqn(φ)-K
ur
to
si
s
Surface discharge in air:95% CI for the Mean
25AB 50AB 100AB 0.85 0.80 0.75 0.70 0.65 0.60 C ro ss -c or re la tio n
Surface discharge in air:95% CI for the Mean
15° 12° 9° 6° 3° 1° 15° 12° 9° 6° 3° 1° 15° 12° 9° 6° 3° 1° 15° 12° 9° 6° 3° 1° 1.5 1.0 0.5 0.0 -0.5 -1.0
Hn(φ)+ Hn(φ)- Hqn(φ)+
Hqn(φ)-K
ur
to
si
s
620
621
b) ku of the 1°, 3°, 6°, 9°, 12° and 15° PR for the Hn(φ) and Hqn(φ) plots at 100 AB
622 623
624
c) cc of 1°, 3°, 6°, 9°, 12° and 15° PR for the Hn(φ) and Hqn(φ) plots at 100 AB
625 626
627 628
d) sk of the 100AB, 50AB and 25AB PR for Hn(q) and Hqn(φ) plots at 6° PR
629 630
631
e) sk of the 100AB, 50AB and 25AB PR for Hn(q) and Hqn(φ) plots at 6° PR
632 633 15° 12° 9° 6° 3° 1° 15° 12° 9° 6° 3° 1° 15° 12° 9° 6° 3° 1° 15° 12° 9° 6° 3° 1° 1.5 1.0 0.5 0.0 -0.5 -1.0
Hn(φ)+ Hn(φ)- Hqn(φ)+
Hqn(φ)-K
ur
to
si
s
Serial void (d=0.6mm,t=50um):95% CI for the Mean
15° 12° 9° 6° 3° 1° 0.975 0.950 0.925 0.900 0.875 0.850 C ro ss -c or re la tio n
Serial void(d=0.6mm,t=50um):95% CI for the Mean
25AB 50AB 100AB 25AB 50AB 100AB 25AB 50AB 100AB 25AB 50AB 100AB 4 3 2 1 0
Hn(q)+ Hn(q)- Hqn(φ)+
Hqn(φ)-Sk
ew
ne
ss
Single void (d=0.6mm,t=50um):95% CI for the Mean
25AB 50AB 100AB 25AB 50AB 100AB 25AB 50AB 100AB 25AB 50AB 100AB 25 20 15 10 5 0
Hn(q)+ Hn(q)- Hqn(φ)+
Hqn(φ)-K
ur
to
si
s
634
f) cc of 100AB, 50AB and 25AB data all at 6° PR.
[image:24.595.194.438.70.226.2]635 636
Fig. A2: The mean values and 95% CI of the mean for single void in PET 637
638 639
Tables: 640
Table 1: PD fault types with the test voltages and corresponding φ-q-n samples. 641
PD fault type Test voltage φ -q-n samples
generated Corona in air 1.5 kV, 1.9 kV, 2 kV and 2.2 kV for
the 5 mm gap and 1.7 kV, 1.9 kV, 2.3 kV and 2.8 kV for the 10 mm gap distance
42
Surface discharge in air 5 kV 148
Surface discharge in oil 18.5 kV 90
Void in the insulation 2.7 kV 169
642 643 644 645 646 647 648 649 650 651 652 653 654 655 656
25AB 50AB
100AB 0.88
0.87 0.86 0.85 0.84 0.83 0.82
C
ro
ss
-c
or
re
la
tio
n
Table 2: Mathematical expressions of statistical fingerprints 657
Statistical operator
Mathematical equation
Skewness
3
3
xj Pj
sk
Kurtosis
4
4
xj Pj
ku
Discharge Factor
Q=
S S
S S
N Q
N Q
Cross-correlation
cc =
n y y
n x x
n y x y
x
j j
j j
j j j
j
2 2
2
2 ( ) ( )
658 659 660
Table 3: Samples of training and testing data for the SNN and ENN
661
Samples Description
Data 1 surface discharge in air φ-q-n data at 6° PR and 100 AB
Data 2 surface discharge in air and 3 other PD faults φ-q-n data, all at 3° PR and 100AB
Data 3 surface discharge in air and 3 other PD faults φ-q-n data, all at 12° PR and 100AB
Data 4 surface discharge in air and 3 other PD faults φ-q-n data, all at 15° PR and 100AB
Data 5 surface discharge in air and 3 other PD faults φ-q-n data, all at 6° PR and 50 AB.
Data 6 surface discharge in air and 3 other PD faults φ-q-n data, all at 6° PR and 25 AB.