City, University of London Institutional Repository
Citation
:
Schoen, V. and Lang, T. (2015). Should the UK be concerned about sugar?. UK:
Food Research Collaboration.
This is the published version of the paper.
This version of the publication may differ from the final published
version.
Permanent repository link:
http://openaccess.city.ac.uk/15040/
Link to published version
:
Copyright and reuse:
City Research Online aims to make research
outputs of City, University of London available to a wider audience.
Copyright and Moral Rights remain with the author(s) and/or copyright
holders. URLs from City Research Online may be freely distributed and
linked to.
Food R
esear
ch
Collabortion
Should the UK be Concerned About Sugar?
Should the UK be concerned about
sugar?
Victoria Schoen and Tim Lang
Summary
This paper has been produced to contribute to public debate about sugar, the ill-‐health consequences of
which have rightly been highlighted in recent years. This and an accompanying paper seek to dovetail these
public health concerns with other issues arising from and associated with the sugar industries. Sugar is a
commodity with a long and troubled social history: slavery, colonialism, unequal trade relations, bad
working conditions, heavy land use, pollution and other forms of environmental damage. On the other
hand, it is a large employer, an economic lifeline for some small countries and many growers, and a
considerable concern for the fair trade movement. The paper supports the public health concerns about
unnecessary and rising consumption of sugar through processed foods and soft drinks, but mainly explores
how these concerns can be squared with other interests championed by civil society organisations. It asks
whether a progressive route can be charted through a potential minefield of conflicting interests. The
paper provides a digest of facts and figures on the UK, EU and world sugar trade. It concludes that sugar
raises long-‐term questions for UK food policy, whether the sugar is produced in the UK as beet or imported
from cane. It suggests that in a world of squeezed resources and food security concerns, the sugar trade
warrants more attention from UK policy makers, particularly with regard to how the transition to a low
sugar consumption food system could be managed. We see opportunities for joint work by civil society
organisations and academics on that process. We confirm that a better food system would begin to wean
the world off massive sugar production and consumption. As this process begins, more, and urgent,
attention should be given to alternative land use, employment and revenue generation for primary
producers who are locked into the production of this, often unnecessary, food commodity.
1.
Introduction
The Fairtrade report, “Sugar Crash: How EU reform is endangering the livelihoods of small farmers” (1) has highlighted the tensions over the current sugar cane trade and the implications for poor overseas producers arising from changes to EU policy on sugar beet. This Fairtrade report was published after the present briefing paper on sugar had been proposed at a meeting of academics, public health and Fairtrade representatives1 in London in September 2014, hosted by the Food Research Collaboration (FRC). At the FRC meeting, concerns were raised about how the public health case for sugar reduction could be squared with the livelihoods of producers in poorer nations. Was the new sugar régime taking sufficient note of
either the public health champions wanting a reduction of sugar in diets to tackle obesity or the employment considerations being championed by development and fair trade civil
1
Food R
esear
ch
Collabortion
2
society
organisations? Could a
case for reform be charted which united social movements which otherwise might compete for limited policy attention?
This paper explains the background to this policy area. It takes a wide look at the world of sugar and sweeteners. The sweetening of the UK’s and the world’s diet is no longer just a competition between European beet, cane from Least Developed Countries exporting under Everything but Arms and American cane2. The market for artificial sweeteners now adds to the potential sources of sugary taste available to food and drink manufacturers.
This briefing paper is one of two FRC papers on sugar; the second looks more closely at the environmental and social impacts of sugar production. The FRC hopes that the publication of both papers helps to inform debate on the UK’s role as a significant importer of cane sugar, not just a producer, as we progress further into the 21st century. We are mindful, too, that with the Transatlantic Trade and Investment Partnership (TTIP) being negotiated at the EU level with the USA, maize-‐derived High Fructose Corn Syrup (HFCS) might also increase its presence in the UK. This will add to the concerns of advocates of public health, the environment and social justice. Pending TTIP’s conclusion, this paper focuses on the tensions between cane and beet production.
We hope this paper extends the debate and fairly represents all parties. The threats from changes to the UK, EU and global sugar trades are real and immediate: to cane producers if sugar prices collapse and markets are lost; to the UK if the incidence of NCDs continues to increase at current rates; to cane workers if civil rights continue to be ignored; and to UK land use if beet production continues to be planted on soils which might produce more beneficial crops. Excepting UK land use, the parallels with tobacco are striking; happily, the eventual successes in tobacco control offer potential encouragement. This is not an easy debate but a process of negotiation between all parties is needed. A path between social, moral and self-‐interested conscience needs to be established.
2.
The problem
UK and EU sugar consumption is a determinant of living standards for many in poor overseas nations: a large number of smallholders obtain their livelihoods from sugar cane production. The problem is that the sector currently faces a number of extreme challenges. The EU sugar sector has been heavily regulated for decades to the benefit of the poorest country suppliers and this is due to change in 2017 as EU sugar beet and isoglucose3 production quotas expire. This will likely lead to an increase in sugar production within the EU, often subsidised, with a resultant price fall and market displacement for third country suppliers.
In addition, obesity, overweight and dental decay are real and increasing problems in the UK and worldwide, with overweight and obesity predicted to cost the NHS £9.7 billion per year by 2050, with wider costs to society and business projected to reach £49.9 billion per year (2). There are initiatives at work in the UK to encourage consumers to reduce per capita sugar consumption.
Lastly, as a result of EU policy change, the market may become more open to alternative sweeteners in the future; these not only exacerbate the problem for poorer suppliers but may also exacerbate public health impacts if sugar prices fall and/or if the production of alternative sweeteners expands.
2
This latter is important in world markets rather than EU markets.
3
Food R
esear
ch
Collabortion
3
Figure 1: Statement of the sugar problem
At the heart of the problem is the following:
“For many of us, sugar cane is not just some incidental crop that can be easily
replaced. It is a primary agricultural export, at the very core of our economies and a principal source of income for huge segments of our populations – in Fiji’s case, 200-‐thousand people or more than 20 per cent of all Fijians. In some ACP countries, sugar exports account for more
than one quarter of GDP and 85 per cent of total agricultural exports.
…….. So for Fiji and many other ACP countries, a healthy market for our sugar spells a
healthy economy and higher living standards, while a poor market spells the opposite4”
In the face of this high dependency, CAP reform is going to have a significant impact:
“The major impacts [of this reform] are the sharp decline and severe volatility in price arising from the expanded production of sugar from EU beet growers in a market that is already over-‐supplied. This entails placing the heavily subsidised beet farmers in sharp and unfair competition with ACP producers, especially small cane farmers…………
This opening-‐up by the premature removal of quotas as a market management tool, to benefit a few highly efficient, low cost commercial operators, is adverse to the ‘development’ aspect in which ACP sugar farming is undertaken. It’s the livelihood of millions that depends
on cane sugar cultivation and production that is being threatened. This is unfair5”
The result will be reduced imports of sugar from those who so desperately need the EU market:
“(One of) the impacts that can be expected when quotas expire (is that) raw sugar imports from high-‐cost third countries decline very substantially. ……….. When it is assumed that an increasing share of the sweetener market is taken by isoglucose ……… raw sugar imports from high-‐cost third countries decline even more than when there is no isoglucose
interaction6 (3)”.
And to compound these difficulties, it is becoming more evident that populations the world over need to reduce sugar intake:
“Added sugar is a completely unnecessary part of our diets, contributing to obesity, type II diabetes and tooth decay. We strongly urge the WHO to recommend reducing sugar
intakes to below 5% daily calories, as this will have the biggest impact on our health7”
4 Commodore Josaia Voreqe Bainimarama, CF (Mil), OStJ, MSD, jssc, psc, Prime Minister and
Minister for Finance, Strategic Planning, National Development and Statistics, Public Service, Peoples Charter for Change and Progress, Information, i-‐Taukei Affairs, Provincial
Development, Sugar Industry, Lands and Mineral Resources, Speech At The Opening Of The 13th ACP Ministerial Conference On Sugar, 14th October 2013 (available at:
http://www.acp.int/sites/acpsec.waw.be/files/Bainimarama_speech.pdf
5
Ambassador Gomes, Secretary General Designate of the African, Caribbean and Pacific Group of States, quoted in, Fairtrade Foundation, 2015, Sugar Crash How EU Reform is
Endangering the Livelihoods of Small Farmers, A Fairtrade Foundation Report, February 2015,
p. 21, available at:
http://www.fairtrade.org.uk/~/media/fairtradeuk/what%20is%20fairtrade/documents/policy %20and%20research%20documents/policy%20reports/faitrade%20foundation%20sugar%20c rash%20report.ashx
6 Text in brackets added by authors. 7
Food R
esear
ch
Collabortion
4
The overall impact of these three forces will be a dramatic reduction in income to developing country suppliers.
This paper examines these issues in more depth, looking at why they are of concern to the UK and suggests the avenues that further research may take in order to alleviate the potential fallout from policy change.
3.
Britain, sugar and the Commonwealth
The UK has a long history of importing sugar from Commonwealth countries: those party to the 1951 Commonwealth Sugar Agreement (CSA) included Australia, South Africa, the British West Indies, Mauritius, Fiji, the East African territories and British Honduras (4). Except for the latter two, these territories were heavily dependent on the production of raw sugar and had a common interest in preventing a repetition of the very low prices that had been observed in export markets in the inter-‐war years.
Following Britain’s joining the EEC in 1973, there was a change in the Common Market Organisation for sugar whereby a preferential import programme was agreed with traditional developing country suppliers, the ACP countries. This ACP Sugar Protocol, as it became known, stemmed from the 1975 Lomé Convention and translated the British CSA into an EU agreement on trade with ACP states. This allowed for preferential access to the EU market for 1.3 million tonnes of raw sugar imported at a rate close to an inflated EU domestic price for raw sugar. Such preferential access has remained a part of the EU market policy through various modifications to the regime over the past few decades.
Sugar preferential access has, over the years, affected the investments made in capital, land and human resources in ACP countries (5). The earnings generated by the Protocol have been a major source of foreign currency, have contributed to governments’ budgets and to the balance of trade, and in many cases have
represented a financial transfer larger than development assistance. There are cases where these earnings have played a role in the modernisation of the sugar industry or as a source of capital for investment in alternative activities.
The potential case for the UK to remain concerned at the plight of sugar cane industries in far-‐off lands is three pronged:
1. British conscience: The British were responsible for establishing large-‐scale sugar plantations in the West Indies in the 17th century and this made sugar affordable for the masses (6). Profits from the sugar trade helped to build the British Empire and necessitated expansion of the Atlantic slave trade to work the plantations. Almost 1 million African slaves were brought to the Caribbean to work on the plantations under notoriously brutal conditions. Many of the ACP countries remain highly dependent on the sugar industry for food security and the eradication of poverty. The UK/EU has a moral duty to continue to support imports from these poor nations.
2. Maintenance of cane refining capacity in the UK: Tate and Lyle Sugars refine only sugars and syrups from cane sugar and is one of only a few companies in Europe that does this. It is the view of Tate and Lyle as well as ESRA (7) (the European Sugar Refineries Association) that changes to be introduced in the EU sugar regime in 2017 threaten the long-‐term future of the cane refining sector in the EU.
Food R
esear
ch
Collabortion
5
acquire raw material at competitive prices and maintain a viable economic throughput, their future demise will simultaneously impact ACP/LDC supplying countries as there will no longer be a market for raw cane sugar in the EU.
3. EU’s role in smallholder sugar development: The EU has provided a market for smallholder cane producers for generations. Countries such as Malawi, Zambia and Swaziland have all developed their sugar cane industries with export to the EU in mind, sometimes with the help of the EC. Removing that market without mitigating the impact will have serious consequences for LDCs exporting under the Everything But Arms Initiative (see Section 4) as well as for longer established ACP exporters such as Jamaica.
4.
A brief history of EU sugar policy towards third countries
The EU sugar market has for several decades been heavily regulated. Up to 2006, this was done through a system of production quotas, import quotas and duties, export refunds and intervention buying. The result of this intervention was higher EU sugar prices compared with world prices. In addition to the Sugar Protocol, from 2001 under an Everything But Arms (EBA) Initiative, quota-‐free duty-‐free access was granted to the EU market for all goods except arms produced in the Least
Developed Countries (LDCs)8. This policy encouraged production of sugar for export9.
The EU sugar regime to 2006 was criticized both internally and externally for the distortions it caused to the market. The inflated EU sugar price encouraged production in areas in the EU not suited to beet growing. The resultant domestic oversupply created unstable world markets as large quantities of subsidized sugar were released onto the world market, suppressing world prices for white sugar. The EU then subsidized exports to this unsustainable market to cover the difference between EU and world prices.
There was also fear in the EU that under the EBA Initiative there could be an influx of LDC sugar if domestic prices remained high. This, and a ruling by the WTO that the EU was unfairly cross-‐subsidising exports of sugar, led to a process to reform the policy over the period 2006 to 2010.
Reforms at this time included a sizeable reduction in EU production quota with many beet sugar processors closing (41% reduction in the number of factories 2006-‐ 2010 (9)) and a dramatic reduction in the EU sugar support price of 36% from €631.90 per tonne to €404.40 per tonne by 2009/10. As a result of these changes, the EU became a net importer of sugar.
Additionally, in 2007 the EU gave notice that it would end the Sugar Protocol from 1 October 2009. Instead, the EU introduced Economic Partnership Agreements (EPAs), regional trade agreements between the EU and six groups of ACP countries. The transition period for this was to last from 2008 to 2015 where, under the final arrangement, all ACP sugar would be duty-‐free and quota-‐free but still subject to an EPA safeguard clause10, 11.
8 For sugar, a transition period meant that quotas were maintained on exports of sugar under
the EBA agreement until October 2009
9 Juxtaposed with the most recent CAP reform, which will remove demand for LDC sugar, the
issue of policy incoherence is highlighted.
10 Safeguard clause applies to ACP non-‐least developed countries (Bangladesh, Cambodia,
Laos, Nepal).
ACP-‐LDC countries with quota-‐free, duty-‐free access are: Benin, Democratic Republic of Congo, Ethiopia, Madagascar, Malawi, Mozambique, Senegal, Sierra Leone, Sudan, Tanzania, Togo and Zambia, see Commission Regulation (EC) No 828/2009, at:
Food R
esear
ch
Collabortion
6
The impact for previous Sugar Protocol countries of the policy change initiated in 2006 was expected to be drastic, caused largely by,
1. the 36% reduction in price received compared with prices offered under the Sugar Protocol; and,
2. following the end of the Sugar Protocol, 67 ACP (EPA/EBA) countries were to benefit from preferential access to the EU market rather than the 19 signatories to the Protocol (10). Competition for EU market access would increase.
The EU did attempt to support those countries that had previously been a part of the Protocol via its Accompanying Measures for Sugar Protocol Countries (AMSP) (EC Reg. 266/2006) programme. An evaluation for the EC (11) of this programme found that within the 18 Sugar Protocol countries, four country groups could be identified, differing according to their reaction to the CAP reform. This varied from production expansion to withdrawal and demonstrates that in terms of country response to further market challenges, cane supplying countries cannot be treated as one homogenous group: the needs and responses of each supplying country differ according to their current supply base and cost conditions.
5.
World, EU and UK production and prices for sugar
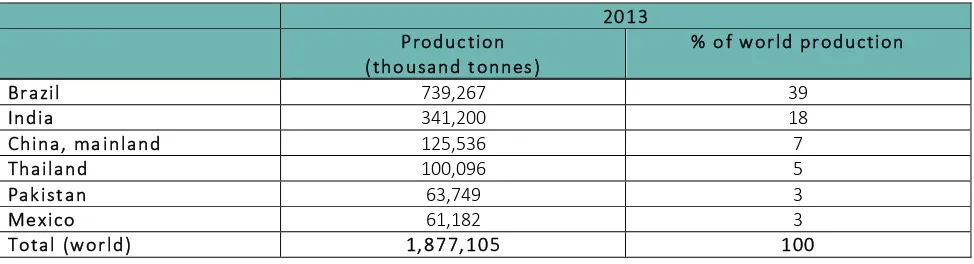
The majority of sugar produced globally originates from sugar cane. World production stood at 1,877 million tonnes in 2013 of which 57% came from just two countries, Brazil and India. By contrast, world production of beet stood at 250 million tonnes in the same year with the EU responsible for 43% of this total and 16% coming from the Russian Federation. Comparing these sums, 88% of world sugar production is from sugar cane, 12% from sugar beet.
Table 1: World production of sugar cane 2013 (12)
2013
Production
(thousand tonnes)
% of world production
Brazil 739,267 39
India 341,200 18
China, mainland 125,536 7
Thailand 100,096 5
Pakistan 63,749 3
Mexico 61,182 3
Total (world) 1,877,105 100
11
[image:7.595.81.568.417.549.2]Food R
esear
ch
Collabortion
7
Table 2: World production of sugar beet 2013 (12)
2013
Production
(thousand tonnes)
% of world production
Russian Federation 39,321 16
France 33,613 13
United States of America 29,767 12
Germany 22,828 9
Turkey 16,483 6
China, mainland 12,056 5
European Union 107,816 43
UK (13) 8 .003
Total (world) 250,191 100
The EU is a net importer of sugar. 79% of imports into the EU were from countries with EPA-‐EBA agreements in 2014-‐2015 (14). Remaining imports were from Central America, Colombia and Peru (6%), Brazil (4%), Balkans (7%) and the remaining 4% from “Others”. This shows the significance of imports from the ACP and Least Developed Countries in overall EU imports.
World sugar prices are notoriously volatile; this is influenced by a whole variety of factors operating in producing and consuming countries that, can be summarised as (15):
• Government policies that intervene in sugar markets in many countries;
• Production cycles in Asia, particularly in India, that cause large periodic swings in trade between imports and exports
• The actions of Brazil, the leading sugar producer and dominant global trading nation, a country that has attained the status of a “price setter” on the world market with international sugar prices usually correlated with its relatively low production costs. The size of the annual sugar cane crop in Brazil, together with its allocation between ethanol and sugar production, are key factors underlying the projection of international sugar prices.
Food R
esear
ch
Collabortion
8
Figure 2: EU Reference price and EU market price for white sugar
compared with World price London N°5 (first future in $/t)
(16)
Maybe in reaction to this, ten of the EU28 have chosen to adopt a new voluntary Coupled Support payment measure under new CAP reforms. This will allow them to direct between €169 million and a €179 million per year to support their sugar beet farmers between 2015 and 2020 (17). This is concerning for developing country suppliers who will lose out not only from price falls but also from market loss when competing with subsidised EU producers.
6.
Importance of sugar exports to producing countries
Sugar is an important export for a number of developing country suppliers. The UK alone takes 100% of the EU exports of some cane producing nations: in 2010 and 2011 these were Fiji, Belize, Lao, Cambodia and, in 2010, Sudan. It is useful here then to reflect on what these exports mean in economic and social terms for the countries supplying the UK.
Table 3: Production and export of sugar from key UK suppliers (18)
Production (‘000 tonnes) Export of raw centrifugal
sugar
Sugar Cane Raw centrifugal sugar Volume
(‘000 tonnes)
Value (‘000 US$)
2011 2012 2011 2012 2011 2011
Fiji 2,115 1,546 166 157 12212 70,889
Barbados 259 278 25 27 23 10,593
Belize 844 1,070 99 115 83 41,371
Guyana 3,196 2,709 235 218 253 155,675
Zimbabwe 3,058 3,700 372 501 88 37,935
Jamaica 1,518 1,475 138 131 111 53,000
Malawi 2,500 2,800 305 315 268 191,947
12 There is a discrepancy here between the volume of exports to the UK reported by Fiji in
[image:9.595.224.563.44.321.2] [image:9.595.80.568.557.725.2]Food R
esear
ch
Collabortion
9
Table 4: Exports of raw sugar as percentage of total agricultural exports, 2011 (18)
Total agricultural
products (‘000 US$)
Raw centrifugal sugar (‘000 US$)
Sugar as % of total agricultural exports
Guyana 379,851 155,675 40.98%
Fiji 268,015 70,889 26.45%
Belize 162,413 41,371 25.47%
Jamaica 295,655 53,000 17.93%
Malawi 1,144,870 191,947 16.77%
Barbados 90,700 10,593 11.68%
Zimbabwe 1,150,401 37,935 3.3%
For Guyana, sugar exports contribute approximately 41% of all agricultural exports by value and for Fiji and Belize sugar contributes more than a quarter of all agricultural exports by value. For Jamaica, Malawi and Barbados, sugar exports are a significant contributor to agricultural export earnings.
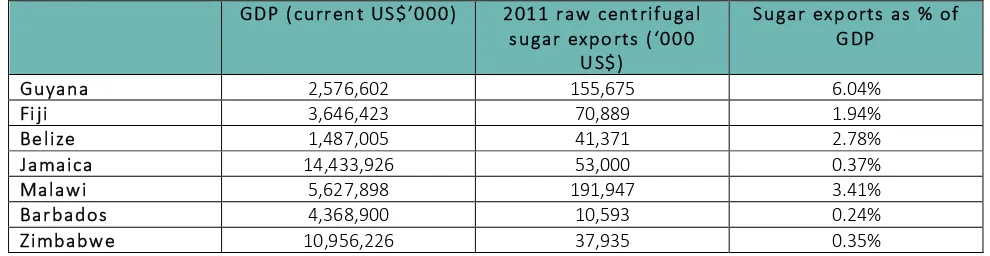
The sugar sector is also an important contributor to GDP in these nations. As Table 5 shows, in Guyana sugar contributes 6% of GDP, 3.4% in Malawi, 2.8% in Belize. This is not an insignificant crop.
Table 5: % of GDP from sugar exports for selected EU suppliers (12, 18)
GDP (current US$’000) 2011 raw centrifugal
sugar exports (‘000 US$)
Sugar exports as % of GDP
Guyana 2,576,602 155,675 6.04%
Fiji 3,646,423 70,889 1.94%
Belize 1,487,005 41,371 2.78%
Jamaica 14,433,926 53,000 0.37%
Malawi 5,627,898 191,947 3.41%
Barbados 4,368,900 10,593 0.24%
Zimbabwe 10,956,226 37,935 0.35%
Data on employment and social gains from sugar cane production by country is not easily located and would be difficult to calculate without primary research. Much of the sugar in ACP countries is produced from smallholdings and by contract farming where household labour is not recorded. In larger scale operations some very large organisations employ staff in the various countries in which they operate so employment data is available on a per company rather than per country basis. However, two examples of the contribution that sugar cane production can make to communities are given in the boxes below:
Vietnamese conglomerate Hoang Anh Gia Lai, said Thursday that a sugarcane plant in its industrial complex in the southern Laotian province of Attapeu went on stream January 16.
Besides the sugarcane plant, which can process 7,000 tons of sugarcane per day, a 30 MW thermal electricity plant, fuelled by bagasse -‐-‐ or sugarcane waste -‐-‐ has also started generating power.
The factory, which employs more than 4,000 employees, has 12,000 hectares of sugarcane plantations in Attapeu and contracts with local farmers growing the crop on a further 4,000 hectares.
[image:10.595.79.563.60.176.2] [image:10.595.75.570.332.460.2]
Food R
esear
ch
Collabortion
10
The sugar industry is an important socio-‐economic factor in Belize, providing significant employment, foreign exchange earnings, and rural stability. Poverty levels of around 30% of the population in the sugar belt are relatively low due to the incomes and employment generated by the sugar industry, which also finances housing, education, health and recreational activities through a welfare fund. (20)
One only has to look back to the opening quote of the paper from the Fijian Prime Minister to understand how important sugar is for that one country alone.
7.
Threats to sugar cane supplying countries
Export revenue from sugar is the result of price commanded for sugar as well as the quantities sold. Both these factors are currently under threat as a result of EU policy reform, public health encouraged consumption change and competition from alternative sweeteners.
7.1
The public health challenge
WHO statistics for the European region show that over 50% of people are
overweight or obese and over 20% of people are obese. One in three 11-‐year olds is overweight and obese13. In the UK the picture is worse with two thirds of adults overweight or obese in 2012 (21). In addition, PHE reports that almost one-‐third of five-‐year-‐olds in the UK had tooth decay in 2012. On this basis, PHE report that,
“The case for a reduction in the nation’s sugar intake is clear. It is likely to bring about a reduction in the risk of calorie imbalance, weight gain and obesity and the associated health, well-‐being and dental health problems”.
The report goes on to list the potential savings to the NHS of a reduction in sugar consumption:
“Reducing sugar consumption, particularly in the most disadvantaged groups in society, is also likely to improve health equality, have a positive impact on the nation’s mental health and wellbeing, and save costs to the NHS and local
authorities by reducing social care costs. The most recent estimates are that excess body weight and poor dental health costs the NHS alone £4.7 billion and £3.4 billion a year respectively. The social care costs of these conditions, which will fall to local authorities, are difficult to estimate, but are likely to be significant. NHS costs attributable to overweight and obesity are projected to reach £9.7 billion by 2050, with wider costs to society estimated to reach £49.9 billion per year”.
These costs are vast. The NHS in England has a budget of around £100 billion for 2015 (22): already more than 8% of this is taken by diet related illness and the projections to 2050 are frightening.
In 1991, COMA (the Committee on Medical Aspects of Food Policy), recommended that non-‐milk extrinsic sugars14 should contribute no more than 10% of total dietary energy. This was based on evidence that sugar intake is associated with greater dental caries (23). However, SACN reports National Diet and Nutrition Survey data for the period 2008/09 to 2011/12 that show that percentage daily intake from
13
See WHO regional office for Europe, http://www.euro.who.int/en/health-‐
topics/noncommunicable-‐diseases/obesity/data-‐and-‐statistics/infographic-‐1-‐in-‐3-‐11-‐year-‐ olds-‐is-‐overweight-‐or-‐obese-‐download
14 Non-‐milk extrinsic sugars include sugars added to foods, e.g. sucrose, glucose and fructose,
Food R
esear
ch
Collabortion
11
NMES exceeded the recommended amount across all age groups, being highest in the age 11-‐18 group (15.4%) and age 4-‐10 group (14.7%).
Based on the fact that reducing sugar intake will lower the incidence of dental caries and the over-‐consumption of energy that currently leads to weight gain, the SACN draft report proposes that the recommendation for sugar intake in the UK should be set at a population average of around 5% of dietary energy for those aged 2 years and above. The report bases this on the need to limit free sugars15 to no more than 10% of total energy intake at an individual level, so necessitating a population average for free sugars intake of around 5% of total energy. This 5% of total energy intake per day is also proposed in the WHO (2014) draft guideline on sugar intake (24) which suggests that sugar intake should contribute less than 10% of daily energy intake but that 5% would provide more health benefits.
In the UK there is also support for a reduction in sugar in the diet from Action on Sugar16, a group of specialists concerned with sugar and its effects on health. The group works to achieve a consensus with the food industry and Government over the harmful effects of a high sugar diet, and to bring about a reduction in the amount of sugar in processed foods. The group is supported by 23 specialist advisors.
PHE (21) is also looking to the future to see what approaches might be adopted to encourage consumers to reduce their sugar intake including further development of social marketing, education and training for health professionals so they can effectively support healthier behaviour and regulating the advertising of sugary foods.
Of course, if the EU reform holds prices for sugar in the EU at low levels, following strict economic principles, there is always the chance that consumption may increase. A lower sugar price will make it economically more viable to incorporate calorific sweeteners into processed products, potentially increasing the overall sugar content of foods (25). Innovation to incorporate sugar into a greater range of foods may also be encouraged.
An expansion of HFCS production in the EU could also undermine efforts to change consumer behaviour. The Alliance for Natural Health Europe claims that it is harder for the body to break down HFCS because of its molecular structure, hence an increased likelihood of resultant obesity (26). Euractiv (27) quote Jeppesen, a Danish researcher on obesity and diabetes at Arhus University, as saying that the use of HFCS has led to a “genuine obesity epidemic in the US since it was introduced. We have tested it on rats, and this type of sugar increases the risk of getting fatty liver disease and diabetes". He claims that HFCS primarily consists of fructose which has already been degraded and therefore goes straight into the blood. Though HFCS today can be found in small limits in cakes, Jeppesen claims that it can become very dangerous, if for example, it is used in beverages where the liquid is consumed in large amounts.
Impacts of these effects on cane supplying countries depend on a number of related consequences. Firstly, if sugar prices fall and isoglucose production expands, making this too a cheaper product, manufacturers may be more inclined to increase use in processed products and overall consumption could increase, or not fall to the levels identified by WHO/SACN as being beneficial to health. Secondly, demand will be affected by whether or not PHE and others are successful in persuading
consumers to reduce consumption of sugars. These are fairly new initiatives so positive outcomes are yet to be seen.
15 The SACN report proposes that the UK adopts the definition of ‘free sugars’ in place of
‘non-‐milk extrinsic sugars’. Free sugars are defined as all monosaccharides and disaccharides added to foods by the manufacturer, cook or consumer, plus sugars naturally present in honey, syrups and unsweetened fruit juices. This term is more easily recognized outside the UK.
16
Food R
esear
ch
Collabortion
12
Lastly, the extent of potential consumption reduction is unknown and the effects on overall demand not calculated. If consumption were to fall to 5% of total energy intake, what effect would this have on total demand for sugar? Published data have not been identified for this paper and a request for such information from Public Health England brought the following response17:
PHE has not looked at a change in the volume of sugar consumed within the UK or a change in the volume of sugar used in products likely to be observed if SACN were to advise reducing the recommendation for sugars to 5%. It is very hard to predict a change in the volume of sugar consumed as it takes years to deliver a significant reduction on a population scale. For example, Government work to drive a reduction in the nation’s salt intakes through public health messaging and working with manufacturers, has resulted in a 15% reduction over 10 years. (28)
This is a good reason for not attempting the calculation but some rough estimates might be useful. Using data from the NDNS for sugar consumption by age group and multiplying through by population data from the Office for National Statistics shows that for the period 2008-‐2012, sugar consumption in the UK amounted to around 1.3 m tonnes per annum18. Using the % of total energy data from the NDNS for each age group and reducing this so that sugar represents 10% and 5% of total energy intake lowers this 1.3 m tonnes to 1.1m tonnes and 548 thousand tonnes respectively.
These are very generalised estimates and do not match the figures given by DEFRA for total new supply19 over the same period (see Table 6) which averaged 2 m tonnes per annum. Reducing this to 10% and 5% of total energy intake results in consumption figures of 1.7m and 800 thousand tonnes respectively.
Table 6: Total UK sugar balance (refined basis, thousand tonnes, unless otherwise specified) (29,
30)
2008 2009 2010 2011 2012
Production 1,192 1,280 995 1,315 1,144
Net imports 806 801 820 920 798
Total new supply 1,998 2,081 1,814 2,235 1,943
Looking at these ballpark figures, both the NDNS data and the DEFRA data, the suggestion is that with a 10% energy intake, sugar consumption could fall by around 0.2-‐0.3 m tonnes annually. At a level of 5% energy intake from sugar, consumption could fall by 0.75-‐1.2 m tonnes annually. Considering UK imports from outside the EU stood at 0.65 m tonnes in 2012 and averaged 0.94 m tonnes over the 2008-‐2012 period, a reduction in sugar intakes in the UK to WHO/SACN levels could impact severely on demand for sugar from poorer countries.
7.2
Price and market impact of sugar reform
In order to encourage a more sustainable and competitive agricultural industry in the EU towards 2020, 2013 saw further reform of the Common Agricultural Policy introduced, including change to the sugar regime. The main element of this is the removal of EU production quotas on sugar beet and isoglucose which will take effect from 30th September 2017. This change and the resultant impact for cane
17
Private correspondence with Elizabeth Harper, Correspondence and Public Enquiries Officer, Public Health England, 24th February 2015
18
This is done by totalling consumption for each of five NDNS age categories using the data given for grams consumed per day multiplied by average population data for the UK for the period 2008-‐2012. The percentage intake from sugar is then reduced to 10% and 5% for each age category and total consumption for the UK taken from the sum of the totals for each age category.
19 Private communication with DEFRA, 11 November 2014: total new supply can be used as a
Food R
esear
ch
Collabortion
13
supplying countries have yet to be observed but several organisations have calculated predictions as to the likely market effects.
The EC (31) predicts that from 2016 to 2020, the EU will marginally increase production of beet by 1% to 115.1 million tonnes and its production of sugar by 4.3% to 16.8 million tonnes. Consumption of sugar will remain fairly constant around 17.2 million tonnes but overall consumption of sweeteners will increase due to an increase in the consumption of isoglucose. By 2020 the latter will show an increase in production of 2.4 times the quantities produced in 2016 (0.7 million tonnes) and consumption will increase from 0.7 million tonnes in 2016 to 1.6 million tonnes in 2020, increasing its overall share in sweetener use from 3.6% to 8.5% by 2020.
In 2014, the EC also predicted a reduction in the EU price of sugar from €496/tonne in 2016 to €415 per tonne in 2020, a difference of 19%. The data in Figure 2 shows this low level has already been reached. This represents a 42% fall in price from €720 in October 2013 to €419 in March 2015. This is more than a threat, rather a disaster for poor cane supplying countries.
The EC predicts that over its forecast period of 2014-‐2024, the EU will become self-‐ sufficient in sugar and even an occasional net exporter. Imports are expected to fall from 2.7 m tonnes in 2016 to 1.91 m tonnes by 2020. The report (32) does suggest that opportunities will still exist for certain periods in the year when EU production cannot cover domestic demand and in certain regions, as beet production is concentrated in the northwest of Europe. However, it does not take account of the Voluntary Coupled Support subsidies that will allow the continuation of higher cost production in the EU and again lessen demand for imports from traditional cane suppliers.
Figures from DEFRA (33) also suggest that abolition of the beet quota will lower EU sugar prices by up to 20% potentially causing some developing country suppliers to become uncompetitive on EU markets. Again, the data in Figure 2 suggest this price point has already been reached.
A more detailed analysis of the likely impact of CAP reform on the sugar sector is given in the 2014 JRC report, “EU Sugar Policy: A Sweet Transition After 2015?” (2). The analysis here uses a partial equilibrium mathematical model (CAPRI) to compare two scenarios in 2020: in the reference case, quotas remain in place, in the
alternative scenario, quotas are eliminated in 2015 and predictions given for market impacts assuming a zero, 10% and 20% substitution effect from isoglucose.
With quotas in place, there are effectively two markets in place for sugar in the EU, the white sugar market for food use, (supplied by domestic production under quota and by imports) and the market for out-‐of-‐quota sugar (used for industrial purposes or exported). The EU price of the first category of sugar has tended to be higher than the world price of sugar because of the protection received while sugar falling in the latter category has tended to follow the world price.
According to the JRC report, when subsidies are removed, these prices will tend to merge, with the price of white sugar falling and the price of industrial sugar rising. Production of beet is predicted to increase in the EU after subsidy removal as regions previously producing out-‐of-‐quota sugar increase production beyond the decline in production of those areas previously producing only to quota. In addition, sugar previously used for industrial purposes or exported is now diverted to the domestic market, hence pushing up domestic supply of white sugar.
Food R
esear
ch
Collabortion
14
The outcome for cane supplying countries is not good in any of the scenarios. With increased domestic supply of white sugar and potentially reduced demand, sugar imports decline. The report suggests that in the standard scenario with no isoglucose substitution, imports from high-‐cost countries will fall by 43% and from low-‐cost countries by 4%.
As Matthews (op. cit.) concludes, the three main factors determining EU sugar production and price post-‐2017 will be the overall supply response of EU production; the share of isoglucose in the EU market when isoglucose quotas are removed and the responsiveness of export supply from preferential exporters to changes in EU market price.
Finally, DFID (35) has examined the likely impact on developing countries of EU sugar policy reform. They estimate that removal of production quotas will lead to a reduction in raw sugar prices in the EU by about €100 per tonne by 2020 relative to the level of prices that would be expected if quotas were to continue. This would amount to a loss of revenue of €170 million to the ACP/LDC supplier group based on supply levels to the EU in the period 2008/09-‐2010/11 (1.67 m tonnes per year).
International sugar grower and processor organisations hoped that CAP reform would not happen until the end of the 2019/2020 marketing year. Prior to 2013, CIBE, CEFS, EFFAT and the ACP group wrote,
“The Single CMO for sugar provides a buffer for the EU against world market volatility. The abolition of the flexible tools to manage supplies to the internal market (i.e. to withdraw sugar in situations of surplus or to release sugar/allow additional imports in situations of deficit) would increase EU market volatility and damage the EU’s ability to secure access to a reliable and predictable sugar supply. Any permanent increase in imports should be strongly opposed. This would undermine ACP/LDC preferences and damage the coherence between the EU’s agricultural, development and trade policies” (36)
The counterfactual view came from the CIUS, the European Sugar Users association, which supported the reforms. In April 2013 they wrote:
“The position of the European Parliament adopted in March, aimed at extending sugar and isoglucose quotas until 2020, is a wrong signal for Europe. Furthermore, it is de facto a request for a blank extension to quota without any clear end date, as 2020 is yet another CAP reform year. This position conflicts with the over-‐riding objective of promoting jobs and economic growth in Europe. The European Parliament should facilitate, not hinder, expansion of production and export of high value added products made in Europe. Restricting beet sugar production in Europe to 80% of European demand and applying conditions that have artificially raised prices for this important ingredient to more than twice the EU reference and world market prices, undermines European competitiveness throughout the food supply chain.
While we still see no solid justification for any extension beyond 2015 we welcome that the Council has acknowledged the need for change and are glad that the compromise date of 2017 proposed by the Council is earlier than the one proposed by Parliament” (37)
7.3
Market competition from alternative sweeteners
Food R
esear
ch
Collabortion
15
thousand tonnes20, and isoglucose consumption makes up less than 5% of the total
EU sweeteners market. This compares with the beet sugar production quota of 13 million tonnes annually.
Forecasts as to the share that this product will take in the EU sweetener market post-‐2017 vary because of uncertainties regarding future prices of cereals, the production of sugar beet after quota abolition and the uptake of isoglucose by food processors; the latter will be influenced by the consumer acceptance of this alternative sweetener in food products.
DFID (35) comment that EU isoglucose production capacity is currently very limited but costs are competitive with the sugar sector and could improve with increases in the scale of production. The report advises that isoglucose production could expand “significantly” in the absence of quotas.
The AAF (European Starch Industry Association) predicts that isoglucose could take up to 20% of the EU market for sweeteners in the longer term (38). This could seriously impact on the demand for raw sugar from traditional preferential suppliers to the EU market.
Whilst the AAF predicts a 3 million tonne output of isoglucose in future, the EC (39) predicts output to reach 2.3 million tonnes by 2024, just above expected
consumption of 2.2 million tonnes. This would represent an 11.6% share of the sweetener market.
Even at 11%, the share of the sweetener market contributed by isoglucose is nothing like that in the US where HFCS makes up 34% of per capita caloric sweetener consumption (40). JRC (2) finds it difficult to predict the evolution of isoglucose in EU markets but do not expect this to reach levels observed in the US. They explain that isoglucose is not a substitute for pure sugar in direct consumption but can substitute for sugar to varying degrees in processed foods such as baked goods, confectionery and ice cream. However, in soft drinks, its substitutability is high, but then the consumption of soft drinks in the EU is much lower than in the US. Because of this uncertainty, in their model described earlier, they perform sensitivity analysis on the substitution effect looking at impacts for the sugar sector if isoglucose takes a 10% or 20% share of the EU sweetener market. Either way, increased use of isoglucose in the EU processed food market could lessen the demand for imported raw sugar.
Isoglucose is not the only competitor on the EU sweeteners market. MECAS/ISO (41) lay out the different major sweetener categories and types. The first division is between caloric and non-‐caloric sweeteners. Caloric includes sucrose (sugar), HFCS, glucose, dextrose and crystalline fructose. Non-‐caloric sweeteners are subdivided into Natural and Synthetic. Synthetic sweeteners include, for example, Saccharin, Sucralose, Neotame and Aspartame. Natural non-‐caloric sweeteners divide into Low potency and High potency. The latter includes the newer Stevia sweetener, Luo Han Guo (from monk fruit) and the Sweet Proteins Brazzein and Thaumatin. The low potency natural non-‐caloric sweeteners include Erythritol, Isomalt, Lactitol, Mannitol and Sorbitol. In general, the non-‐caloric sweeteners are intensely sweet and therefore only minute quantities are required for sweetening foods.
Different sweeteners have different uses according to their properties so the picture regarding their ability to replace sugar in different foods is difficult to predict. However, MECAS report CCM International 2011 data that show whereas the price per unit of sweetness for sucrose stood at US$1,115 per tonne, the equivalent value for sucralose was $17 and for aspartame only $78. However, these High Intensity
20
Food R
esear
ch
Collabortion
16
Sweeteners (HIS) are not perfect substitutes for sugar in all products, which may limit their usage, although some non-‐diet foodstuffs are using a blend of sugar and HIS.
MECAS does however predict that the relatively recent Natural HISs, Stevia and Luo Han Guo, may show significant growth in coming years albeit at the expense of other HISs rather than sugar. Stevia, or Steviol glycosides, is derived from the Stevia plant and is around 250-‐450 times sweeter than sugar (42). Within the EU it can be labelled as “naturally-‐sourced”. Agritrade (43) report that “the major stevia suppliers are now focusing on cutting sugar by half in mainstream soft drinks” and other manufacturers are looking to reduce sugar use by 30% in products such as yoghurt and ice cream.
Competition with ACP supplying countries will depend on the extent to which substitutions in the food industry become possible as well as on the relative price of sugar on world markets and the price of cereals used in the production of
isoglucose.
8.
Potential impact of threats to price and demand on sugar supplying
nations
The threats outlined in Section 7 could have serious consequences for third country sugar producers. DFID analysis (35) predicts different outcomes of the change in EU policy for four country groupings based on their cane cost base and current market opportunities. The countries selected are those that have supplied the EU market in recent years. The matrix is reproduced below as Table 7.
Table 7: Costs (average 2008/09-‐2010/11) vs. market access matrix (35)
Alternative markets No/limited alternative markets
High cost
(US$400 per tonne)
Benin Cote d’Ivoire Dominican Republic
Jamaica Kenya Madagascar Sierra Leone
Barbados Belize Mauritius
Guyana Fiji
Low cost
(<US$400 per tonne)
Cambodia Ethiopia
Malawi Sudan Tanzania
Zambia Zimbabwe
Swaziland Mozambique
Laos
The authors suggest that the extent to which a country is affected by EU policy change is determined by the current level of exposure of the industry to the EU market and access to alternative markets as well as their industry’s cost structure. On this basis, those countries potentially most affected are those in the top right hand cell, Barbados, Belize, Mauritius, Guyana and Fiji: the report advises that these countries would need to lower their production costs in order to remain viable in the long run.
In this analysis, impacts are mainly due to changes in the world price because, following EU reform, EU prices are expected to follow world prices more closely. The study estimates that if quotas are abolished21, 35 times more people would be