• No results found

Detecting cognitive impairment and dementia in Deaf people: The British Sign Language Cognitive Screening Test

N/A
N/A
Protected

Academic year: 2019

Share "Detecting cognitive impairment and dementia in Deaf people: The British Sign Language Cognitive Screening Test"

Copied!
51
0
0

Loading.... (view fulltext now)

Full text

(1)


City, University of London Institutional Repository

Citation

:

Atkinson, J., Denmark, T., Marshall, J., Mummery, C. & Woll, B. (2015). Detecting cognitive impairment and dementia in Deaf people: The British Sign Language Cognitive Screening Test. Archives of Clinical Neuropsychology, 30(7), pp. 694-711. doi: 10.1093/arclin/acv042

This is the accepted version of the paper.

This version of the publication may differ from the final published

version.

Permanent repository link: http://openaccess.city.ac.uk/12380/

Link to published version

:

http://dx.doi.org/10.1093/arclin/acv042

Copyright and reuse:

City Research Online aims to make research

outputs of City, University of London available to a wider audience.

Copyright and Moral Rights remain with the author(s) and/or copyright

holders. URLs from City Research Online may be freely distributed and

linked to.

(2)

1

Detecting cognitive impairment and dementia in Deaf people:

The British Sign Language Cognitive Screening Test

(Short title: Detecting cognitive impairment and dementia in Deaf people)

Joanna Atkinson 1

Tanya Denmark 1

Jane Marshall 2

Cath Mummery3

Bencie Woll 1

1

Deafness, Language and Cognition Centre, Psychology and Language Sciences, University College of London, UK

2

City University, London, UK

3

Dementia Research Centre, Institute of Neurology, University College London, UK

Corresponding author: Joanna Atkinson, Deafness, Language and Cognition Research Centre, University College London, 49 Gordon Square, London, WC1H 0PD, U.K. [email protected]

Tel: 44 (0)20 7679 8679

(3)
(4)

3

Funding

This study was supported by the Alzheimer's Society (grant number 119 awarded to A. Young, University of Manchester). The work was part of the programme of the Deafness Cognition and Language Research Centre (DCAL) funded by the Economic and Social Research Council (grant number RES-620-28-0002). C.

Mummery is part funded by the NIHR Queen Square Dementia Biomedical Research Unit.

Acknowledgements

(5)

4

Abstract

To provide accurate diagnostic screening of deaf people who use signed communication, cognitive tests must be devised and administered in signed languages with normative deaf samples. This paper describes the development of the first screening test for detection of cognitive impairment and dementia in deaf signers. The British Sign Language Cognitive Screening Test (BSL-CST) uses standardised video administration to screen cognition using signed, rather than spoken or written, instructions and a large norm-referenced sample of 226 cognitively-healthy deaf older people. Percentiles are provided for clinical

comparison. The tests showed good reliability, content validity and correlation with age, intellectual ability and years of education. Clinical discrimination was shown between the normative sample and fourteen deaf patients with dementia. This innovative new testing approach transforms the ability to detect dementia in deaf people, avoids the difficulties of using an interpreter and enables culturally and linguistically sensitive assessment of deaf signers, with international potential for adaptation into other signed languages.

Keywords

sign language; deaf; dementia; cognitive assessment; ACE-r; MMSE

Introduction

(6)

5

people show normal intelligence when assessed using appropriate nonverbal performance measures except where there is an additional disability affecting cognition (Vernon, 2005). Until now, assessment of cognitive neurodegeneration in deaf individuals has been limited to tests originally developed for populations using spoken languages, which are not validated or normed for use with deaf signers (Dean, Feldman, Morere & Morton, 2009). To take one issue, these tests measure verbal language ability and verbal memory, with scores referenced against norms from the general population; these domains are known to be weak in the cognitive profiles of prelingually deaf people and will inevitably lack validity for deaf people (See Baker & Baker, 2011 for a review). There is a need for new cognitive screens containing verbal measures directly derived in sign languages, and norms for deaf populations.

As in other countries, British Sign Language (BSL) users in the UK form a close-knit linguistic and cultural minority community. The use of upper-case D in Deaf signifies a cultural and language minority group, distinguishing them from people with

acquired hearing loss or those who prefer to communicate using only spoken

language. These latter groups also face barriers in obtaining reliable assessment but are not the focus of the study reported here. Sign languages are morphologically complex and grammatically unrelated to the spoken languages which surround them (Sutton-Spence & Woll, 1999); unrelated sign languages are often mutually

unintelligible even where two countries share the same spoken language, for example, the UK and USA.

Widely used neuropsychological screening tests such as the Mini Mental State Examination

(7)

6

Revised (ACE-r) (Mioshi, Dawson, Mitchell, Arnold, & Hodges, 2006) and the Montreal

Cognitive Assessment (MoCA) (Nasreddine, Phillips, Bédirian, Charbonneau, Whitehead et

al., 2005) use language and culture-bound items which do not translate effectively to a sign

language. Linguistic, cultural and educational differences mean that using interpreters, far

from being a solution, actually adds unreliability and error to tests (Hill-Briggs, Dial, Morere,

& Joyce, 2007). Dean and colleagues (2009) evaluated deaf performance on the Mini Mental

State Examination, which was translated by an interpreter into American Sign Language with

minimal changes made to items. The mean score for their sample of 117 cognitively healthy

deaf senior citizens was below the cut-off for normal function, potentially resulting in

misclassification of cognitive impairment or dementia. Furthermore, use of written instructions is inappropriate because prelingually deaf people often have poor literacy, with an average reading age of 9 years in the UK (Powers, Gregory, & Thoutenhoofd, 1999).

A further challenge for test translation is heterogeneity among deaf signers. For example, there is great variation in: age of acquisition; signing proficiency; and the degree to which English influences communication (e.g. in sign order, use of word mouthing and fingerspelling, Sutton-Spence & Woll, 1999). Fewer than 5% of deaf people have native exposure from Deaf parents (Petitto & Marentette, 1991), and for the majority, exposure to sign language is delayed, occurring outside normal

(8)

7

age or regional background. Simply translating items from an existing test is unlikely to meet these demands.

To overcome these problems we developed a new test administered directly in a sign language, titled the British Sign Language Cognitive Screening Test (BSL-CST). Crucially the development and norming of the BSL-CST sought to maximise cultural and linguistic suitability for the target Deaf population. This was achieved by taking an ethnocentric approach, with BSL and Deaf culture as the starting point for the generation of new test items and norms rather than attempting a direct translation of an existing test or applying existing spoken language norms. The test has no spoken or written English language requirement, with video administration wholly in British Sign Language. However, to ensure comprehensive screening of the relevant cognitive domains, the BSL-CST adopts a similar test structure to ACE-r. It includes some items and instructions borrowed from ACE-r and MoCA which were carefully modified where necessary for deaf signers and additional novel BSL tasks were generated to produce a more accurate picture of function.

(9)

8

Methods

Test procedure

The British Sign Language Cognitive Screen Test (BSL-CST) was developed by a Deaf-led team of neuropsychologists, linguists and a speech and language therapist. It is designed for administration in clinical and community settings, with questions and instructions presented in BSL video format on a laptop, and taking 30-45

minutes to complete. The respondent views the video and signs his/her response to each test item. The investigator is present during testing and records responses on the score sheet. Clarification is provided where instructions are not understood and video clips may be repeated. Test sessions are video-recorded to enable scoring to be double-checked.

Test design

We adapted an existing test framework for sampling cognition but ensured that each item was linguistically valid and culturally acceptable to the Deaf community. BSL-CST structure was modelled on the ACE-R ensuring thorough sampling of each cognitive domain: orientation, attention, memory, language, and

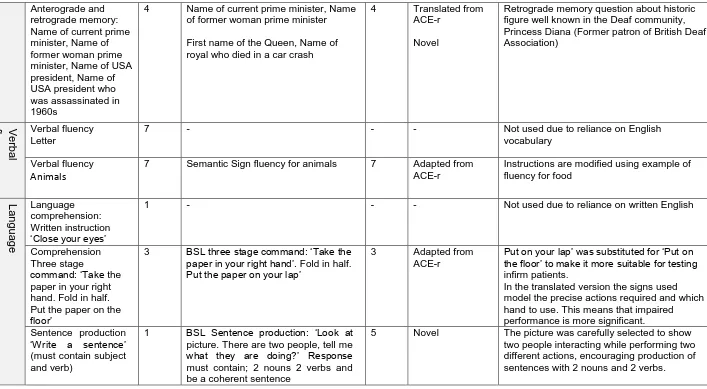
visuospatial/perceptual abilities. Many ACE-R items are unsuitable for assessing deaf signers. For this reason, the BSL-CST borrows only six items unchanged from the ACE-R with instructions translated into BSL; four ACE-R items are adapted with substantial modification to instructions and content; and the remaining nine items are completely novel tasks devised directly in BSL. Table 1 shows corresponding ACE-R and BSL-CST items and provides details about adaptions, as well as listing

(10)

9

language abilities. The BSL-CST extends the scope of the ACE-R by adapting from MoCA additional items for vigilance and executive function, with the aim of

increasing the sensitivity of the test to frontal impairments. Copyright permission was obtained from the ACE-R and MoCA research groups for all translations and

adaptations.

BSL Video instructions ensured standardised administration, which is impossible to achieve using paper-based tests as BSL has no written form. Test instructions were recorded onto video by a native Deaf user of BSL, who was from a family with four generations of Deaf members and highly familiar with the signing of older Deaf people. Filming was a collaborative process involving BSL linguists and

neuropsychologists. All were native or near-native signers. Three were Deaf and one hearing from a Deaf family. The test was designed to be well understood by signers across the UK with vocabulary and instructions selected for low regional variability. BSL structure and sign order were used, together with clear mouth movements, as this is usual for UK signers (Sutton-Spence, 2007), ensuring suitability for a wide range of deaf signers, including those who prefer English-influenced varieties of signing. Careful piloting and community feedback maximised cultural acceptability to the older Deaf Community.

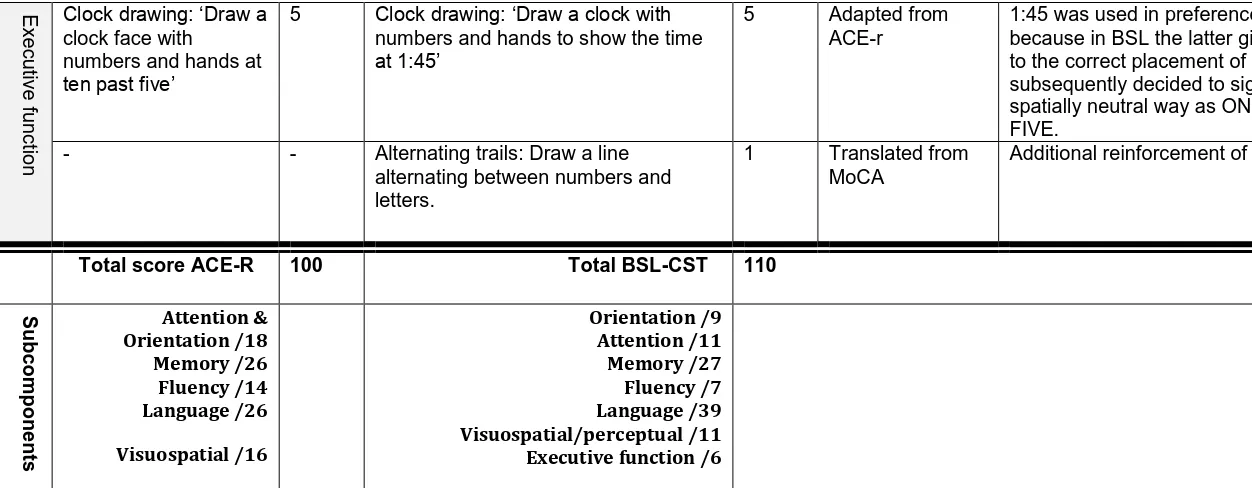
The maximum BSL-CST score of 110 points is composed of 7 component scores: orientation (9 points), attention (11), memory (27), fluency (7), language (39)

(11)

10

fingerspelled letters and reciting the months of the year backwards in BSL. The memory component includes 3-item recalI and immediate, delayed and recognition memory for biographical information about a fictional Deaf man, which assesses encoding, retrieval and retention. Semantic memory is tested with 4 questions on general knowledge. The language section comprises BSL object and picture naming, semantic comprehension, sentence production and repetition. Semantic fluency is measured by the number of animal signs produced in one minute (fingerspelled names were also accepted). Visuospatial and perceptual abilities are screened by copying line drawings of a cube and overlapping pentagons, counting dots and recognising degraded letters. Executive function overlaps with several of the

attention, fluency and visuospatial tasks but this component is specifically measured by clock drawing and alternating trails, which provide screening of praxis and

cognitive flexibility. It should be borne in mind that clock drawing is also sensitive to visuospatial impairment. Scores for the seven domains can be calculated separately and their sum gives the composite BSL-CST score.

Translated items

(12)

11

ethnographic approach described by Rogers, Young, Lovell, & Evans (2013). This was possible because we were not reliant on using existing test norms for hearing people but collecting entirely new normative data, so there was no danger of

translation factors distorting the norms. This procedure followed three stages: Firstly, the test development team (all highly bilingual signers) worked collaboratively to video record BSL translations of each test item, with an emphasis on obtaining conceptual equivalence and retaining psychological integrity. Secondly, two highly experienced sign language interpreters individually watched the BSL items and translated back to written English. Where differences occurred, a final consensus written translation was agreed between them. Thirdly, ten bilingual users of English and BSL (Deaf professionals and hearing interpreters) were asked to provide ratings of similarity between the original written test items and the written back translated versions using a Likert scale (1-7). They were asked to rate the sentences in terms of conceptual similarity, a measure of whether the same meaning is conveyed, regardless of the words or grammar used. Respondents were asked to use cultural knowledge of the differences in the way in which concepts are formed in English versus BSL, to inform their ratings. Ratings of conceptual similarity were high

ranging from 5.33 to 6.75 with a mean of 6.08 (from a maximum of 7) indicating that the items had solid conceptual equivalence.

Novel items

Tasks were deliberately based on forms of knowledge that have near-universal familiarity to the British Deaf community such as the months of the year,

(13)

12

former Princess of Wales, who was patron of the British Deaf Association and whose life and death was widely followed by British Deaf people. It was important to check rather than assume the ability to fingerspell. A culturally appropriate analogue of the name and address recall task used in ACE-R was developed by testing memory recall and recognition of biographical information about a Deaf man (name, age, wife’s name, where he lives and where he went to school). This fits well with Deaf culture, as there is social emphasis on establishing such information on meeting a new person to discover shared Deaf community connections.

Novel BSL language tasks were developed to screen BSL naming, production,

(14)

13

for the subsequent comprehension task where the question narrowed down response options.

BSL sentence production was elicited using the picture shown in Figure 2 of a

woman kissing a man while he washes up. The picture was held up by the examiner at shoulder height so that it could only be seen by the respondent. This was to encourage a narrative rather than pointing. To obtain a full score of 5 points the respondent had to produce two nouns corresponding to both agents and two verbs relating their actions in a coherently and syntactically structured utterance.

BSL sentences for repetition contained some signs selected from the BSL Corpus (Schembri, Fenlon, Rentelis, Reynolds, & Cormier, 2013) as exhibiting low regional variation. For example BLACK was used in our target sentence as it is one of the few colour signs used across the whole of UK, unlike other colour signs which have multiple lexical variants which differ across regions and age groups (e.g. PURPLE has 22 variants, Stamp et al., 2014).

Ethics

The study was approved by the local research ethics committee under Declaration of Helsinki guidelines. All participants provided informed consent. Clinical patients additionally agreed that anonymised scores collected during routine care could be used for research purposes.

Participants

Normative data

(15)

14

sign language users who were born deaf or became deaf before the age of 10 years. A screening interview conducted in BSL established suitability for participation. Inclusion criteria specified normal or corrected vision and no history of neurological disease, brain injury, mental illness, substance abuse or additional disability. The only exception was meningitis before 10 years that resulted in deafness. None were taking neuroleptic medication and all had refrained from drinking alcohol for 8 hours before testing. Table 2 shows demographic information collected through structured interview including: age; gender; region; age became deaf; age of BSL acquisition; cause of deafness; years of education (from 5 years onwards); occupational status; educational attainment; selective school attendance.

Clinical data

Recruitment took place at the National Hospital for Neurology and Neurosurgery (NHNN), London, where we piloted a monthly cognitive disorders clinic for deaf patients using the new tests as part of the diagnostic workup. Patients were

(16)

15

per European guidelines includes: routine haematology – full blood count (FBC),

erythrocyte sedimentation rate (ESR); routine biochemistry – renal, liver and thyroid

function, C-reactive protein (CRP); B12/folate, calcium, glucose and lipids; and as

indicated - antinuclear antibody (ANA), treponemal antibodies and HIV.); and further

tests as required, such as electroencephalogram and cerebrospinal fluid examination for components including tau and a-beta 1-42 proteins, looking for evidence of

neurodegenerative disease. Consensus diagnosis was reached by a multidisciplinary panel including two consultant neurologists, research fellows, specialist nurses, neuropsychology and allied disciplines based on standard clinical diagnostic criteria for dementia (DSM-IV TR, American Psychiatric Association, 2000) and disease specific criteria (e.g. NINCDS-ADRDA McKhann et al., 1984; Dubois, Feldman, Jacova, Dekosky, Barberger-Gateau et al., 2007 for AD; Neary, Snowden,

Gustafson, Passant, Stuss et al, 1998 for FTLD).Diagnosis was based primarily on clinical assessment, supported by the results of imaging, neurophysiology,

immunological tests as well as the BSL-CST results.

(17)

16

of the same age. Establishing accurate estimates of premorbid function in deaf people is difficult. We used WASI Matrix Reasoning (MR), a measure of nonverbal intellectual reasoning, with educational and occupational history to screen for

premorbid intellectual disability, and those with impaired WASI MR scores were only included where the participant’s history suggested clear decline from normal

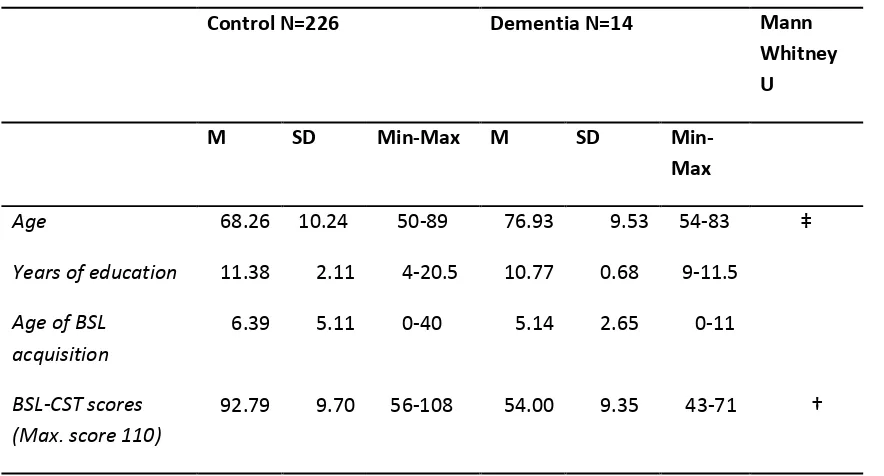
premorbid function. Table 3 shows demographic information for control and dementia groups.

Measures

In the norming phase, all participants completed the BSL-Cognitive Screening Test. Additionally, Matrix Reasoning (Wechsler Abbreviated Scale of Intelligence,

Wechsler, 1999) was used to confirm the sample showed normal distribution of nonverbal ability and to allow detection of existing impairments in the sample. Two measures were used to check how well the BSL-CST correlates with tests of working and verbal memory. These were: Numerical Digit Span, a measure of short term and working memory with Arabic numerals presented sequentially on a screen for

immediate recall, in either forward or backward trials, using signed digits as the response mode; and the BSL Verbal Memory and Learning Test (Denmark et al., in preparation) which requires learning of a list of twelve signs over three trials for subsequent recall and recognition.

Procedure

(18)

17

test-retest reliability. Retesting focused on younger participants aged 50-59 who were expected to show less natural change in cognitive scores over the 6 month period.

Analysis

Normative data were used to establish test validity and reliability as a measure of cognitive function in deaf people. The internal consistency of the BSL-CST was assessed using Cronbach’s Alpha and Guttman’s split-half coefficient. Inter-rater reliability was assessed using intraclass correlation. Cronbach’s Alpha was

calculated as an indicator of test-retest reliability. Convergent validity between BSL-CST and other tests of cognition were evaluated using Pearson correlation

coefficients.

(19)

18

Mann Whitney-U tests were used to examine differences between control and dementia groups for: demographic variables; performance on the BSL-CST and components. The area under the receiver-operator curve (ROC) was calculated to establish the clinical sensitivity and specificity of the test and to determine how accurately it distinguishes patients with dementia from controls.

Results

Reliability and validity

Inter-rater reliability An intraclass correlation of 0.994 (p<.0001) indicated excellent inter-rater reliability, confirmed by the absence of significant disagreement between different people scoring the test.

Test-retest reliability High test-retest reliability for individual items was indicated by an intraclass correlation of 0.964. Taking the test score as a whole, there was an alpha coefficient of .073 between first and subsequent test scores. Reliability

increased when semantic fluency was removed from analysis giving .082. Two of ten participants’ BSL-CST score improved (M + 3.5 points), five showed a small

downward change (M -3.4 points), and three remained the same. These findings indicate no detectable practice effects, as scores did not consistently improve from time 1 to time 2.

(20)

19

examined the contribution of each component score (e.g. memory, language etc.) to the overall test score. A Cronbach’s Alpha of 0.74 indicated an acceptable level of correlation between components, showing that each contributes to the latent variable of cognition but also adds unique information and none was superfluous to the

overall objective of thoroughly screening cognition.

Content validity It was not possible to provide a measure of convergent validity with another multi-domain cognitive screening test because the BSL-CST is the first tool of its kind so there is no gold standard against which to compare. However, scores did correlate with other, more detailed measures of short term memory, working memory, verbal learning, executive function and sentence repetition, which are sensitive to cognitive decline and ageing. Effect sizes (ES) using Cohen’s standards are reported in brackets. Data for the whole sample on the BSL-CST correlated with forward digit span r(219)=0.325, p<.001 (medium); backward digit span,

r(220)=0.557, p<.001 (large); and showed weaker correlation with sums of trials score on the BSL-Verbal Learning and Memory Test r(222)=-0.15, p<.05 (small). Further evidence comes from a subgroup of 52 participants (37 female, age 50-89, M 67.87, SD 10.38) who also completed tests of executive function and BSL

sentence repetition one year later as part of another study. All executive function scores correlated with BSL-CST performance, including: measures of cognitive flexibility (Colour Trails Test, D’Elia, Satz, Uchiyana, & T, 1996, r=-0.643, p=<.001,

(21)

20

(DKefs Design Fluency, Delis, Kaplan, & Kramer, 2001, r=0.572, p=<.001, large ES), Letter F fluency, (r=0.470, p=<.001, medium ES). BSL sentence repetition, a

language measure which taps BSL fluency and working memory, also weakly

correlated with the BSL-CST (r=0.351, p=<.05, medium ES). Taken collectively these correlations show that there is a robust relationship among cognitively healthy

controls between performance on the BSL-CST and tests of a wide range of

cognitive abilities, exactly what would be hoped for from a cognitive screening tool. While not conclusive these findings suggest the test has content validity.

Suitability for a diverse Deaf community

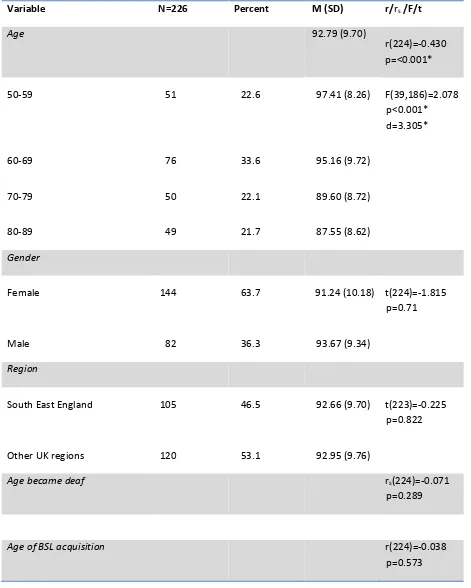
It is important that the BSL-CST is able to accurately measure cognition in a diverse Deaf community. It has no ceiling or floor effects, with scores ranging from 56-108 out of a possible 110 points (M 92.79, SD 9.70), suggesting suitability for use across age and intellectual spectrums. Table 2 shows the statistical relationships between demographic variables and test scores, indicating the test was well understood by signers from all UK regions, with no significant difference in distribution of test scores between signers who shared the regional dialect of the video presenter (South

Eastern England) and those from other regions. Likewise, there was no statistical difference between users of BSL and those who preferred more English-influenced forms of signing. There was no significant effect of gender, cause of deafness, age of onset, or age of BSL acquisition, suggesting that the test is a suitable instrument for use across a heterogeneous Deaf community.

Relationship with demographic variables

(22)

21

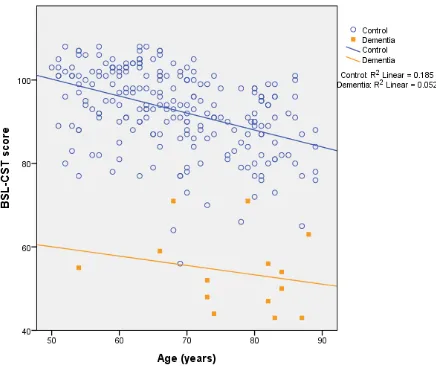
a decrease in mean performance among older participants, as shown in the scattergraph in Figure 3. Number of years of education, occupational status,

educational attainment (highest qualification) and selective schooling (determined by exams taken at 10-11 years old), are all positively related to test scores. It is

important to consider the possible effect of age on these correlations because different schooling regimes were experienced by different age groups in our study with older participants typically leaving school earlier r(225)=.352, p<.001 and with fewer qualifications F(5,200)=10.784, p<.001. There were no significant differences in age among occupational status groups F(4,221)=.962, p=42.9, or between those who had attended academically selective schools and those who had not

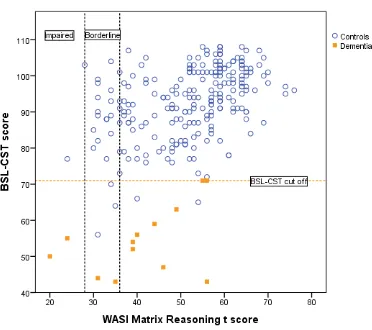
t(221)=.380, p=.704. There was a medium-sized positive correlation of BSL-CST scores and years of education after controlling for the effects of age using partial correlation r(222)=.241, p<.001. Higher nonverbal intellectual ability, measured by age-adjusted scores on WASI Matrix Reasoning, was associated with better BSL-CST performance as shown in the scattergraph in Figure 4.

Normative data for clinical use

Mean test score and standard deviation for each age group are presented in Table 2. Percentile age bands are presented in Table 4 enabling clinicians to compare

obtained scores to the normative range for the patient’s age group. Further data is presented in Table 5 to allow clinicians to cross reference patient scores with subgroups of signers of similar age and length of education. This is important because it is difficult to estimate premorbid intelligence in deaf signers using

(23)

22

significant difference in BSL-CST scores for these two groups (t(222)=-5.20, p<.001) and a large effect size (d=0.883). There was no statistical difference between more finely grained years of education groups.

Age of BSL acquisition is not built into percentile tables because differences in test scores did not reach significance for native, early (1-5 years) and late (6+ years) groups, although this information is still clinically relevant. Figure 5 shows native signers had higher mean scores and a lower standard deviation than those born into hearing families who acquired BSL in infancy or after the age of 6 years.

Clinical data

(24)

23

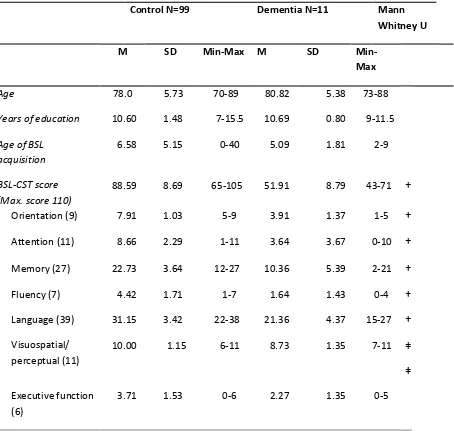
distribution of BSL-CST composite and component scores are the same across healthy and patient groups.

A Receiver Operating Characteristic (ROC) curve is a useful way to interpret the diagnostic utility of the BSL-CST. The area under the curve (AUC) indicates the ability of the screening measure to reliably distinguish between patients with

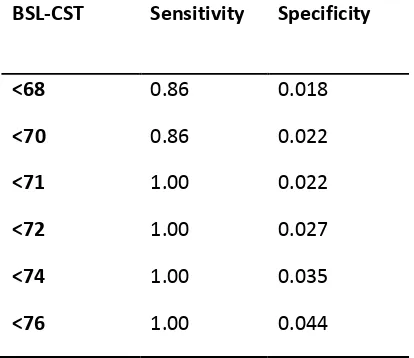
dementia and controls. A ROC curve was calculated using BSL-CST scores for the whole sample of dementia (n=14) and control (n=226) participants (Figure 6). The AUC for the BSL-CST is 0.996 (99.6%, P<.001, 95% CI=0.99 to 1.00) which, applying a rule of thumb of >.9, indicates an excellent trade-off between sensitivity and specificity, meaning that there is an extremely high true positive rate with patients correctly classified as belonging to the dementia group and a low false positive rate, with very few controls erroneously classified as having dementia. Our AUC value is close to 1, indicating highly reliable clinical accuracy, whereas a value of .50 would indicate the predictor is no better than chance (Zhou & Obuchowski, Obushcowski, 2002). The ROC curve can be used to determine a cut off score for dementia screening, below which there is a very high chance that a person has dementia or another cognitive disorder. Examining the sensitivity and specificity for each possible total suggests that a score of 71 can be identified as a likely cut-off. Based on the current sample this gives a sensitivity of 100% correct classification of dementia patients and misclassifies only 2.2% (n=5) of controls as belonging to the dementia group. Table 7 shows that a lower cut-off point would increase false negatives, wrongly classifying dementia patients as being cognitive healthy; and a higher cut-off point would increase false labelling of controls as having dementia.

(25)

24

We investigated how well the BSL-CST was able to distinguish between control participants with low intellectual ability and those with cognitive decline. We used WASI Matrix Reasoning (MR) as an indicator, because of its reliability as a global measure of nonverbal ability when used with deaf people, although we acknowledge that using a single measure may miss; or be specifically sensitive to, more focal impairments. Figure 4 shows obtained scores plotted against BSL-CST scores. Twenty-five control participants had borderline scores, and two were impaired, meaning that 11.9% of the normative sample fell outside the normal range for

nonverbal intellectual ability (n=27). Only 3 of this group were also BSL-CST outliers, with scores that fell below the suggested cut off score for identifying those with

(26)

25

cognition is compromised, though there have been no studies examining this in deaf populations. Of the five outliers misclassified as having dementia due to low BSL-CST scores, two fit the profile of acquired cognitive impairment, and a further three are impaired on both the BSL-CST and WASI Matrix Reasoning, indicating either developmental or acquired cognitive disability.

Discussion

As the proportion of older people in the Deaf community increases, there is greater need for sensitive diagnostic screens to detect change indicative of incipient

dementia, secondary to neurodegeneration. The BSL-CST shows validity as a cognitive screen across a wide demographic of deaf people who use sign language to communicate. Feedback indicated that rapport was not negatively affected by video instructions. BSL-CST sampling replicates screening tools for the general population, which are considered to have good content validity (Freitas, Simões, Marôco, Alves, & Santana, 2012; Law, Connelly, Randall, McNeill, Fox et al., 2013). It shows good reliability with high internal consistency, with all component scores contributing to and correlating with the overall test score, which in turn reliably indicates the presence or absence of dementia, and good stability, with high test-retest reliability and low practice effects. Healthy signers show fluctuations of +/- 3 points on retest so this needs to be borne in mind when using the test to track change in patients over time.

Evaluation of clinical potential

(27)

26

had high sensitivity and specificity as indicated by the excellent AUC, detecting dementia in all patients tested and misclassifying only five controls, who are likely to have either developmental or acquired cognitive impairments or possibly, dementia. The lack of previously validated tests for supporting dementia diagnosis in deaf people is a problem for the current methodology because the test under evaluation was also used to support diagnosis of clinical participants giving rise to issues of circularity. Diagnosis did not rest critically on the results of these tests, though they were used as one element of support. Clinical observation and assessment,

describing patterns of cognitive symptoms, and tempo and quality of decline, provided the fundamental basis for clinical diagnosis, which was refined using multimodality investigation and multidisciplinary review. We feel this minimised the impact of circularity. With this reservation in mind, the BSL-CST showed good clinical potential.

Limitations

Late diagnosis of dementia in our sample may explain why the AUC is so high, as our dementia sample is distinctly impaired relative to controls. Deaf patients had experienced long delays in accessing appropriate diagnostic assessment, typically showing symptoms for at least 2 years, prior to arriving at the specialist clinic,

therefore their dementia was more advanced than might be seen in a clinical sample taken from the general hearing population. As access to services and awareness of dementia within the Deaf community improves, we expect that people will present at an earlier stage . It would be useful to repeat these analyses with participants

(28)

27

It is likely that, despite pre-screening, our sample contained cases of undiagnosed learning disability or acquired cognitive impairment. We checked distribution of nonverbal intellectual ability (WASI Matrix Reasoning scores) and found moderate skew towards low ability (skewness -.428) for the whole group. Further breakdown by age showed that participants in their 70s and 80s showed expected distribution of ability but there was a non-normal, bimodal distribution for those in their 50s and 60s, suggesting that the younger bands included two different populations of deaf people, with one group having with low intellectual ability. Eighteen individuals (14% of those in these two age groups) fell in the borderline to severely impaired range. Predisposing risk factors among deaf people include organic causes of deafness that may also cause intellectual disability, such as: prematurity (Peterson, 2000),

meningitis (Anderson, Anderson, Grimwood, & Nolan, 2004; Grimwood, Anderson, Anderson, Tan, & Nolan, 2000), maternal rubella or cytomegalovirus infection (CMV) during prenatal development (Takano, Morimoto, Bamba, Takeuchi, & Ohno, 2006), and unidentified or poorly treated circulatory disorders which may adversely impact cognition in older adults (Sign Health, 2014). There may also be selection bias in our holiday camp sample because high ability, economically active deaf signers of working age in their 50s and 60s might be expected to be less attracted to a holiday targeted at older people. These factors make it clear that the Deaf population may include individuals with hidden cognitive impairments, showing need for better

service provision and diagnostic tests like the BSL-CST. It is noteworthy that despite the presence of these outliers, our normative and dementia groups are distinct and the BSL-CST provides excellent discrimination for clinical purposes.

(29)

28

The sampling and distribution issues should be taken into account when interpreting BSL-CST results particularly for those aged 50-69 years. Where a score falls below the 1st- 2nd percentile, confidence of clinical impairment can be increased, but the test may underestimate cognitive impairment in a deaf person with high premorbid ability.

We urge caution in the clinical use of a tentative cut-off score of 71 for distinguishing between dementia patients and controls based on the data in this study, because of the very small dementia group size and lack of data for patients diagnosed with mild cognitive impairment (MCI). The cut-off should only be used as a guide, and always with reference to normative percentiles, until further validation is done with a much larger sample. This reinforces the need to only use BSL-CST to support dementia diagnoses in conjunction with thorough history taking, imaging and medical tests. The BSL-CST is intended to be a screening tool and should not substitute detailed assessment. Where BSL-CST scores indicate concern; or an individual has high premorbid function; or complains of problems that are not identified by this basic screen, the patient should always be assessed using additional, in-depth tests for each cognitive domain. For example, the BSL Verbal Learning and Memory Test (Denmark et al., in preparation) can be used to provide a more fine-grained assessment of verbal memory and learning.

Future research

(30)

29

with different causes of neurodegeneration to emerge. The relationship between test scores and biological markers could be established, with the aim of facilitating the earliest possible diagnosis for deaf patients, so as clinical care improves they will be able to access new developments in preventative pharmacology.

Further research is required to validate the use of the BSL-CST by clinicians who have no knowledge of sign language, and who use a BSL-English interpreter, the administration of the BSL-CST by trained Deaf clinical technicians, or its use where a signing clinician is remotely located using telemedicine. Although questions and instructions are recorded on video, BSL-CST administration still requires high proficiency in BSL to clarify and repeat instructions, and to understand and record the client’s signed responses. It is not yet known whether additional cognitive demands would be placed on a deaf respondent having to share attention between the video, clinician and interpreter, and how this might affect scores, potentially leading to departure from normative scores, which were collected directly in BSL. Patient and carer rating scales using BSL also need to be developed, to measure adaptive behaviour and activities of daily living for use in conjunction with the BSL-CST.

International use

(31)

30

carefully modified to ensure good cultural and linguistic fit to each national Deaf community.

Conclusion

Developing tests directly in sign language rather than relying on translation is

imperative for clinical accuracy and for profiling patterns of cognition and impairment in deaf people, which would be overlooked or miss-measured using spoken

(32)

31

References

Anderson, V., Anderson, P., Grimwood, K., & Nolan, T. (2004). Cognitive and executive function 12 years after childhood bacterial meningitis: effect of acute neurologic complications and age of onset. Journal of Pediatric Psychology, 29, 67–

81. doi:10.1093/jpepsy/jsh011

Baker, K., & Baker, F. (2011). The assessment of intellectual disability with deaf adults. International Journal on Mental Health and Deafness, 1(1), 23–36.

Cormier, K., Schembri, A., Vinson, D., & Orfanidou, E. (2012). First language

acquisition differs from second language acquisition in prelingually deaf signers: Evidence from sensitivity to grammaticality judgement in British Sign Language.

Cognition, 124(1), 50–65. doi:http://dx.doi.org/10.1016/j.cognition.2012.04.003

Crowe Mason, T. (2005). Cross-Cultural Instrument Translation: Assessment, Translation, and Statistical Applications. American Annals of the Deaf, 150(1), 67–72.

Dean, P. M., Feldman, D. M., Morere, D., & Morton, D. (2009). Clinical evaluation of the mini-mental state exam with culturally deaf senior citizens. Arch Clin

Neuropsychol, 24(8), 753–760. doi:10.1093/arclin/acp077

Dubois, B., Feldman, H. H., Jacova, C., Dekosky, S. T., Barberger-Gateau, P., Cummings, J., … Scheltens, P. (2007). Research criteria for the diagnosis of Alzheimer’s disease: revising the NINCDS-ADRDA criteria. Lancet Neurology,

6(8), 734–46. doi:10.1016/S1474-4422(07)70178-3

Folstein, M., Folstein, S., & McHugh, P. (1975). Mini-Mental State: A practical method for grading the cognitive state of patients for the clinician. Journal of Psychiatric Research, 12, 189–198.

Freitas, S., Simões, M. R., Marôco, J., Alves, L., & Santana, I. (2012). Construct Validity of the Montreal Cognitive Assessment (MoCA). Journal of the

International Neuropsychological Society. doi:10.1017/S1355617711001573 Grimwood, K., Anderson, P., Anderson, V., Tan, L., & Nolan, T. (2000). Twelve year

outcomes following bacterial meningitis: further evidence for persisting effects.

Archives of Disease in Childhood, 83, 111–116. doi:10.1136/adc.83.2.111

Hill-Briggs, F., Dial, J. G., Morere, D. A., & Joyce, A. (2007). Neuropsychological assessment of persons with physical disability, visual impairment or blindness, and hearing impairment or deafness. Archives of Clinical Neuropsychology : The

Official Journal of the National Academy of Neuropsychologists, 22(3), 389–404.

doi:10.1016/j.acn.2007.01.013

(33)

32

Mini-Mental State Examination in established Alzheimer disease? Results from a national dementia research register. Int J Geriatr Psychiatry, 28(4), 351–355.

Marschark, M. (2003). Interactions of language and cognition in deaf learners: from research to practice. International Journal of Audiology, 42 Suppl 1, S41–8.

Retrieved from http://www.ncbi.nlm.nih.gov/pubmed/12918609

Mioshi, E., Dawson, K., Mitchell, J., Arnold, R., & Hodges, J. R. (2006). The

Addenbrooke’s Cognitive Examination Revised (ACE-R): a brief cognitive test battery for dementia screening. International Journal of Geriatric Psychiatry,

21(11), 1078–1085. doi:10.1002/gps.1610

Nasreddine, Z. S., Phillips, N. A., Bédirian, V., Charbonneau, S., Whitehead, V., Collin, I., … Chertkow, H. (2005). The Montreal Cognitive Assessment, MoCA: a brief screening tool for mild cognitive impairment. Journal of the American

Geriatrics Society, 53, 695–699. doi:10.1111/j.1532-5415.2005.53221.x

Neary, D., Snowden, J. S., Gustafson, L., Passant, U., Stuss, D., Black, S., … Benson, D. F. (1998). Frontotemporal lobar degeneration: a consensus on clinical diagnostic criteria. Neurology, 51(6), 1546–54. Retrieved from

http://www.ncbi.nlm.nih.gov/pubmed/9855500

Peterson, B. S. (2000). Regional Brain Volume Abnormalities and Long-term Cognitive Outcome in Preterm Infants. JAMA, 284(15), 1939.

doi:10.1001/jama.284.15.1939

Petitto, L. A., & Marentette, P. F. (1991). Babbling in the manual mode: evidence for the ontogeny of language. Science (New York, N.Y.), 251, 1493–1496.

doi:10.1126/science.2006424

Powers, S., Gregory, S., & Thoutenhoofd, E. (1999). The educational achievements of deaf children: a literature review. Deafness & Education International, 1(1), 1–

9.

Rogers, K. D., Young, A., Lovell, K., & Evans, C. (2013). The Challenges of Translating the Clinical Outcomes in Routine Evaluation–Outcome Measure (CORE-OM) Into British Sign Language. Journal of Deaf Studies and Deaf Education, 18(3), 287–298. doi:10.1093/deafed/ent002

(34)

33

Schembri, A., Fenlon, J., Rentelis, R., Reynolds, S., & Cormier, K. (2013). Building the British Sign Language Corpus. Language Documentation and Conservation, 7, 136-154

Sign Health. (2014). A report into the health of deaf people in the UK. Beaconsfield: Sign Health.

Stamp, R., Schembri, A., Fenlon, K., Rentelis, R., Woll, B., & Cormier, K. (2014). Lexical variation and change in British Sign Language Stamp. PLoS One. Sutton-Spence, R. (2007). Mouthings and simultaneity in British Sign Language. In

M. Vermeerbergen, L. Leeson, & O. Crasborn (Eds.), Simultaneity in signed languages (pp. 147–162). Amsterdam: Benjamins.

Sutton-Spence, R., & Woll, B. (1999). The Linguistics of BSL: An Introduction. Cambridge: Cambridge University Press.

Takano, T., Morimoto, M., Bamba, N., Takeuchi, Y., & Ohno, M. (2006). Frontal-dominant white matter lesions following congenital rubella and cytomegalovirus infection. Journal of Perinatal Medicine, 34(3), 254–5.

doi:10.1515/JPM.2006.049

Vernon, M. (2005). Fifty years of research on the intelligence of deaf and hard-of-hearing children: a review of literature and discussion of implications. Journal of Deaf Studies and Deaf Education, 10(3), 225–31. doi:10.1093/deafed/eni024

Vinson, D. P., Cormier, K., Denmark, T., Schembri, A., & Vigliocco, G. (2008). The British Sign Language (BSL) norms for age of acquisition, familiarity, and iconicity. Behavior Research Methods, 40(4), 1079–1087.

doi:10.3758/BRM.40.4.1079

Wechsler, D. (1997). Wechsler Adult Intelligence Scale- 3rd Edition (WAIS-3). San Antonio, TX: Harcourt Assessment.

(35)

34

Tables

ACE-R item Score BSL-CST item Score Source Modifications/Justification

O

rien

ta

tion

Orientation to time: day, date month, year, season

Orientation to place: building, floor, town, country, county

5

5

Day, date month, year, season

Building, floor, town, country

5

4

Translated from ACE-r

Seasons were listed

County was removed due high error rate

A tten tion Serial 7s Spell WORLD backwards 5 (higher score of the two tasks)

Fingerspell DEAF backwards. Fingerspell the name CHRIS backwards

4 5

Novel DEAF selected as universally known spelling. Names are usually fingerspelled in BSL giving ecological validity. Ability to spell forwards was checked

- - Tapping task: tap the table when you

see the fingerspelled letter ‘A’ 1 Adapted from MoCA

Letter stimuli were fingerspelled rather than spoken

- - Months of the year backwards 1 Novel Months of year are universally familiar to UK signers

M

emo

ry

Memory immediate and delayed recall: LEMON, KEY, BALL

6 Memory immediate and delayed recall: BALL, TREE, PEN

6 Adapted from ACE-r

Signs used have low regional variability and historic change

Name and address

Immediate (3 trials) Delayed

Recognition

7 7 6

Learning novel information about a Deaf man (name, age, wife’s name, where lives and school attended). Immediate recall (3 trials)

Delayed Recognition

6 6 5

(36)

35 Anterograde and

retrograde memory: Name of current prime minister, Name of former woman prime minister, Name of USA president, Name of USA president who was assassinated in 1960s

4 Name of current prime minister, Name of former woman prime minister

First name of the Queen, Name of royal who died in a car crash

4 Translated from ACE-r

Novel

[image:36.842.70.777.70.459.2]

Retrograde memory question about historic figure well known in the Deaf community, Princess Diana (Former patron of British Deaf Association) V erbal flue ncy Verbal fluency Letter

7 - - - Not used due to reliance on English

vocabulary

Verbal fluency Animals

7 Semantic Sign fluency for animals 7 Adapted from ACE-r

Instructions are modified using example of fluency for food

Language

Language

Language comprehension: Written instruction ‘Close your eyes’

1 - - - Not used due to reliance on written English

Comprehension Three stage

command: ‘Take the paper in your right hand. Fold in half. Put the paper on the floor’

3 BSL three stage command: ‘Take the paper in your right hand’. Fold in half. Put the paper on your lap’

3 Adapted from ACE-r

Put on your lap’ was substituted for ‘Put on the floor’ to make it more suitable for testing infirm patients.

In the translated version the signs used model the precise actions required and which hand to use. This means that impaired performance is more significant. Sentence production

‘Write a sentence’ (must contain subject and verb)

1 BSL Sentence production: ‘Look at picture. There are two people, tell me what they are doing?’ Response must contain; 2 nouns 2 verbs and be a coherent sentence

(37)

36 Word repetition: hippopotamus, eccentricity, unintelligible, statistician

2 - - - Not used due to reliance on spoken English.

Signs are not multisyllabic so there is no equivalent measure

Sentence repetition 1 BSL sentence repetition 15 Novel Scoring acknowledges flexibility in word order allowed by BSL grammar

Object naming Pencil, watch

2 BSL object naming straw, candle

2 Novel The signs for ‘pencil’ and ‘watch’ are similar to their gestural form, so these were replaced with objects eliciting low frequency signs for which gestures are less easily mistaken. Picture naming 10 BSL picture naming: 9 Novel BSL naming task elicits signs with low

iconicity and familiarity ratings to ensure that targets cannot be guessed due to visual iconicity or gesturability

Language comprehension questions

4 BSL Language comprehension questions

5 Novel Novel questions related to the picture naming items. Participants respond by pointing to the correct picture.

Reading irregular words

1 - - - Not used due to reliance on written English

V isuo spa tial Copy overlapping pentagons

1 Copy wire cube 1 Translated from

ACE-r

No modifications

Copy wire cube 2 Copy wire cube 2 Translated from

ACE-r

No modifications

Perceptual abilities

Count the dots

4 Count the dots 4 Translated from

ACE-r

No modifications

Perceptual abilities: Identify degraded letters

4 Identify degraded letters 4 Translated from ACE-r

(38)

37 E x ec uti v e fun c tion

Clock drawing: ‘Draw a clock face with

numbers and hands at ten past five’

5 Clock drawing: ‘Draw a clock with numbers and hands to show the time at 1:45’

5 Adapted from ACE-r

1:45 was used in preference to ten past five because in BSL the latter gives greater clue to the correct placement of clock hands. We subsequently decided to sign 1:45 in a spatially neutral way as ONE POINT FORTY FIVE.

- - Alternating trails: Draw a line alternating between numbers and letters.

1 Translated from MoCA

Additional reinforcement of instructions.

Total score ACE-R 100 Total BSL-CST 110

[image:38.842.69.695.71.315.2]

S u b com p o n ent s Attention & Orientation /18 Memory /26 Fluency /14 Language /26 Visuospatial /16 Orientation /9 Attention /11 Memory /27 Fluency /7 Language /39 Visuospatial/perceptual /11 Executive function /6

(39)
[image:39.595.65.536.148.736.2]

38

Table 2 Demographic variables, mean BSL-CST scores, standard deviations and statistical values

Variable N=226 Percent M (SD) r/rs /F/t

Age 92.79 (9.70)

r(224)=-0.430 p=<0.001*

50-59 51 22.6 97.41 (8.26) F(39,186)=2.078

p<0.001* d=3.305*

60-69 76 33.6 95.16 (9.72)

70-79 50 22.1 89.60 (8.72)

80-89 49 21.7 87.55 (8.62)

Gender

Female 144 63.7 91.24 (10.18) t(224)=-1.815

p=0.71

Male 82 36.3 93.67 (9.34)

Region

South East England 105 46.5 92.66 (9.70) t(223)=-0.225

p=0.822

Other UK regions 120 53.1 92.95 (9.76)

Age became deaf rs(224)=-0.071

p=0.289

Age of BSL acquisition r(224)=-0.038

(40)

39

Native 27 11.9 97.74 (12.06) F(39,184)=1.083

p=0.354

Early (1-5 yrs) 92 40.7 92.42 (8.63)

Late (6+ yrs) 105 46.4 91.79 (9.67)

Cause of deafness

Genetic 72 31.9 95.51 (9.37) F(39,182)=1.464

p=0.051

Organic 48 21.2 92.19 (7.98)

Other/unknown 102 45.1 91.05 (10.25)

Years of education (from 5 yrs)

r(224)=0.365 p=<0.001*

7-9 32 14.2 89.28 (11.11) F(4, 220)=8.401

p=<0.001* d=3.743*

10-12 149 65.9 91.59 (9.36)

13-14 24 10.6 96.79 (7.50)

15-16 14 6.2 101.71 (2.55)

17-21 5 2.2 104.60 (4.93)

(41)

40

Professional 7 3.1 103.14 (7.22) F(39, 186)=

1.698 p=<0.01* d=3.634*

Intermediate 7 3.1 102.14 (4.18)

Skilled 79 35.0 94.23 (8.51)

Semi-skilled 76 33.6 91.78 (9.48)

Unskilled 57 25.2 89.72 (10.54)

Educational attainment

Degree/postgraduate 11 4.9 104.45 (3.67) F(39,186)=3.021

p=<0.001* d=4.504*

A level or equivalent 4 1.8 103.00 (4.24)

O level/CSE/GCSE or equivalent 13 5.8 98.46 (6.92)

BSL teaching 13 5.8 98.46 (8.45)

Vocational 43 19.0 96.23 (9.16)

None 142 62.8 89.51 (8.93)

Attended selective school

Yes 17 7.5 99.82 (5.16) t(26.81)=5.363

p=<0.001* d=0.799

No 206 91.2 92.17 (9.83)

(42)
[image:42.595.66.508.94.332.2]

41 Table 3 Demographics for control and dementia groups

Control N=226 Dementia N=14 Mann

Whitney U

M SD Min-Max M SD

Min-Max

Age 68.26 10.24 50-89 76.93 9.53 54-83 ‡

Years of education 11.38 2.11 4-20.5 10.77 0.68 9-11.5

Age of BSL acquisition

6.39 5.11 0-40 5.14 2.65 0-11

BSL-CST scores (Max. score 110)

92.79 9.70 56-108 54.00 9.35 43-71 †

[image:42.595.66.520.406.628.2]

†p<0.001, ‡p<0.01 (Mann-Whitney U test, two-tailed)

Table 4 Age band percentile scores for BSL-CST

Age band

(years)

Percentile scores

1st - 2nd 5th 10th 25th 50th 75th 90th

50-59 77 79.2 82.2 92 101 103 107.4

60-69 73

*outliers removed

77 83.1 91 97 102.8 107

70-79 66 71.7 79 84 90 96.5 102.5

(43)

42

Table 5 Mean scores and standard deviations for age bands and years of education groups

Years of education is measured from 5 years onwards.

2 cases with missing years of education information

Years of Education

Whole sample All <=12 >12

N 226 181 43

M 92.79 91.18 99.30

SD 9.70 9.70 6.64

50-59 yrs All <=12 >12

N 51 35 16

M 97.41 95.37 101.88

SD 8.26 8.54 5.58

60-69 yrs All <=12 >12

N 76 56 19

M 95.16 93.80 98.79

SD 9.72 10.38 6.55

70-79 yrs All <=12 >12

N 50 45 5

M 89.60 89.07 94.40

SD 8.72 8.58 9.45

80-89 yrs All <=12 >12

N 49 45 3

M 87.55 86.78 97.00

(44)
[image:44.595.75.529.112.543.2]

43

Table 6 Comparison of control and dementia groups aged 70-89 years on demographics, BSL-CST score and subcomponents

Control N=99 Dementia N=11 Mann

Whitney U

M SD Min-Max M SD

Min-Max

Age 78.0 5.73 70-89 80.82 5.38 73-88

Years of education 10.60 1.48 7-15.5 10.69 0.80 9-11.5

Age of BSL acquisition

6.58 5.15 0-40 5.09 1.81 2-9

BSL-CST score (Max. score 110)

88.59 8.69 65-105 51.91 8.79 43-71 †

Orientation (9) 7.91 1.03 5-9 3.91 1.37 1-5 †

Attention (11) 8.66 2.29 1-11 3.64 3.67 0-10 †

Memory (27) 22.73 3.64 12-27 10.36 5.39 2-21 †

Fluency (7) 4.42 1.71 1-7 1.64 1.43 0-4 †

Language (39) 31.15 3.42 22-38 21.36 4.37 15-27 †

Visuospatial/ perceptual (11)

10.00 1.15 6-11 8.73 1.35 7-11 ‡

Executive function (6)

3.71 1.53 0-6 2.27 1.35 0-5

(45)
[image:45.595.66.273.125.304.2]

44

Table 7 Sensitivity-specificity trade-offs of different cut scores on the BSL-CST

BSL-CST Sensitivity Specificity

<68 0.86 0.018

<70 0.86 0.022

<71 1.00 0.022

<72

<74

<76

1.00

1.00

1.00

0.027

0.035

(46)

45

Figure legends

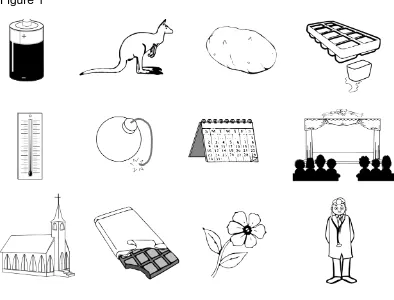
Figure 1 BSL-CST picture naming

Figure 2 Target picture for BSL sentence production

Figure 3 Scattergraph showing BSL-CST scores and best fit lines for control and dementia groups

Figure 4 Scattergraph showing BSL-CST scores and WASI Matrix Reasoning t scores for control and dementia groups

Figure 5 Boxplot showing mean BSL-CST scores and standard deviations of age of BSL acquisition groups in normative sample (n=226)

Figure 6 Receiver Operating Characteristic curve for BSL-CST composite score

[image:46.595.72.466.385.685.2]

Figures

(47)
[image:47.595.72.327.104.506.2]

46 Figure 2

(48)
[image:48.595.80.516.123.489.2]
(49)
[image:49.595.83.455.90.420.2]
(50)
[image:50.595.78.451.84.402.2]
(51)
[image:51.595.127.406.114.415.2]

Figure

figure well known in the Deaf community, Princess Diana (Former patron of British Deaf Association)
Table 1shows ACE-R and BSL-CST items, domains, subcomponents and provides details about translated, adapted and novel items
Table 2 Demographic variables, mean BSL-CST scores, standard deviations and statistical values
Table 3 Demographics for control and dementia groups
+7

References

Related documents