Comparison of three climatic zoning methodologies for
1building energy efficiency applications
23
Angélica Walsh
1, Daniel Cóstola
2,3, Lucila Chebel Labaki
1 41 - UNICAMP State University of Campinas, Brazil 5
2 -University of Strathclyde, Scotland, United Kingdom 6
3- IMED - Faculdade Meridional, Brazil 7
8
9
Abstract
10
Climatic zoning for building energy efficiency applications is a key element in many programs and policies to 11
improve thermal performance of buildings. In spite of its importance, there is no consensus about the appropriate 12
methodology for climatic zoning. Previous studies indicate a large variety of methods and parameters used in climatic 13
zoning: degree-days, cluster analysis and administrative divisions are some of the most widely used. This study reports 14
and discusses results obtained with these three methodologies for Nicaragua, a small country in Latin America. Results 15
indicate a high level of agreement between the different methodologies, but they also disagree on the appropriate 16
classification of a significant amount of the area of the country (37% of Nicaragua’s territory). The three methodologies 17
have strengths and weaknesses, and at the moment it is impossible to conclude which one is the most appropriate to 18
support building energy efficiency programs and policies. Results of this paper highlight the need for procedures and 19
performance indicators to assess the validity of climatic zoning (which shall be addressed by future studies) 20
21
Keywords: Climatic zoning, building energy efficiency, cluster analysis, degree-days method. 22
1
Introduction
1
Climatic zoning for building energy efficiency applications is a key element in many programs and policies to improve 2
thermal performance of buildings [1–5]. For this reason, climatic zoning has been widely implemented all over the world 3
since the 1940's covering at least 54 countries which are responsible for more than 85% of the world primary energy 4
consumption and host approximately 71% of the world’s population. Despite this wide use, there is no consensus on the 5
appropriate methodology to conduct climatic zoning for building energy efficiency applications [6]. This lack of 6
consensus is noticeable by the large number of climatic zoning methodologies, variables and parameters currently 7
applied by different countries to define climatic zones [7–26]. 8
Climatic zoning for building energy efficiency purposes based on degree-days [27] is one of the most used 9
methodologies, being adopted in more than 20 countries all over the world [6]. This approach is commonly defined as the 10
sum, on a daily basis, of the difference in temperature between the outdoor mean temperature over a 24-hour period and a 11
given base temperature [27,28]. Degree-days allow straightforward comparison between climates and show a high 12
correlation with energy use by heating, ventilation and air conditioning (HVAC) systems [28], particularly in cold 13
climates. In spite of this correlation, the degree-days method provides a partial understanding of the climate, as it 14
disregards other climatic variables that may be relevant for energy consumption of buildings depending on the nature of 15
the building and its location [29–31]. These additional variables are particularly important in hot humid climates, where 16
ventilation, solar gains and latent loads have a large influence on building energy performance and thermal comfort [32]. 17
For this reason, the degree-days method is often used in combination with other variables in the definition of climatic 18
zoning, particularly with relative humidity [1]. 19
Although less common than the degree-days method, cluster analysis is becoming more used in many areas related to 20
climate classification for building energy efficiency purposes [13,33–35]. Cluster analysis is a multivariate pattern 21
recognition technique that handles various climatic variables simultaneously for a wide range of research questions [36– 22
44]. This technique makes possible the use of a large range of climatic and geographical variables which may influence 23
building energy performance, avoiding oversimplifications of climatic zoning methods based on a single or few 24
variables. 25
Other parameters that are not directly climate-dependent are often used in the definition of climatic zones for 26
buildings, like size of urban agglomeration [13] or administrative divisions. Administrative divisions have been used in at 27
least 10 countries to support climatic zones for building energy efficiency programs [12,14,45]. Some countries adopt 28
administrative divisions (county or state level) as climatic zones [12]. In other cases, the lack of high resolution weather 29
division as climatic zoning criteria is the ease that this brings to the application of energy efficiency codes. 2
This large variety of methodologies for climatic zoning gives raise to criticism towards them [2,47–51]. Other factors 3
influencing such criticism are the arbitrary definition of the number of zones, zoning resolution and uncertainties in the 4
position of boundaries between zones [45,47]. This situation may compromise the adoption of building energy policies 5
and programs based on climatic zoning; therefore, further studies are needed to investigate the most appropriate 6
methodology for climatic zoning. 7
Limitations of current climatic zoning methodologies are particularly relevant in tropical climates where, in many 8
cases, buildings do not have HVAC systems. These buildings are usually poorly insulated and have stronger interaction 9
with climate than buildings with HVAC, being therefore more affected if climatic zoning ignores relevant climatic 10
variables. In these countries, climatic zoning poses additional challenges as building performance is usually measured 11
using frequency of discomfort rather than using energy consumption of HVAC systems [32,52–54]. Such a change in 12
performance indicator brings new decision criteria for climatic zoning methodologies, as variables with minor impact in 13
buildings with HVAC systems (e.g. wind speed and direction) may have a major impact in occupants’ thermal comfort in 14
naturally ventilated buildings. 15
In the past, a number of qualitative comparisons were published on the overall features of climatic zoning 16
methodologies [1,6,55]. These studies provide relevant information, however, few efforts have been made by contrasting 17
results obtained using existing methods, exploring points of agreement and also identifying areas that may be 18
misclassified by one particular method. The inexistence of this sort of studies comparing the climatic zoning process 19
pointing out their challenges and capabilities, hinder the decision-making process. 20
This article addresses the issue exposed above by providing the first systematic comparison of results obtained with 21
three climatic zoning methods: degree-days, cluster analysis and the use of climatic zones matching administrative 22
divisions. These methodologies are responsible for approximately 54 % of the climatic zoning currently being used 23
worldwide (29 out of 54 countries covered in a recent review [6]). Most countries adopt a given methodology and apply 24
it to define their climatic zones, with no attempt to contrast results obtained using other methodologies. In the present 25
study, these three methodologies were applied to generate different climatic zoning maps for Nicaragua, a small country 26
in Central America, highlighting strengths and weaknesses of each methodology. This sort of comparison has not been 27
reported in the literature to the best of authors’ knowledge. 28
The paper is structured as follows: Section 2 describes the materials and methods used in the application of the three 29
methodologies and Section 4 provides a discussion of these results. Conclusions are summarized in Section 5. This paper 1
also provides metadata supported by Elsevier including climate files, data pre and post processing scripts and geographic 2
information system (GIS) files. Future research can rely on these data and analysis as a test bench, something 3
fundamental in our point of view, to support the development of new, more reliable and transparent climatic zoning 4
methodologies. 5
2
Materials and methods
6
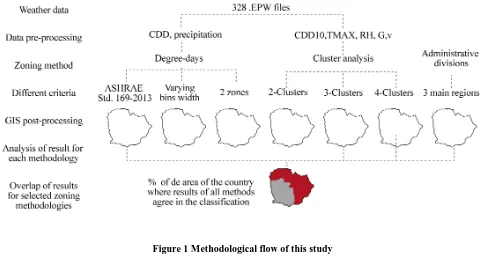
The methodological flow of this research is synthesized in Figure 1. A detailed description of the area addressed in this 7
study, climatic data sources and each climatic zoning method are described below. 8
[image:4.595.55.539.281.557.2]9
Figure 1 Methodological flow of this study
10 11
2.1 Area addressed in this study 12
A tropical country with subtle climatic variations situated in Central America (Nicaragua) was chosen for this study. 13
Nicaragua has no energy regulation for buildings [56,57], resulting in buildings with either high energy consuming 14
HVAC systems or low thermal comfort in those with no HVAC. The lack of regulations makes Nicaragua a potential 15
candidate for climatic zoning implementation with no bias towards any existing methodology. Hence, this country is 16
ideal for the present study because findings will be solely seen from the scientific point of view, with no direct 17
implications on existing policies. It is also a small country, which highlights climatic variations in small territories and 18
favors comparisons of different climatic methods. This section briefly describes the country geography and climate, in 19
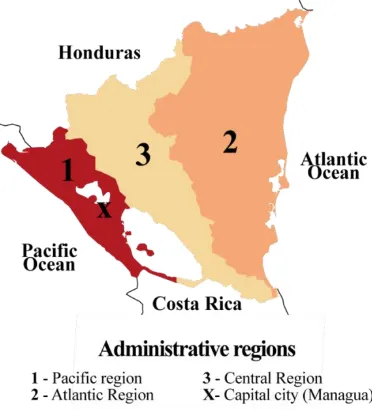
Latitude and 86˚ and 87˚ West Longitude. It has an area of 130 000 km² and it is divided into three administrative regions 2
depicted in Figure 2a: the Pacific Region which is the smallest, driest and warmest region of the country, the Central 3
Region, presenting the coolest and highest areas of the country (up to 2100 m altitude); and the Atlantic Region, 4
presenting the largest and most humid areas of the country. Figure 2a also shows population density data that reveals 5
large concentrations in the Pacific region, close to the capital Managua and the lakes Xolotlán and Cocibolca. The three 6
administrative divisions are largely conditioned by the country topography (Figure 2b). Figure 2c, 2d and 2e, show 7
average values of temperatures, annual precipitation and relative humidity. The next section describes the climatic data 8
sources used in the present study. [58], c [59], [59] [60] 9
10
11
Figure 2 a) Nicaragua regions and population density, b) topography [57], c) average annual temperatures [58],
12
d) annual precipitation [58] and e) average annual relative humidity [59]
[image:5.595.48.537.287.724.2]2.2 Climatic data sources 1
Weather data quality and coverage vary from country to country. The present study is not primarily focused on data 2
availability and treatment, therefore weather was considered a boundary condition of this work. As such, the study was 3
conducted using data provided by Autodesk Green Building Studio (GBS) [61,62]. GBS weather data was chosen for 4
being capable of providing accurate values [63] of several climatic variables, at high temporal and spatial resolution 5
(hourly data for a typical year at a spatial resolution of approximately 20km for all over the world). GBS weather data is 6
based on a combination of observational data and weather modelling using the Rapid Update Cycle (RUC) [64] and 7
Mesoscale Meteorological Model version 5 (MM5) [65]. GBS weather data is available in binary DOE2 format including 8
hourly data of dry bulb temperature, dew point temperature, relative humidity, wind speed and direction, direct normal 9
radiation, global and diffuse horizontal radiation, total sky cover for 8760 hours of the year. In this study, GBS weather 10
data for 328 locations was used in the climatic zoning. 11
2.3 Methods for climatic zoning
12
2.3.1 Degree-days
13
There are several degree-days calculation methods applied for climatic zoning [27,45,66,67]. In this study, Cooling-14
Degree Days base Cº10 (here referred as CDD10) was calculated based on the ASHRAE method [27]. Weather data from 15
328 locations in Nicaragua were converted to Energy plus files (.EPW) using Elements tool [68]. EPW files were used in 16
the conversion tool from EnergyPlus V 8.5 [69] to generate reports of CDD10. These reports were exported to ArcGis 17
10.4 [70] where CDD10 maps were generated. Interpolation was performed based on the inverse distance 18
weighting method [71]. Based on this data, four maps were generated. 19
In the first map, CDD10 was plotted with no specific bands definition using gradient colors in order to have a detailed 20
representation of the variation of CDD10 in space. Based on the first CDD10 map, climatic zones were defined in a 21
second map according to the limits in ASHRAE Standard 169-2013 [27], as summarized in Figure 3. Zones based on 22
CDD10 were then refined based on precipitation (a proxy for humidity levels) using the algorithm in ASHRAE Standard 23
169-2013, summarized in Table 1 [27]. The impact of precipitation on climatic zoning was calculated for each location 24
by implementing this algorithm on the algebra raster calculator of Arcgis 10.4. 25
Two additional climatic zoning options were developed in order to explore other zoning thresholds than the ones 26
prescribed by ASHRAE Standard 169-2013. The third CDD10 map was developed using the limits proposed by 27
ASHRAE shifted by +500 CDD10. This map was used to investigate the robustness of climatic zoning to uncertainties in 28
the threshold between zones. A fourth CDD10 map was developed by dividing in only two zones the range of CDD10 29
Figure 3 ASHRAE climate zones as function of heating and cooling degree-days [27]
2 3
2.3.2 Cluster analysis
4
There are different cluster analysis techniques used either alone or in combination with factor analysis or principal 5
component analysis to pre-process data and reduce the number of variables for clustering [13,72–75]. In this study, the 6
spatial statistic tool from Arcgis10.4 was used for cluster analysis based on five climate variables (CDD10 calculated as 7
described in Section 2.3.1, maximum temperatures (TMAX), average annual relative humidity (RH), total annual global 8
solar radiation (G) and average annual wind speed (v)). This selection of variables aims at complementing the classic 9
degree-days variables (CDD10 and humidity) with information on daily amplitude (maximum temperatures), radiation 10
level (strongly affected by nebulosity and altitude) and wind speed. This selection of variables was also kept small and 11
simple in order facilitate comparison with other climatic zoning methods. 12
Climate data was extracted from GBS binary files using the weather statistic and conversion tool from EnergyPlus 13
v8.5. MatlabR2014 routines were created in order to automatically extract relevant values and export them to Arcgis 10.4 14
in comma separated values (.CSV) format. Cluster analysis was carried out using spatial constraints based on the K-15
nearest neighbors algorithm [76], to ensure that climatic zones would not be fragmented over the territory. All the 16
variables were equally weighted and normalized. Different maps with two, three and four clusters were generated, 17
accompanied by graphs depicting climatic variables in each of the clusters in each map. 18
2.3.3 Administrative division
19
Administrative boundaries between the three main geographic regions of Nicaragua (Central, Atlantic and Pacific Region 20
2.3.4 Results analysis approach 1
The main analysis of this paper is concerned with the identification of areas of the country where different climatic 2
zoning methodologies provide the same classification, i.e. all methodologies provided identical results. The percentage of 3
these areas was calculated and reasons for such agreement are discussed. Areas with overlap of some, but not all, results 4
were then identified. Reasons for disagreement in classifications by different climatic zoning methodologies are 5
discussed, as well as the possible implications of misclassifying each area. 6
7
3
Climatic zoning results using different methodologies
8
3.1 Climatic zoning based on degree-days
9
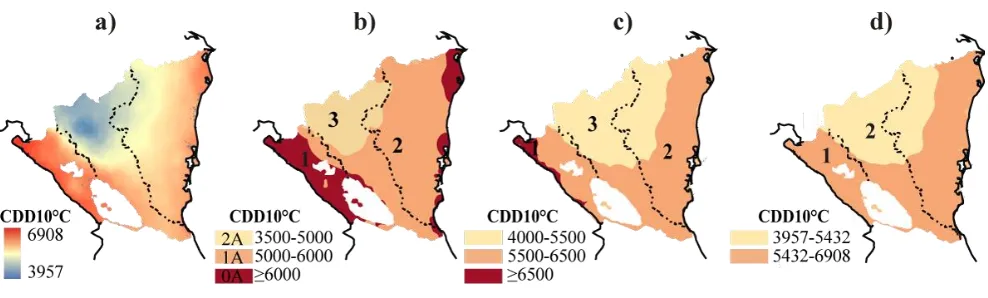
Results of CDD10 for the Nicaraguan territory were initially plotted for visualization purposes considering a global 10
distribution of degree-days with no specific bands definition (Figure 4a). They show significant differences in climate in 11
spite of the small country area. As can be noticed, there is a colder zone in the central-north region, which is coincident 12
with higher altitudes. The Pacific Region (where most of the population lives) represents the hottest regions of the 13
country. Figure 4b shows the climatic zoning according to ASHRAE Standard 169-2013 limits [27], where Nicaragua 14
presents three climate classifications: 0A, 1A and 2A. In spite of having dry regions, the whole of Nicaragua is 15
considered a moist climate based on the ASHRAE criteria described in Table 1. In this paper, these zones are renamed as 16
1, 2 and 3 in order to facilitate comparison with results obtained using other climatic zoning methodologies (presented in 17
the following sections). It is noticeable that ASHRAE bins are not uniform and can be considered to a certain degree as 18
arbitrary. Even if the bins had the same width, the comparison of Figure 4b and Figure 4c, where bins were shifted +500 19
CDD10, reveals that the same methodology could be used to obtain climatic zoning with significant differences. Such 20
variation can be further observed by reducing the number of zones to two (Figure 4d). Results in Figure 4 indicate the 21
importance of defining adequate bins, but at the moment there are no criteria or methods based on extensive studies and 22
empirical evidence to guide this decision. Consequently, when applying the degree-day method most countries adopt bins 23
proposed by ASHRAE as no scientifically proven alternative is available.
Figure 4 Maps using degree-days method a) distribution of degree-days using color gradient, b) zones based on
2
bins according to the ASRHAE Standard 169-2013, c) zones using a set of alternative bins width and d) zones
3
based on two custom bins
4 5
3.2 Climatic zoning based on cluster analysis
6
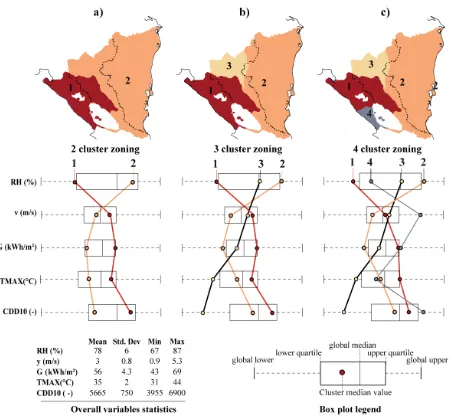
Figure 5a, Figure 5b and Figure 5c show maps of climatic zoning using two, three and four clusters respectively. Each 7
map is accompanied by a box plot, showing the mean value in each cluster for each of the five climatic variables used in 8
the cluster analysis. These box plots indicate the minimum, median, maximum values and quartiles for each variable used 9
in the analysis considering climatic variations in the entire country. 10
The zoning with two clusters (Figure 4a) shows zones of similar size, one close to the Pacific and another in the 11
Atlantic region. From the boxplot, it is clear that this zoning is mainly driven by differences in temperatures, humidity 12
and solar radiation. Zone 1 is hot and dry, with CDD10 and solar radiation close to the total upper quartile, relative 13
humidity in the lower quartile and maximum temperature close to the upper quartile (low humidity is associated with 14
larger daily amplitude and higher maximum temperatures). Zone 2 is more humid and less hot than zone 1, with an 15
opposite behavior of climatic variables in the boxplot. Figure 5a is significantly different from the degree-days results 16
using two zones (Figure 5d), where temperature differences driven by altitude played a major role. It may be possible, 17
but unlikely, that Figure4a or Figure 5d is ideal climatic zoning for Nicaragua. Unfortunately, there are no tested means 18
reported in the literature to verify this claim. This large discrepancy in classification using degree-days and clusters may 19
actually indicate that such low resolution (i.e. two zones) is not sufficient to capture the climatic variation in this country. 20
For this reason, climatic zoning with only two zones is not further considered as a viable option for climatic zoning in 21
this case study and it is assumed that major discrepancies between results of state-of-the-art climatic zoning 22
methodologies may indicate problems in the zoning resolution. 23
Figure 5b shows the three-cluster climatic zoning map with zones associated with the Pacific and Atlantic coasts and 24
remains unchanged, while zone 2 was divided creating zone 3. Zone 3 is the least hot zone in this country, characterized 1
by low values of temperature-related variables and intermediate values of relative humidity, wind speed and solar 2
radiation. The three-cluster climatic zoning shows major similarities with the zoning using ASHRAE method of degree-3
days (Figure 5b). The implications of such similarities will be further discussed in Section 4. 4
Figure 5c shows the four-cluster climatic zoning map in which zone 1 was divided creating a new zone 4, enhancing 5
the resolution of the zoning in the Pacific coast. Zones 1 and 4 show remarkable differences when data in the box plot is 6
analyzed. Zone 4 has higher humidity, higher wind speed and lower maximum temperatures, which can be explained by 7
the presence of a large mass of water in lake Cocibolca and the narrowness of that region contributing to the increase of 8
air currents. This feature of Zone 4 has not been captured by degree-days zoning nor in the three cluster zoning. While 9
the use of four climatic zones refines the understanding of the climate, it is unclear if differences between zones 1 and 4 10
are significant in terms of building performance. The zoning process is based on compromising accuracy to achieve a 11
reliable, yet simple, set of climate zones. With no information on actual building performance in these areas it is 12
Figure 5 Climatic zoning using cluster analysis with a) two-cluster zoning, b) three-cluster zoning and c)
four-2
cluster zoning (accompanied by boxplots showing standardized values of variables used in the analysis).
3 4
3.2 Climatic zoning based on administrative divisions
5
In this study, administrative boundaries between the three main regions (Figure 6) were adopted as boundaries of a 6
possible climatic zoning. In Nicaragua, as in many countries, geographical features were important driving forces in the 7
occupation of the territory with direct impact in the definition of administrative zones. Most of these geographical 8
features are also important drivers of climatic variation, therefore it is no surprise that Figure 6 shows a remarkable 9
resemblance with climatic zoning results obtained with degree-days (Figure 4b) and cluster analysis (Figure 5b). The 10
only major difference resides on the south part of zone 3, as this area is consistently classified as zone 2 by the degree-11
days and cluster analysis methods. This area is not very populated (see Figure 2a) and one may argue that misclassifying 12
administrative divisions. None of the climatic zoning methodologies adopts information on building energy performance, 1
therefore it is impossible to assess the impact of using Figure 6 as the climatic zoning of Nicaragua based on the analysis 2
provided in this paper. 3
[image:12.595.214.400.141.346.2]4
Figure 6 Climatic zoning based on administrative division
5 6
4
Comparison of climatic zones results obtained using different methodologies
2
Figure 7 Areas of overlap between different climatic zoning results
3 4
Figure 7 shows a map indicating the overlap areas of different climatic zoning results described in the previous sections, 5
i.e degree-days (Figure 4b), three-cluster and four–cluster zoning (Figure 5b and Figure 5c) and administrative divisions 6
(Figure 6). The comparison of results of different models is a recognized technique in the assessment of model quality 7
[77]. This section identifies the regions where different climatic zoning provide similar results and regions where they 8
disagree, supporting a discussion about the strengths and weaknesses of each methodology. 9
Areas 1, 2 and 3 (Figure 7) indicates regions where all methodologies consistently result in the same climatic zoning. 10
That area corresponds to 63% of the country land area and for these regions any methodology can be used as results will 11
be identical. Such a level of agreement using significantly different state-of-the-art methodologies gives confidence that 12
the climatic zoning in this region represents the best knowledge current available in this field. However, as in any 13
intermodel-comparison exercise, the fact that all methodologies indicate the same zoning for Area 1, 2 and 3 does not 14
ensure that building energy performance will have a perfect correspondence to climatic zoning. That area only indicates 15
that, for this particular country, a high level of agreement is achieved using current methodologies for climatic zoning, 16
including Administrative Division which has no direct connection with climate or building performance. 17
can be considered significant from a thermal performance point of view. However, each climatic variable contributes in 1
different ways to thermal balance and varies through the time. One climatic variable should not be analyzed separately 2
from the others. While dry bulb temperature between points on Area 1 and 3 varies almost homogeneously throughout 3
the year, the global solar radiation varies dynamically, presenting differences that range from 3% to 30% (Figure 8b). 4
This last variable is extremely important for thermal performance of buildings located in tropical latitudes, as it is usually 5
the main source of heat gains contributing to rising indoor temperatures.´ 6
7
Figure 8 a) Distinctive difference in temperature between two points located in Area 1 and 3 and b) similarities in
8
monthly global solar radiation values.
9
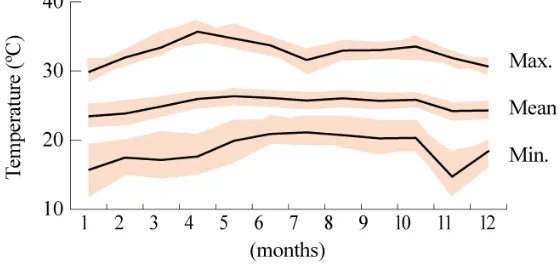
Even though all the methodologies agree in the classification of Areas 1, 2 and 3, a significant variation of 10
temperature was encountered in certain regions, for instance in Area 2 (Atlantic Coast). The temperature variation of 11
each point located in this region was examined throughout the year. Figure 9 shows differences in minimum temperatures 12
among different points within the zone reaching almost 10°C. Maximum and mean temperatures show minor variations 13
when compared with minimum temperatures, however, such differences may imply different thermal performance 14
variations of buildings demanding distinctive requirements to reach thermal comfort. 15
[image:14.595.52.526.213.382.2]16
Figure 9 Significant variation of temperature within the Area 2 (Monthly maximum, minimum and mean dry
17
bulb temperature)
[image:14.595.167.447.563.695.2]method (Figure 4b), but is classified as zone 2 by all other methods (Figure 5 and Figure 6). Figure 4a shows that this 2
area is not significantly warmer than the adjacent one. However, the arbitrary bins adopted in the ASHRAE method 3
would separate the Atlantic region in two zones while locals may understand it as a reasonably uniform area in terms of 4
weather. Figure 10 further illustrates how similar is the temperature behavior through the year in this area when 5
compared with the adjacent one (Area 2). Maximum temperatures encountered in Area A are closer to temperature 6
ranges of Area 2 than the area 1. Nevertheless Area A belongs to Zone 1 according to the ASHRAE bins (Zone 1 in 7
Figure 4b). Such arbitrary definition of bins may create tension in the implementation of policies based on climatic 8
zoning. The arbitrary nature of bins to define zones is exemplified in the comparison of Figure 4b and Figure 4c, both 9
based on the same degree-day data (from Figure 4a) but relying on slightly different bins. In Figure 4c, the areas close to 10
the Atlantic are unified in a single zone, while a new zone of extreme hot climate appears in the Pacific coast. The 11
proposal in Figure 4c is neither better nor worse than the one based on ASHRAE bins, as the small zone close to the 12
Pacific will suffer from problems described above, i.e. different climatic zoning for neighboring areas seen as identical 13
by locals. The issues posed by Area A in Figure 7 demonstrate the limitations of arbitrary bins for climatic zoning. 14
Climatic zoning is usually adopted to define suitable building characteristics (e.g. U-value and window-to-wall-ratio 15
(WWR)) or performance targets (e.g. primary energy consumption below a certain threshold). Arbitrary bins are not 16
connected to either building characteristics or performance targets, which undermines decision making in the climatic 17
zoning process. The information produced in the present study is insufficient to describe if Area A (Figure 7) should be 18
included in zone 1 or 2; however, it is clear that more rigorous approaches are necessary to support the definition of bins 19
for climatic zoning purposes. 20
[image:15.595.154.433.539.675.2]21
Figure 10 Few differences in maximum temperature variation between Area A2 and B
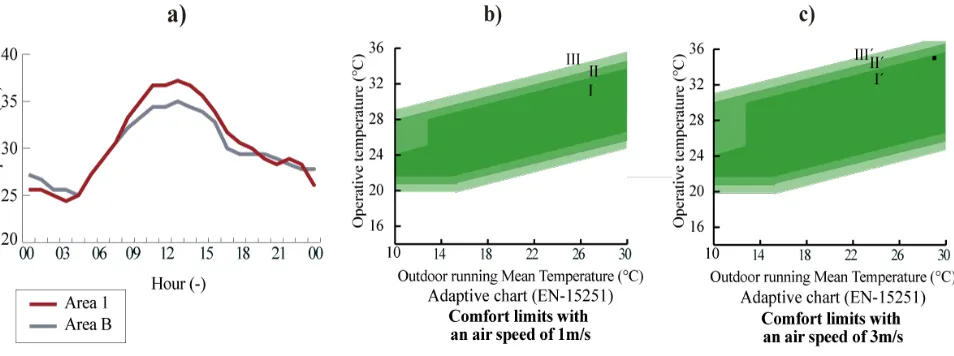
Area B (Figure 7, in gray) highlights the results of the four-cluster climatic zoning discussed in Section 3.2 (Figure 5c). 1
The higher wind speeds and lower extreme temperatures of this area when compared with the rest of the Pacific region 2
are important features for the design of passive strategies, particularly in naturally ventilated buildings and these features 3
were not identified in the other methodologies covered in this paper. An increase in wind speed implies a wider range of 4
comfort temperatures (ref), which means that passive strategies can be enough to achieve thermal comfort for wider 5
periods. In figure 11C, an adaptive chart based on the EN-15215 comfort model is illustrated considering a wind speed 6
of 3m/s and an air temperature of 35°C. This thermal condition can be encountered in area B, and comfort is achieved for 7
category I…. In contrast, an adaptive chart showing a thermal situation encountered in Area 1 (illustrated in Figure 11b) 8
which in addition of having higher temperatures, has lower air velocities than area B, reflects than comfort can only be 9
achieve using active systems ( such as Air conditioning). Area B is densely occupied, so differences in climatic zoning 10
would have direct impact on the construction industry. Therefore, one may argue it is reasonable to adopt this region as a 11
separate climatic zone based on data in the boxplot graph and climatic charts of Figure 11. However, it is impossible to 12
take an informed decision based only on the information provided in this study, i.e. with no information on the actual 13
building performance variation in this region. Climatic zoning usually implies that “In the context of building 14
regulations, climatic zones are regions which exhibit similar meteorological conditions for the main climatic parameters 15
which affect the heating and cooling energy requirements of buildings” [2]. This weather-centered definition of climatic 16
zoning is valid for the degree-days methods and cluster methods, and yet, it does not support decision making regarding 17
which of them is the most suitable for the case of Nicaragua. This dilemma is clearly exemplified by Area B (Figure 7). 18
[image:16.595.58.535.507.685.2]19
Figure 11 Comparison of two points located in Area A1 and C a) a typical summer day temperature oscillation
20
and b) annual frequency distribution of wind speed.
and cluster analysis. This case was discussed in Section 3.3 and highlights the conflict between simplicity and accuracy 2
in climatic zoning. As in other regions previously discussed in this section, the lack of building performance data for this 3
region hinders an informed decision on adopting the administrative division of this case study as climatic zoning. 4
Area D (Figure 7, in light gray) shows the transition region between zones, where a large disagreement is observed in 5
results by different climatic zoning methodologies. The exact position of boundaries in all climatic zoning methodologies 6
used in this study is a somehow arbitrary. While the exact boundary position is irrelevant for the bulk region representing 7
the climatic zone, the regions close to these boundaries are directly affected by changes in zoning and energy policy. 8
Being on the “right” side of the boundary may influence building requirements, subsidies, performance targets and other 9
aspects with high impact in the construction industry. Area D shows that a significant part of the country is affected by 10
uncertainties in the definition of boundaries for climatic zoning. Figure 12 shows how difficult is to classify that area, 11
whose temperature behavior falls in the middle of two adjacent and distinctive zones (Area 1 and Area 3). Just by taking 12
into account air temperature, it could be argue that this area should belong to Area 2, like in the CDD map (Figure 4b), 13
however, other important features for thermal comfort and passive strategies like relative humidity are significantly 14
different between points located in areas 2 and D Figure 12b. Differences in relative humidity also implies different 15
passive strategies, such as evaporative cooling whose potential is more meaningful in hot and dry climates(ref). 16
17
18
Figure 12 a) Transition area monthly temperature behavior compared with two points of Area A1, A2 and A3, b)
19
Mean monthly relative humidity in two points located in area 2 and D
20 21
In spite of all the limitations of the climatic zoning methods exposed above, it is important to emphasize that degree-22
days method has proven to be one of the most used method for climatic zoning and has many advantages over the cluster 23
[image:17.595.65.533.465.639.2]context as long as temperature data is available. In contrast, cluster analysis may provide results that imply more 1
complex relationships between climatic variables, and consequently, more numerous data entry. Its success depends a lot 2
on the proper selection of those input variables and many decisions criteria taken during the process, e.g. Spatial 3
constraints. Judgment must be used in many stages of analysis cluster analysis, which provides the means for decision 4
making and customization in the climatic zoning process [1]. 5
Building energy performance data obtained by simulation or measurements could be used in future works to overcome 6
current climatic zoning limitations, shedding light in the complex relation between climate, climatic zoning and thermal 7
performance of buildings. Building performance indicators and performance variation threshold vary substantially from 8
building to building, as each building has different sensitive to climatic variables due to its particular geometry, 9
fenestration and orientation. These differences in sensitivity from different buildings suggest that the definition or 10
validation of climatic zones must be preceded by the definition of one or more representative buildings. Energy 11
performance data obtained through simulation for a reasonable sample of the building stock targeted in the climatic 12
zoning could improve the decision-making process. Depending on the specific purpose of the climatic zoning, such data 13
could be crossed with climatic zones boundaries to identify the level of agreement between climatic zones and building 14
energy performance. This analysis may enable impartial comparison between climatic zoning obtained using different 15
methodologies. And eventually choose the one with the best performance. 16
17
5
Conclusions
18
Based on the data and analysis provided in this paper, the following conclusions can be drawn: 19
Comparison of results from different climatic zoning methodologies has clarified some of their strengths and 20
weaknesses proving to be a useful approach to study existing methodologies. 21
Comparison of results from different climatic zoning methodologies has been useful to demonstrate the 22
minimum required resolution in the particular case study addressed in this paper. The division of Nicaragua into 23
two zones based on degree-days and cluster analysis proved to be insufficient to capture climatic variations 24
throughout the country, as results using different climatic zoning methodologies are significantly different. 25
The methodologies analyzed in this paper showed a significant level of agreement in the zoning of a small 26
country in Central America (63% of the territory). 27
In 37% of the country analyzed in this study, one or more climatic zoning methodologies provides a different 28
result, showing that the selection of the method for climatic zoning for building energy efficiency purpose plays 29
There is a high uncertainty in transition areas, which may result in building requirements with no direct 1
connection to performance. 2
Cluster analysis provides a more comprehensive understanding of the climate than the degree-days method and 3
administrative divisions, which is demonstrated in the case study by the identification of a zone with moderate 4
climate on the Pacific coast of Nicaragua. 5
In spite of all, degree-days method has many advantages over the cluster method, such as the 6
easy of application and reduced number of input variables. This method can be applied in any context as long as 7
temperature data is available. In contrast, cluster analysis may provide results that imply more complex 8
relationships between climatic variables, and consequently, more numerous data entry. Its success depends a lot 9
on the proper selection of those input variables and many decisions criteria taken during the process 10
Administrative division provided results very similar to degree-days and cluster analysis for the case study of 11
Nicaragua, despite not being a directly climate-dependent parameter. 12
Climatic zoning based purely on weather data is inherently based on arbitrary definitions of number of zones and 13
threshold between zones. There is no evidence that building requirements or building performance would be the same 14
throughout the zone, nor that two zones would lead significantly different performance or requirements. 15
This work could not identify procedures nor performance indicators to assess the quality or validity of climatic 16
zoning results. Without modelling studies, it is not possible to understand which climatic zoning methodology provides 17
the most appropriate results for building energy policy and regulations. Future work must address this need in order to 18
support decision making on climatic zoning. 19
Acknowledgement
20
This study was partially supported by the Brazilian National Council for the Improvement of Higher Education (CAPES) 21
[grant number 15283127] and the Brazilian National Council for Scientific and Technological Development (CNPq) 22
[grant number 311641/2013-0]. The authors would like to thank Dr. Paul Strachan for his valuable comments regarding 23
this manuscript. 24
References
25
[1] R.S. Briggs, R.G. Lucas, Z.T. Taylor, Climate classification for building energy codes and standards, in: 26
ASHRAE Trans., Atlanta, USA, 2003. 27
[2] M. Carpio, J. Jódar, M.L. Rodíguez, M. Zamorano, A proposed method based on approximation and 28
interpolation for determining climatic zones and its effect on energy demand and CO2 emissions from buildings, 29
[3] K. Tsikaloudaki, K. Laskos, D. Bikas, On the establishment of climatic zones in Europe with regard to the energy 1
performance of buildings, Energies. 5 (2012) 32–44. 2
[4] M.K. Singh, S. Mahapatra, S.K. Atreya, Development of bio-climatic zones in north-east India, Energy Build. 39 3
(2007) 1250–1257. 4
[5] A.H.A. Mahmoud, An analysis of bioclimatic zones and implications for design of outdoor built environments in 5
Egypt, Build. Environ. 46 (2011) 605–620. 6
[6] A. Walsh, D. Cóstola, L.C. Labaki, Review of methods for climatic zoning for building energy efficiency 7
programs, Build. Environ. 112 (2017) 337–350. 8
[7] IRAM, Norma IRAM 11603-1996: acondicionamiento térmico de edificios: clasificación bioambiental de la 9
Republica Argentina, Buenos Aires, Argentina, 2011. 10
[8] ADEREE, Les éléments techniques du projet de la réglementation thermique du bâtiment au Maroc, Rabat, 11
Maroc, 2011. 12
[9] Department of building and housing, Compliance document for New Zealand building code clause H1 energy 13
efficiency, New Zeland, 2011. 14
[10] F.J.S. de la Flor, S.Á. Domínguez, J.L.M. Félix, R.G. Falcón, Climatic zoning and its application to spanish 15
building energy performance regulations, Energy Build. 40 (2008) 1984–1990. 16
[11] F.J. Moral, E. Pulido, A. Ruíz, F. López, Climatic zoning for the calculation of the thermal demand of buildings 17
in Extremadura (Spain), Theor. Appl. Climatol. (2016). 18
[12] ANER, Zonage climatique pour la Tunisie, 2004. 19
[13] J. Arenes, P. Elias, Classification climatique des communes françaises, CSTB, Paris, 2003. 20
[14] Ministry of the Environment- Department of the Built Environment, National building code of Finland, Part D5, 21
Calculation of energy consumption and heating power of buildings, (2007) 246. 22
[15] D.J. Park, K.H. Yu, Y.S. Yoon, K.H. Kim, S.S. Kim, Analysis of a building energy efficiency certification 23
system in Korea, Sustainability. 7 (2015) 16086–16107. 24
[16] M. Evans, B. Shui, T. Takagi, Country report on building energy codes in Japan, Pacific Northwest National 25
Laboratory, Richland, WA, 2009. 26
[17] ANSI/ASHRAE/IESNA, ANSI/ASHRAE/IES Standard 90.1-2010. Energy standard for buildings except low-27
rise residential buildings, 2010. 28
[18] CEC, California energy maps, (2016). http://www.energy.ca.gov/maps/renewable/building_climate_zones.html 29
EPBD in Greece, Energy Policy. 45 (2012) 469–477. 2
[20] C.C.S. Lau, J.C. Lam, L. Yang, Climate classification and passive solar design implications in China, Energy 3
Convers. Manag. 48 (2007) 2006–2015. 4
[21] Y.J. Huang, J.J. Deringer, Status of energy efficient building codes in Asia, Asia business council, 2007. 5
[22] Turkish Standards Institution, Turkish Standard TS 825: Thermal Insulation requirements for buildings, Ankara. 6
Turkey, 2009. 7
[23] M. Roriz, E. Ghisi, R. Lamberts, Bioclimatic zoning of Brazil: a proposal based on the Givoni and Mahoney 8
methods, in: 16th Int. Conf. Passiv. Low Energy Archit., Brisbane, Australia, 1999. 9
[24] O. Rakoto-Joseph, F. Garde, M. David, L. Adelard, Z.A. Randriamanantany, Development of climatic zones and 10
passive solar design in Madagascar, Energy Convers. Manag. 50 (2009) 1004–1010. 11
[25] J. Khedari, A. Sangprajak, J. Hirunlabh, Thailand climatic zones, Renew. Energy. 25 (2002) 267–280. 12
[26] S. Bodach, W. Lang, Design guidelines for energy-efficient hotels in Nepal, Int. J. Sustain. Built Environ. 5 13
(2016) 411–434. 14
[27] ASHRAE, Standard 169-2013, Climatic Data for Building Design Standards, 2013. 15
[28] CIBSE, Degree-days: theory and application, KenButcher, CIBSE, London, 2006. 16
[29] M. De Rosa, V. Bianco, F. Scarpa, L.A. Tagliafico, Historical trends and current state of heating and cooling 17
degree days in Italy, Energy Convers. Manag. 90 (2015) 323–335. 18
[30] A. Makhmalbaf, V. Srivastava, N. Wang, Simulation-based weather normalization approach to study the impact 19
of weather on energy use of buildings in the U.S., in: 13th Conf. Int. Build. Perform. Simul. Assoc., Le Bourget 20
Du Lac, France, 2013: pp. 1436–1444. 21
[31] M. Bessec, J. Fouquau, The non-linear link between electricity consumption and temperature in Europe: A 22
threshold panel approach, Energy Econ. 30 (2008) 2705–2721. 23
[32] A. Rackes, A.P. Melo, R. Lamberts, Naturally comfortable and sustainable: Informed design guidance and 24
performance labeling for passive commercial buildings in hot climates, Appl. Energy. 174 (2016) 256–274. 25
[33] K.K.W. Wan, D.H.W. Li, L. Yang, J.C. Lama, Climate classifications and building energy use implications in 26
China, Energy Build. 42 (2010) 1463–1471. 27
[34] E. Erell, B. A. Portnov, Y. Etzion, Mapping the potential for climate-conscious design of buildings, Build. 28
Environ. 38 (2003) 271–281. 29
1797–1801. 1
[36] M. Heidarinejad, M. Dahlhausen, S. McMahon, C. Pyke, J. Srebric, Cluster analysis of simulated energy use for 2
LEED certified U.S. office buildings, Energy Build. 85 (2014) 86–97. 3
[37] G. Ciulla, V. Lo Brano, A.D. Amico, Modelling relationship among energy demand , climate and office building 4
features : A cluster analysis at European level, Appl. Energy. 183 (2016) 1021–1034. 5
[38] C.M.R. Do Carmo, T.H. Christensen, Cluster analysis of residential heat load profiles and the role of technical 6
and household characteristics, Energy Build. 125 (2016) 171–180. 7
[39] Y. Unal, T. Kindap, M. Karaca, Redefining the climate zones of Turkey using cluster analysis, Int. J. Climatol. 8
23 (2003) 1045–1055. 9
[40] G.F.M.-Y.C.F. Robert, Climate zones of the conterminous United States defined using Cluster Analysis., (1993). 10
[41] A.K. Jain, Data clustering: 50 years beyond K-means, Pattern Recognit. Lett. 31 (2010) 651–666. 11
[42] T. Nocke, H. Schumann, U. Böhm, Methods for the visualization of clustered climate data, Comput. Stat. 19 12
(2004) 75–94. 13
[43] J. Van Wart, L.G.J. van Bussel, J. Wolf, R. Licker, P. Grassini, A. Nelson, H. Boogaard, J. Gerber, N.D. Mueller, 14
L. Claessens, M.K. van Ittersum, K.G. Cassman, Use of agro-climatic zones to upscale simulated crop yield 15
potential, F. Crop. Res. 143 (2013) 44–55. 16
[44] M. Bador, P. Naveau, E. Gilleland, M. Castellà, T. Arivelo, Spatial clustering of summer temperature maxima 17
from the CNRM-CM5 climate model ensembles & E-OBS over Europe, Weather Clim. Extrem. 9 (2015) 17–24. 18
[45] UNDP/GEF and MPWT/DGU, Climatic zoning for buildings in Lebanon. Project capacity building for the 19
adoption and application of thermal standards for buildings, 2005. 20
[46] NatHERS Climate Zones and Weather Files, (2013). http://www.nathers.gov.au/nathers-accredited-21
software/nathers-climate-zones-and-weather-files (accessed November 16, 2016). 22
[47] D.W. Ware, P. Bozorgchami, Energy efficiency comparison-California’s Building Energy Efficiency Standards 23
and the IECC and ASHRAE standard 90.1, CEC, 2013. 24
[48] K. Bawaneh, M. Overcash, J. Twomey, Climate zones and the influence on industrial nonprocess energy 25
consumption, J. Renew. Sustain. Energy. 3 (2011) 0–8. 26
[49] T.A.L. Martins, L.S. Bittencourt, C.M.L.B. Krause, Contribuição ao zoneamento bioclimático brasileiro: 27
reflexões sobre o semiárido nordestino, Ambient. Construído. 12 (2012) 59–75. 28
[50] B. Rodríguez-Soria, J. Domínguez-Hernández, J.M. Pérez-Bella, J.J. Del Coz-Díaz, Review of international 29
[51] S. Pusat, I. Ekmekci, A study on degree-day regions of Turkey, Energy Effic. 9 (2016) 525–532. 2
[52] A.S. Silva, E. Ghisi, R. Lamberts, Performance evaluation of long-term thermal comfort indices in building 3
simulation according to ASHRAE Standard 55, Build. Environ. 102 (2016) 95–115. 4
[53] G. Bravo, E. González, Thermal comfort in naturally ventilated spaces and under indirect evaporative passive 5
cooling conditions in hot-humid climate, Energy Build. 63 (2013) 79–86. 6
[54] R.J. De Dear, T. Akimoto, E.A. Arens, G. Brager, C. Candido, K.W.D. Cheong, B. Li, N. Nishihara, S.C. Sekhar, 7
S. Tanabe, J. Toftum, H. Zhang, Y. Zhu, Progress in thermal comfort research over the last twenty years, Indoor 8
Air. 23 (2013) 442–461. 9
[55] J.M. Evans, Zonificación bioambiental en Latinoamérica para una arquitectura sustentable, Av. En Energías 10
Renov. Y Medio Ambient. 8 (2004) 163–168. 11
[56] K. Janda, Worldwide status of energy standards for buildings: a 2009 update, in: European Council for an 12
Energy-Efficient Economy (Ed.), Energy Effic. SummerStudy, Colle Sur Loop, 2009: pp. 485–491. 13
[57] J. Iwaro, A. Mwasha, A review of building energy regulation and policy for energy conservation in developing 14
countries, Energy Policy. 38 (2010) 7744–7755. 15
[58] NASA/JPL/NGA, http://www2.jpl.nasa.gov/srtm/central_america.html, SRTM Cent. Am. Images. (2016). 16
[59] R.J. Hijmans, S.E. Cameron, J.L. Parra, P.G. Jones, A. Jarvis, Very high resolution interpolated climate surfaces 17
for global land areas, Int. J. Climatol. 25 (2005) 1965–1978. 18
[60] INETER, Atlas Climático Nicaragua, (2001). http://web-19
geofisica.ineter.gob.ni/mapas/Nicaragua/clima/atlas/index.html (accessed November 21, 2016). 20
[61] S. Malkin, Weather data for building energy analysis, Weather Forecast. (2008) 1–12. 21
[62] Jan L.M. Hensen, R. Lamberts, (editors), Building performance simulation for design and operation, Spon Press, 22
New York, 2011. 23
[63] L.O. Degelman, Testing the accuracy of synthetically-generated weather data for driving building energy 24
simulation model., in: Build. Simul., IBPSA, Beijing, 2007: pp. 1–8. 25
[64] S.G. Benjamin, D. Dévényi, S.S. Weygandt, K.J. Brundage, J.M. Brown, G. a. Grell, D. Kim, B.E. Schwartz, 26
T.G. Smirnova, T.L. Smith, G.S. Manikin, An Hourly Assimilation–Forecast Cycle: The RUC, Mon. Weather 27
Rev. 132 (2004) 495–518. 28
[65] G.A. Grell, J. Dudhia, D.R. Stauffer, A description of the fifth-generation Penn State/NCAR Mesoscale Model 29
[66] M. Roriz, Segunda proposta de revisão do zoneamento bioclimático do Brasil, ANTAC, São Carlos, 2012. 1
[67] P. Borah, M.K. Singh, S. Mahapatra, Estimation of degree-days for different climatic zones of North-East India, 2
Sustain. Cities Soc. 14 (2015) 70–81. 3
[68] Rocky Mountain Institute, Elements, (2015). http://bigladdersoftware.com/projects/elements/ (accessed 4
November 21, 2016). 5
[69] EERE, United States Department of Energy, (2015). 6
http://apps1.eere.energy.gov/buildings/energyplus/?utm_source=EnergyPlus&utm_medium=redirect&utm_camp 7
aign=EnergyPlus+redirect+1 (accessed November 21, 2016). 8
[70] ESRI, ArcGIS Desktop: 10.4, (2016). 9
[71] J. Li, A.D. Heap, A review of spatial interpolation methods for environmental scientists, Geosci. Aust. 68 (2008) 10
137. 11
[72] L. Lebart, A. Morineau, M. Piron, Statistique exploratoire multidimensionnelle, Dunod, Paris, 1995. 12
[73] B.Y.M. Ahmed, Climatic classification of Saudi Arabia: An application of factor-cluster analysis, GeoJournal. 41 13
(1997) 69–84. 14
[74] Applied Research Institute-Jerusalem, Climatic zoning for energy efficient buildings in the Palestinian Territories 15
(the West Bank and Gaza), 2003. 16
[75] L. Domingo, D. Kalz, A. Dinkel, L. Lomardo, V. Silva, Definição de uma classificação climática para o estudo 17
de edificações com balanço anual zero de energia no Brasil, in: XV Encontro Nac. Tecnol. Do Ambient. 18
Construido, Maceió, Brazil, 2014: pp. 213–222. 19
[76] A. Mitchell, The ESRI Guide to GIS Analysis, Volume 2, ESRI Press, 2005. 20
[77] R.D. Judkoff, J. Neymark, The BESTEST method for evaluating and diagnosing building energy software, 21
ACEE Summer Study Energy Effic. Build. (1998) 175–192. 22
23
![Figure 2 a) Nicaragua regions and population density, b) topography [57], c) average annual temperatures [58], d) annual precipitation [58] and e) average annual relative humidity [59]](https://thumb-us.123doks.com/thumbv2/123dok_us/1497308.102432/5.595.48.537.287.724/figure-nicaragua-population-topography-temperatures-precipitation-relative-humidity.webp)
![Figure 3 ASHRAE climate zones as function of heating and cooling degree-days [27]](https://thumb-us.123doks.com/thumbv2/123dok_us/1497308.102432/7.595.177.419.68.278/figure-ashrae-climate-zones-function-heating-cooling-degree.webp)