S T A T I S T I S C H E S A M T
DER E U R O P Ä I S C H E N G E M E I N S C H A F T E N
O F F I C E S T A T I S T I Q U E
DES C O M M U N A U T É S E U R O P É E N N E S
Γ DE
MM U. IROPÄ
I
EURO: MICA
ΈΑ DEL C
jÉEBtJfl m "7r\ MICA EUROPEA
-MEIN:
NOM
COi
ι
y^
Ace
—ƒ
I ^f
GMEEN
, \ ^ E > JNE I
EURC
IAP VOOR \
INDUSTRIESTATISTIK
STATISTIQUES INDUSTRIELLES
STATISTICHE DELL'INDUSTRIA
INDUSTRIESTATISTIEK
INDUSTRIAL STATISTICS
No.4-1972
STATISTISCHES AMT
DER EUROPÄISCHEN GEMEINSCHAFTEN Anschriften
Luxemburg, Centre Louvigny, Postfach 1907- Tél. 288 31
1040 Brüssel, Bâtiment Berlaymont, 200, rue de la Loi (Verbindungsbüro) — Tel. 35 80 40
OFFICE STATISTIQUE
DES COMMUNAUTES EUROPEENNES Adresses
Luxembourg, Centre Louvigny, Boîte postale 1907- Tel. 288 31
1040 Bruxelles, Bâtiment Berlaymont, 200, rue de la Loi (Bureau de liaison) — Tél. 35 80 40
ISTITUTO STATISTICO DELLE COMUNITÀ EUROPEE Indirizzi
Lussemburgo, Centre Louvigny, Casella postale 1907— Tel. 288 31
1040 Bruxelles, Bâtiment Berlaymont, 200, rue de la Loi (Ufficio di collegamento) — Tel. 35 80 40
BUREAU VOOR DE STATISTIEK DER EUROPESE GEMEENSCHAPPEN Adressen
Luxemburg, Centre Louvigny, Postbus 1907- Tel. 288 31
1040 Brussel, Bâtiment Berlaymont, Wetstraat 200 (Verbindingsbureau) — Tel. 35 80 40
STATISTICAL OFFICE
INDUSTRIESTATISTIK
STATISTIQUES INDUSTRIELLES
STATISTICHE DELL'INDUSTRIA
INDUSTRIESTATISTIEK
INDUSTRIAL STATISTICS
Inhaltswiedergabe nur mit Quellennachweis gestattet
La reproduction des données est subordonnée à l'indication de la source
La riproduzione del contenuto è subordinata alla citazione della fonte
Vorwort
Die ¡m ersten Teil des Heftes enthaltenen Indizes der industriellen Produktion
werden auf der Basis 1963 = 100 veröffentlicht. Die Indizes für die 6 EWG-Länder
werden zum Teil von den Mitgliedstaaten selbst auf dieser Basis berechnet und
zur Verfügung gestellt, teilweise aber vom SAEG umgerechnet. Die Gewichtung
der nationalen Indizes zu Gemeinschaftsindizes basiert auf der
Bruttowert-schöpfung zu Faktorkosten in 1965. Der zweite Teil enthält die
mengen-mäßigen Produktionsergebnisse von ungefähr 500 Erzeugnissen. Die
Produk-tionsindizes Deutschlands beziehen sich auf das Bundesgebiet und Berlin (West),
während die mengenmäßigen Produktionsangaben erst ab 1964 auch die
Pro-duktion in Berlin (West) enthalten.
Das Statistische Amt möchte an dieser Stelle den internationalen und nationalen
Dienststellen, den Regierungsbehörden und Fachverbänden, die am Aufbau
einer europäischen Industriestatistik mitgearbeitet haben, seinen besten Dank
ausdrücken.
Avertissement
Les indices de la production industrielle contenus dans la première partie de ce
bulletin sont publiés sur la base 1963 = 100. Les indices concernant les 6 pays de
la CEE sont partiellement calculés sur cette base et communiqués par les États
membres eux-mêmes, mais en partie convertis par l'OCSE. La pondération des
indices nationaux en indices communautaires se fonde sur la valeur brute aux
coûts des facteurs en 1965. La deuxième partie porte sur la production en unités
physiques d'environ 500 produits. Les indices allemands de production couvrent
le territoire fédéral et Berlin (Ouest); les données sur la production en unités
physiques de l'Allemagne comprennent seulement à partir de 1964 la production
de Berlin (Ouest).
L'Office statistique tient à remercier les organismes internationaux et nationaux,
gouvernementaux et professionnels, qui ont bien voulu apporter leur concours à
l'édification d'une statistique industrielle européenne.
Avvertenza
Gli indici della produzione industriale contenuti nella prima parte del presente
bol-lettino sono pubblicati con base 1963 = 100. Gli indici concernenti i paesi della
CEE sono in parte calcolati su questa base e comunicati dagli stessi paesi membri e
in parte convertiti dall'ISCE. La ponderazione degli indici nazionali negli indici
comunitari si fonda sul valore grezzo al costo dei fattori nel 1965. La seconda parte
riguarda la produzione in unità fisiche di circa 500 prodotti. Gli indici tedeschi si
riferiscono al territorio federale e Berlino (occidentale), mentre le cifre di
produ-zione per la Germania comprendono solamente dal 1964 anche la produprodu-zione di
Berlino (occidentale).
L'Istituto statistico ringrazia qui le organizzazioni internazionali e nazionali,
gover-native e professionali che hanno voluto concorrere ad edificare una statistica
indu-striale europea.
Voorwoord
De in het eerste deel van dit bulletin opgenomen produktie-indices zijn
gepubli-ceerd op basis 1963 = 100. De op de 6 EEG-Staten betrekking hebbende indices
zijn gedeeltelijk door de Lid-Staten op deze basis berekend en ter beschikking
gesteld, gedeeltelijk door het BSEG omgerekend. De weging van de nationale
indices tot gemeenschapsindices berust op de bruto toegevoegde waarde tegen
factorkosten in 1965. In het tweede deel zijn de produktiecijfers in absolute
hoe-veelheden van ongeveer 500 produkten opgenomen. De Duitse produktie-indices
hebben betrekking op het federaal territorium m.i.v. Berlijn (West); de absolute
produktiegegevens van Duitsland omvatten eerst van 1964 af de produktie in
Berlijn (West).
INHALTSVERZEICHNIS
TABLE DES MATIÈRES
Vorbemerkung Inhaltsverzeichnis Zeichen und Abkürzungen
1. Teil : Indizes der industriellen Produktion in den Mitgliedstaaten der Gemeinschaft und in einigen dritten Ländern
2. Teil : Angaben über die Produktion von Grund stoffen und Fertigerzeugnissen in der Gemeinschaft
Kohlenbergbau; Brikettfabriken; Kokereien
Gewinnung von Mineralöl und Erdgas; Mineralölverarbei-tung
Elektrizitäts- und Gaserzeugung Gewinnung von Erzen
Eisen- und stahlerzeugende Industrie (gemäß dem EGKS-Vertrag)
Stahlröhrenerzeugung; Ziehereien und Kaltwalzwerke . .
Erzeugung und erste Verarbeitung von NE-Metallen . . Gewinnung von Baumaterial und feuerfesten und
kera-mischen Erden Ziegeleien
Herstellung von Baumaterialien und sonstigen Erzeug-nissen aus Steinen und Erden
Herstellung und Verarbeitung von Glas
Herstellung von Steinzeug, Feinkeramik und feuerfesten Erzeugnissen
Herstellung chemischer Erzeugnisse Chemiefasererzeugung
Gießereien; Schmiede-, Preß- und Hammerwerke sowie Stahlverformung
EBM-Warenherstellung Maschinenbau
Herstellung von Büromaschinen Elektrotechnische Industrie Fahrzeugbau
Feinmechanische- und Uhrenindustrie
Herstellung von Ölen und Fetten tierischer und pflanzlicher Herkunft
Nahrungsmittelindustrie Getränke- und Tabakindustrie
Textilindustrie (Spinnerei und Weberei) Wirkerei und Strickerei
Sonstiges Textilgewerbe Herstellung von Leder Schuhindustrie
Herstellung von Bekleidung und Wäsche Holzverarbeitung (außer Möbelherstellung)
Papier-und Pappenerzeugung und-Verarbeitung. . . . Gummiverarbeitung
Seite - Page 3 4 6
21
23
24 26 27
28 30
31
32 33
34 35
37 39 50
51 52 53 60 61 64 67
68 69 73 74 78 79 80 81 83 86 88 91 95
[image:6.595.61.542.35.711.2]Avertissement Table des matières
Abréviations et signes employés
1r o partie: Indices de la production industrielle dans
les pays de la Communauté et certains pays tiers
2° partie : Données sur la production dans la Com munauté de certaines matières de base et d'articles élaborés
Extraction et agglomération de combustibles solides; coke-ries
Extraction de pétrole et de gaz naturel; raffinage du pétrole Production d'électricité et de gaz
Extraction de minerais
Sidérurgie (selon le traité CECA) Première transformation de l'acier
Production et première transformation des métaux non ferreux
Extraction de matériaux de construction et de terres à feu Fabrication de matériaux de construction en terre cuite Matériaux de construction et produits minéraux non
métal-liques
Industrie du verre
Fabrication des grès, porcelaines, faïences et produits réfrac-taires
Industrie chimique
Production de fibres artificielles et synthétiques
Fonderies; forge, estampage, emboutissage et industries connexes
Fabrication d'outillage et d'articles finis en métaux Construction de machines non électriques Construction de machines de bureau
Construction électrique
Construction de matériel de transport Mécanique de précision et horlogerie
Industrie des corps gras végétaux et animaux Industries alimentaires
Industrie des boissons et tabacs Industrie textile (filature et tissage) Bonneterie
Autres industries textiles Tannerie - mégisserie Industrie des chaussures
Fabrication des articles d'habillement
INDICE
INHOUDSOPGAVE
Avvertenza Indice
Abbreviazioni e simboli impiegati
1" parte : Indice della produzione industriale nei paesi della Comunità e in alcuni paesi terzi
2" parte : Dati sulla produzione di alcune materie prime ed articoli elaborati nella Comunità
Estrazione e agglomerazione di combustibili solidi; cokerie Estrazione di petrolio e di gas naturale; industria petrolifera Produzione di elettricità e di gas
Estrazione di minerali metallici Siderurgia (secondo il trattato CECA) Prima trasformazione dell'acciaio
Produzione e prima trasformazione di metalli non ferrosi . Estrazione di materiali da costruzione e di terre refrattarie
e per ceramica
Fabbricazione di materiale da costruzione in laterizio . .
Materiali da costruzione e prodotti minerali non metallici. Industria del vetro
Fabbricazione di grès, porcellane, maioliche, terrecotte e prodotti refrattari
Industrie chimiche
Produzione di fibre artificiali e sintetiche
Fonderie; forgiatura, stampaggio, imbutitura e industrie collegate
Fabbricazione di utensili e articoli finiti in metallo . . . Costruzione di macchine non elettriche
Costruzione di macchine per ufficio
Costruzione di macchine e materiale elettrico Costruzione di materiale da trasporto Meccanica fine ed orologeria
Industria dei grassi vegetali e animali Industrie alimentari
Industrie delle bevande e del tabacco Industria tessile (filatura e tessitura)
Fabbricazione di tessuti a maglia, maglierie e calze . . Altre industrie tessili
Concia del cuoio e delle pelli Industria delle calzature
Fabbricazione di articoli d'abbigliamento e biancheria . .
Industria del legno (esclusa l'industria del mobile) . . . Industria della carta e della sua trasformazione . . . . Trasformazione della gomma
Costruzione e genio civile
Elenco delle note pubblicate nella serie « Statistiche
Pagina - Blz
3 5 7
21
23 24 26 27 28 30 31
32 33
34 35
37 39 50
51
52 53 60 61 64 67
68 69 73 74 78 79 80 81 83
86 88 91 95
Voorwoord Inhoudsopgave Tekens en afkortingen
Deel 1 : Indices van de industriële produktie in de landen van de Gemeenschap en in enige derde landen
Deel 2 : Produktiecijfers van enige basisgrondstof fen en bewerkte produkten in de Gemeen schap
Winning en bewerking van vaste brandstoffen, cokesoven-bedrijven
Aardolie- en aardgaswinning; aardolie-industrie Elektriciteits- en gasbedrijven
Winning van ertsen
IJzer- en staalindustrie (volgens EGKS-Verdrag) Stalenbuizenfabrieken; trekkerijen en koudwalserijen Vervaardiging en bewerking van non-ferrometalen Winning van bouwmaterialen en van vuurvaste
kerami-sche klei
Baksteen- en dakpannenfabrieken
Bouwmateriaalfabrieken; bewerking van niet-metalen mine-ralen
Glas- en glaswarenfabrieken
Aardewerkfabrieken; vuurvast-materiaalfabrieken Chemische industrie
Kunstmatige en synthetische vezelfabrieken
Gieterijen; smeed-, pers-, stampwerk, e.d.
Gereedschappen-, ijzer-, staal- en andere metaalwaren-fabrieken
Machinebouw
Bureaumachinefabrieken Elektrotechnische industrie Transportmiddclonindustrie
Fijnmechanische en uurwerkindustrie
Vervaardiging van oliën en vetten van dierlijke of plant-aardige oorsprong
Voedingsmiddelenindustrie
Vervaardiging van dranken; tabaksnijverheid Textielnijverheid (spinnerij en weverij) Tricot- en kousenindustrie
Overige textielnijverheid Leerlooierijen
Schoenindustrie
Vervaardiging van kleding en huishoudgoederen
Verwerking van hout (met uitzondering van de vervaar-diging van meubelen)
Vervaardiging van papier en papierwaren Rubberfabrieken
Bouwnijverheid
ZEICHEN UND ABKÜRZUNGEN
ABRÉVIATIONS ET SIGNES EMPLOYÉS
Nichts
Unbedeutend (im allgemeinen weniger als die Hälfte der kleinsten in der betreffenden Reihe verwendeten Ein heit oder Dezimale)
Kein Nachweis vorhanden
Unsichere oder geschätzte Angabe
Schätzung des Statistischen Amtes der Europäischen Gemeinschaften
Geheim
Änderung des Inhalts einer Reihe
Angaben für das Landwirtschaftsjahr, das im angege benen Kalenderjahr endet
Erzeugung
Lieferungen
Montage
Materialverbrauch
Gramm
Metrische Tonne
Liter
Stück
Meter
Quadratmeter
Kubikmeter
Paar
Kilowatt
Terawattstunde = 10» kWh
Kalorie
Terakalorie = 10" kcal
Oberer Heizwert
Unterer Heizwert
Steinkohleneinheit (7000 cal Hu/g)
Pferdestärke
KilovoltAmpere
Bruttoregistertonne
Million
Milliarde
Jahrestonne
Mit .davon" werden alle Fälle gekennzeichnet, in denen
()
[ ]
Ρ L M C g t
ι
P/St
m
m2
m3
Pa
kW
TWh
cal
Teal
Ho/PCS
Hu/PCI
SKE/tec
CV
kVA TB BRT Mio
Mrd
jato t/an
davon
Néant
Donnée très faible (généralement inférieure à la moitié de la dernière unité ou décimale des nombres mention nés sous rubrique)
Donnée non disponible
Donnée incertaine ou estimée
Estimation par l'Office statistique des Communautés européennes
Secret
Changement de portée d'une série
Campagne de 12 mois finissant au cours de l'année indi quée
Production
Livraisons
Assemblage
Consommation de matières premières
Gramme
Tonne
Litre
Pièces
Mètre
Mètre carré
Mètre cube
Paire
Kilowatt
Terawattheure = 1 0 ' kWh
Calorie
Teracalorie = 109 kcal
Pouvoir calorifique supérieur
Pouvoir calorifique inférieur
Tonne équivalent charbon (7000 cal PCI/g)
Chevalvapeur
Kilovoltampère
Tonneau de jauge brut
Million
Milliard
Tonne/an
ABBREVIAZIONI E SIMBOLI IMPIEGATI
TEKENS EN AFKORTINGEN
Nulla
Dato bassissimo (generalmente inferiore alla metà del l'ultima unità o decimale delle cifre che appaiono nella colonna)
Dato non disponibile
Dato incerto o valutato
Valutazione fatta dall'Istituto statistico delle Comunità europee
Segreto
Variazione del contenuto della serie
Campagna di 12 mesi terminante nell'anno indicato
Produzione
Consegne
Montaggio
Consumo di materie prime
Grammo
Tonnellata
Litro
Pezzi
Metro
Metro quadrato
Metro cubo
Paia
Kilowatt
Terawattora = 10* kWh
Caloria
Teracaloria = 10'kcal
Potere calorifico superiore
Potere calorifico inferiore
Tonnellata equivalente di carbon fossile (7000 cai PCI/g)
Cavallo vapore
Kilovoltampère
Tonnellate di stazza lorda
Milione
Miliardo
Tonnellate/anno
La parola «dont», dopo le cifre che si riferiscono ad un gruppo di articoli, indica la presenza di alcune suddi visioni particolari, mentre il termine « soit » significa che tutte le suddivisioni del gruppo generale sono pre senti.
Nul
Zeer kleine hoeveelheid (in het algemeen minder dan de helft van de kleinste in de betreffende reeks gebruikte eenheid of decimaal)
O
[ ]X
II
•
Ρ
L
M
C
g
t
ι
P/St
m
m2
m3
Pa
kW
TWh
cal
Teal
Ho/PCS
Hu/PCI
SKE/tec
CV
kVA
TB BRT
Mio
Mrd
jato t/an
davon soit (ossia) (daarvan)
darunter dont (di cui)
Geen gegevens beschikbaar
Onzekere of geschatte gegevens
Schatting van het Bureau voor de Statistiek der Europese Gemeenschappen
Geheim
Wijziging in de inhoud van een reeks
Boekjaar (landbouw, oogstjaar) dat in het aangegeven kalenderjaar eindigt
Produktie
Afzet
Assemblage
Verbruik van grondstoffen
Gram
Metrische tonnen
Liter
Stuks
Meter
Vierkante meter
Kubieke meter
Paar
Kilowatt
Terawattuur = 1 0 ' kWh
Calorie
Teracalorie = 109 kcal
Calorische bovenwaarde
Calorische onderwaarde
Steenkoleneenheden (7000 cal onderwaarde/g)
Paardekracht
Kilovoltampère
l Brutoregisterton
I
Miljoen
Miljard
l Ton/jaar
Erster Teil
Première partie
Indizes der industriellen Produktion
in den Mitgliedstaaten der Gemeinschaft
und in einigen dritten Ländern
Indices de la production industrielle
dans les pays de la Communauté
et certains pays tiers
Prima parte
Eerste deel
Indici della produzione industriale
nei paesi della Comunità
e in alcuni paesi terzi
Indices van de industriële produktie
in de landen van de Gemeenschap
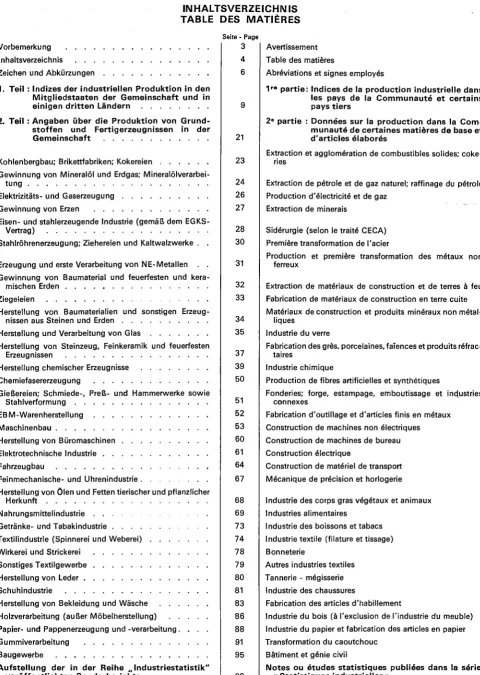
Index der industriellen Produktion Indici della produzione industriale
1963=100
Indices de la production industrielle Indexcijfers van de industriële produktie
300 —
280 —
^ Nah
ndu
V
¿ft
une stritJ
su ali
/
'
ndG tien
' \
\S
enu ari e
ßmi tab
/ telir ace
y /
:<·.
dus
li
Λ
■ > . *
trie
^
t*4
>'
Industries alimentaires et tabac
vOedings en genotmiddelenindustrie
_ •
7^.
%
Λ
v
V
y
ν
φ. Λ
r
\ \ ....
.·
Industries textiles
Textielindustrie 300 280 260 240 220
200
180 160 140 120
■
Che mische Industrie Industrie chimiche
Ρ ■ ■
'.*
' ■ _>
.... _ « *,·.
I
^_ ...
ndLstries chimiques Chemische industrie
...
VJ·
■
•·#.<
2 3 4 2 3 4 1969
2 3 4 1 1970
2 3 4 1971
Gesamte Industrie
(ohne Baugewerbe)
Insieme dell'industria
(senza edilizia)
Ensemble de l'industrie
(à l'exclusion du bâtiment)
Gehele industrie
(excl. bouwnijverheid)
1963»* 100
Land
Pays 1965 1966 1967 1968 1969 1970 1971 1972
1971
III IV
1972
IV
Paese Land
ohne Nahrungs und Genußmittelindustrie senza alimentari, bevande e tabacchi Deutschland (BR)
Allemagne R. F.
Frankreich France Italien Italie Niederlande PaysBas Belgien Belgique Luxemburg Luxembourg EWG CEE 115 110 105 117 110 110 112 117 118 118 125 111 106 117 113 121 129 130 113 105 119 129 126 138 147 120 112 130 146 142 142 165 132 127 145 156 150 151 182 135 128 154 158 159 146 195 138 126 158 164 171 151 148 131 147 135 129 176 127 124 142 162 174 154 208 143 124 166 159 175 152 218 146 124 165 169 176 157 211 157 137 171 152 145 132 189 132 129 148 177 187 161 159 135
sans aliments, boissons et tabac excl. voedings en genotmiddelenindustrie
Germania R. F. Duitsland Β R
Francia Frankrijk
Italia Italie
Paesi Bassi Nederland Belgio België Lussemburgo Luxemburg CEE EEG
einschl. Nahrungs und Genußmittelindustrie compresi alimentari, bevande e tabacchi
y compris aliments, boissons et tabac incl. voedings en genotmiddelenindustrie
EWG CEE Österreich Autriche Griechenland Grèce Irland Irlande Norwegen Norvège
Portugal ■) ") Portugal ·) ")
Ver. Königreich RoyaumeUni
Schweden Suède
Kanada Canada
Ver. Staaten ÉtatsUnis Japan Japon UdSSR U.R.S.S. 111 112 121 112 116 119 111 119 119 117 120 116 117 117 140 118 121 127 113 124 128 128 136 126 119 118 146 127 126 134 113 127 131 131 162 139 129 126 158 142 132 148 120 132 140 138 190 150 143 141 177 153 139 163 124 141 148 145 222 160 152 153 195 157 145 180 125 151 152 140 258 174 156 163 217 164 150 127 151 159 139 270 188 174 156 130 149 200 141 155 232 162 135 141 118 123 156 139 273 178 165 172 223 171 159 139 130 162 165 141 280 194 162 160 224 156 158 126 157 165 143 282 202 169 175 244 173 159 132 170 171 150 289 204 147 164 254 171 140 121 127 161 150 300 190 197 166 140 155 204 CEE EEG Austria Oostenrijk Grecia Griekenland Irlanda Ierland Norvegia Noorwegen
Portogallo *) b)
Portugal ■) b)
Regno Unito Ver. Koninkrijk
Svezia Zweden
Canada Canada
Stati Uniti Ver. Staten
Giappone Japan
U.R.S.S. U.S.S.R.
* ) Den Jahresindizes liegen andere Basisreihen zugrunde als den Viertel jahresindizes.
Bergbau
Industrie estrattive
Industries extractives
Mijnbouw
1963^100
Land Pays
Deutschland (BR) Allemagne RF
Frankreich France
Italien Italie
Niederlande PaysBas
Belgien Belgique
Luxemburg Luxembourg
EWG CEE
Österreich Autriche
Griechenland Grèce
Irland Irlande
Norwegen Norvège
Portugal ■) Portugal ")
Ver. Königreich RoyaumeUni
Schweden Suède
Kanada Canada
Ver. Staaten ÉtatsUnis
Japan Japon
1965
101
109
98
108
96
91
103
91
116
105
115
101
96
118
119
106
100 1966
99
110
104
108
86
91
102
89
123
146
120
102
90
119
123
111
105 1967
94
108
111
115
82
86
100
81
126
176
139
112
89
123
127
112
104 1968
99
106
122
146
76
86
104
78
137
217
147
116
85
132
136
117
105 1969
102
110
126
182
69
89
109
80
158
238
164
109
80
138
137
120
104 1970
107
110
129
228
62
83
113
80
188
237
174
108
78
138
159
120
100 1971
108
106
121
289
61
69
113
82
214
254
189
80
146
167
120
93 1972
106
106
123
58
70
83
215
72
1971
III
108
94
118
232
54
74
107
81
234
274
182
88
78
117
168
119
91 IV
110
109
125
348
63
64
118
86
204
217
206
99
76
151
172
115
92
1972
I
96
109
118
399
61
59
113
81
197
205
201
47
139
173
119
89 II
110
112
130
328
64
77
119
80
228
273
229
81
164
173
123
84 III
105
94
118
285
48
71
107
82
233
341
208
75
115
163
122
83 IV
115
107
127
59
75
87
221
84 Paese
Land
Germania R.F. Duitsland BR
Francia Frankrijk
Italia Italië
Paesi Bassi Nederland
Belgio België
Lussemburgo Luxemburg
CEE EEG
Austria Oostenrijk
Grecia Griekenland
Irlanda Ierland
Norvegia Noorwegen
Portogallo *) Portugal ")
Regno Unito Ver. Koninkrijk
Svezia Zweden
Canada Canada
Stati Uniti Ver. Staten
Giappone Japan
a) Den Jahresindizes liegen andere Basisreihen zugrunde als den Viertel jahresindizes.
Verarbeitende Industrie
Industrie manifatturiere
Industries manufacturières
Verwerkende industrie1963 -> 100
Land
Pays 1965 1966 1967 1968 1969 1970 1971 1972
1971
IV
1972
IV
Paese Land
ohne Nahrungs- und Genußmittelindustrie senza alimentari, bevande e tabacchi Deutschland (BR)
Allemagne R. F.
Frankreich France
Italien Italie
Niederlande Pays-Bas
Belgien Belgique
Luxemburg Luxembourg
EWG CEE
116
109
104
117
111
111
112 118
118
118
124
114
108
118 115
121
130
128
116
107
120 131
127
139
142
125
115
131 150
144
142
157
140
131
147 160
153
151
172
141
132
156 161
163
146
177
148
130
159 167
175
150
159
137 150
139
127
167
136
128
144 164
178
152
182
153
128
166 160
178
150
183
157
129
165 174
181
158
193
167
142
174 155
148
130
175
140
134
150 180
192
159
171
141
sans aliments, boissons et tabac excl. voedings- en genotmiddelenindustrie
Germania R. F. Duitsland BR
Francia Frankrijk
Italia Italië
Paesi Bassi Nederland
Belgio België
Lussemburgo Luxemburg
CEE EEG
einschl. Nahrungs- und Genußmittelindustrie
compresi alimentari, bevande e tabacchi incl. voedings- en genotmiddelenindustrie y compris aliments, boissons et tabac
EWG CEE
Österreich Autriche
Griechenland Grèce
Irland Irlande
Norwegen Norvège
Portugal ·) Portugal ·)
Ver. Königreich Royaume-Uni
Schweden Suède
Kanada Canada
Ver. Staaten États-Unis
Japan Japon
112
112
120
113
115
119
112
119
120
118
121 118
117
137
116
121
127
114
124
128
130
137 120
118
141
125
126
134
114
128
131
132
164 130
126
151
138
129
148
121
132
140
139
193 145
142
168
148
137
164
126
141
149
146
227 154
154
186
152
143
182
127
151
149
139
264 157
165
204
159
147
127
151
155
138
277 151
130 143
157
221
156
133
139
119
124
154
137
279 166
177
209
168
156
135
130
162
161
140
287 161
163
207
153
152
126
157
157
143
289 171
179
232
168
155
133
170
168
150
297 149
167
244
162
136
123
127
160
149
307 162
139 CEE
EEG
Austria Oostenrijk
Grecia Griekenland
Irlanda Ierland
Norvegia Noorwegen
Portogallo ") Portugal *)
Regno Unito Ver. Koninkrijk
Svezia Zweden
Canada Canada
Stati Uniti Ver. Staten
Giappone Japan
a) Den Jahresindizes liegen andere Basisreihen zugrunde als den Viertel
Chemische Industrie
Industria chimica
Industrie chimique
Chemische industrie
1963-> 100
Land Pays
Deutschland (BR) Allemagne R.F.
Frankreich France
Italien Italie
Niederlande *) Pays-Bas ")
Belgien Belgique
Luxemburg e)
Luxembourg e)
EWG CEE
Österreich Autriche
Griechenland Grèce
Irland d)
Irlande d)
Norwegen Norvège
Portugal ") d)
Portugal ") d)
Ver. Königreich Royaume-Uni
Schweden d)
Suède d)
Kanada d)
Canada d)
Ver. Staaten b)
États-Unis")
Japan c)
Japon c)
1965
121
121
141
113
119
124
123
122
115
117
128
118
117
124 1966
132
131
161
114
•
128
148
144
135
118
123
142
128
130
140 1967
143
142
176
119
134
214
161
138
126
130
160
133
137
164 1968
162
154
199
137
149
243
191
139
139
140
174
142
149
190 1969
184
179
195
165
167
278
202
147
153
149
197
153
161
223 1970
194
194
207
169
191
307
213
150
175
158
210
160
164
253 1971
202
208
209
178
212
344
212
154
161
209
166
270 1972
218
221
223
195
232
160
169
1972
III
196
196
189
167
203
337
200
153
124
153
179
162
274 IV
206
220
218
180
215
375
214
144
109
161
219
171
270
1971
I
211
223
231
182
220
373
223
159
163
209
172
276 II
223
218
230
202
237
403
230
163
179
238
177
285 III
212
208
191
187
219
405
204
154
164
191
171
286 IV
227
237
240
210
251
162
171
Paese Land
Germania R.F. Duitsland BR
Francia Frankrijk
Italia Italië
Paesi Bassi *) Nederland *)
Belgio België
Lussemburgo e)
Luxemburg *)
CEE EEG
Austria Oostenrijk
Grecia Griekenland
Irlanda d)
Ierland d)
Norvegia Noorwegen
Portogallo ") d)
Portugal b) d)
Regno Unito Ver. Koninkrijk
Svezia d)
Zweden d)
Canada d)
Canada d)
Stati Uniti b)
Ver. Staten ")
Giappone0)
Japan c)
a) Veröffentlichung unterbrochen für die chemische Industrie im engeren Sinne.
b) Den Jahresindizes liegen andere Basisreihen zugrunde als den Viertel-jahresindizes.
c) Ab 1968 sind die Vierteljahresangaben saisonbereinigte Indizes. d) Einschl. Erdöl- und Steinkohlenderivate.
e) In Überarbeitung befindliche Reihe.
a) Publication interrompue pour la chimie proprement dite. b) Les indices annuels et trimestriels ont une portée différente.
c) A partir de 1968, les indicateurs trimestriels sont des indices désaison-nalisés.
Metallverarbeitende Industrie
Industrie meccaniche
Industrie transformatrice des métaux
Metaalverwerkende industrie
1963-»100
Land Pays
Deutschland (BR) Allemagne R.F.
Frankreich France
Italien Italie
Niederlande Pays-Bas
Belgien Belgique
Luxemburg Luxembourg
EWG CEE
Österreich Autriche
Griechenland Grèce
Irland Irlande
Norwegen Norvège
Portugal") Portugal·)
Ver. Königreich Royaume-Uni
Schweden Suède
Kanada Canada
Ver. Staaten États-Unis
Japan Japon
1965
115
109
95
115
110
94
111
112
120
118
115
109
113
121
130
121
124 1966
114
118
113
120
113
93
115
114
125
120
122
123
116
130
145
137
144 1967
105
122
126
123
114
87
114
117
125
124
127
131
116
131
153
136
185 1968
119
127
131
132
116
81
123
125
130
139
129
146
122
135
165
141
235 1969
142
146
132
147
136
94
142
147
143
152
134
176
127
146
179
146
287 1970
155
160
151
162
145
100
156
165
164
153
144
181
129
161
171
136
350 1971
154
173
141
168
143
123
158
178
183
146
151
128
166
179
375 1972
156
137
144
130
158
129
1971
III
139
147
119
158
130
112
139
162
184
134
131
185
117
127
170
383 IV
154
198
148
174
146
130
166
198
184
158
167
174
132
184
186
392
1972
I
151
183
141
167
146
132
160
177
197
157
165
127
173
188
398 II
164
193
148
180
151
134
170
197
207
163
159
131
189
198
415 III
138
164
116
160
127
116
143
178
211
151
137
118
130
175
439 IV
170
143
156
137
170
139 Paese
Land
Germania R. F. Duitsland BR
Francia Frankrijk
Italia Italië
Paesi Bassi Nederland
Belgio België
Lussemburgo Luxemburg
CEE EEG
Austria Oostenrijk
Grecia Griekenland
Irlanda Ierland
Norvegia Noorwegen
Portogallo*) Portugal *)
Regno Unito Ver. Koninkrijk
Svezia Zweden
Canadá Canada
Stati Uniti Ver. Staten
Giappone Japan
Den Jahresindizes liegen andere Basisreihen zugrunde als den Viertel
Nahrungs und Genußmittelindustrie
Industries des denrées alimentaires, des boissons et du tabac
Industrie alimentari, delle bevande e del tabacco
Voedings en genotmiddelenindustrie
1963>100
Land Pays
Deutschland (BR) Allemagne R.F.
Frankreich France
Italien Italie
Niederlande PaysBas
Belgien Belgique
Luxemburg Luxembourg
EWG CEE
Österreich Autriche
Griechenland Grèce
Irland Irlande
Norwegen Norvège
Portugal ") Portugal')
Ver. Königreich RoyaumeUni
Schweden Suède
Kanada Canada
Ver. Staaten ÉtatsUnis
Japan Japon
1965
110
109
105
109
107
112
109
104
112
107
105
115
105
107
110
106
116 1966
113
113
108
111
112
117
112
116
127
111
114
120
109
113
115
110
126 1967
116
118
113
119
119
116
116
118
122
119
111
128
111
116
123
113
133 1968
122
124
118
123
121
120
122
120
128
126
109
135
116
121
125
116
141 1969
128
127
127
130
127
120
128
128
126
130
113
141
119
125
129
119
149 1970
132
132
136
137
135
124
133
133
134
135
114
151
122
130
134
122
161 1971
139
137
137
148
139
131
139
137
145
142
115
123
133
138
166 1972
140
140
144
136
148
119
127
1971
III
134
130
129
140
140
139
133
131
212
151
109
143
124
125
151
154 IV
152
137
137
179
157
118
147
168
112
155
121
121
128
141
139
170
1972
I
131
142
135
134
130
125
135
120
106
121
110
120
128
124
189 II
143
154
150
143
134
146
147
135
160
149
130
127
142
147
168 III
134
140
129
144
144
147
136
133
197
155
112
128
127
154
127
156 IV
153
146
166
126
202
125
134 Paese
Land
Germania R.F. Duitsland BR
Francia Frankrijk
Italia Italië
Paesi Bassi Nederland
Belgio België
Lussemburgo Luxemburg
CEE EEG
Austria Oostenrijk
Grecia Griekenland
Irlanda Ierland
Norvegia Noorwegen
Portogallo ■) Portugal")
Regno Unito Ver. Koninkrijk
Svezia Zweden
Canada Canada
Stati Uniti Ver. Staten
Giappone Japan
a) Den Jahresindizes liegen andere Basisreihen zugrunde als den Viertel jahresindizes.
Textilindustrie
Industria tessile
Industries textiles
Textielindustrie
1963-► 100
Land Paye
Deutschland (BR) Allemagne R.F.
Frankreich France
Italien Italie
Niederlande Pays-Bas
Belgien Belgique
Luxemburg Luxembourg
EWG CEE
Österreich d)
Autriche d)
Griechenland Grèce
Irland c)
Irlande c)
Norwegen Norvège
Portugal ") c)
Portugal ·) "),;
Ver. Königreich Royaume-Uni
Schweden Suède
Kanada °) Canada c)
Ver. Staaten États-Unis
Japan '') Japon b)
1965
107
89
83
101
98
55
96
107
119
111
102
120
105
101
115
115
119 1966
107
101
95
106
103
47
103
113
130
114
104
129
102
94
120
122
131 1967
100
93
93
96
96
39
97
109
134
122
102
128
97
99
113
121
142 1968
116
95
92
108
102
26
104
117
139
140
93
141
106
97
121
129
151 1969
128
105
99
112
110
114
132
155
154
99
147
109
107
130
132
165 1970
128
102
98
115
110
113
134
176
166
106
160
107
104
125
127
182 1971
135
109
93
117
114
117
142
201
170
104
105
130
191 1972
140
118
98
116
101
107
1971
III
117
84
74
103
98
97
127
193
153
87
114
96
76
128
193 IV
144
121
98
122
124
125
149
231
179
113
120
110
136
188
1972
I
142
124
101
118
121
126
151
221
177
109
101
135
191 II
147
130
101
121
124
130
155
225
172
107
110
140
189 III
118
89
80
100
95
100
131
216
164
80
101
133
189 IV
151
129
108
127
107
117 Paese
Land
Germania R. F. Duitsland BR
Francia Frankrijk
Italia Italië
Paesi Bassi Nederland
Belgio België
Lussemburgo Luxemburg
CEE EEG
Austria d)
Oostenrijk d)
Grecia Griekenland
Irlanda c)
Ierland °)
Norvegia Noorwegen
Portogallo ")c)
Portugal ' )c)
Regno Unito Ver. Koninkrijk
Svezia Zweden
Canada c)
Canada c)
Stati Uniti Ver. Staten
Giappone *) Japan ")
j 1
a) Den Jahresindizes liegen andere Basisreihen zugrunde als den Viertel jahresindizes.
b) Ab 1968 sind die Vierteljahresangaben saisonbereinigte Indizes, cj Einschl. Bekleidung und Schuhe.
d) Einschl. Bekleidung.
a) Les indices annuels et trimestriels ont une portée différente.
b) A partir de 1968. les indicateurs trimestriels sont des indices désaison-nalisés.
Lederindustrie
Industria del cuoio
Industrie du cuir
Lederindustrie
1963»100
Land Pays
Deutschland (BR) Allemagne R. F.
Frankreich France
Italien Italie
Niederlande PaysBas
Belgien Belgique
Luxemburg Luxembourg
EWG CEE
Österreich Autriche
Griechenland Grèce
Irland Irlande
Norwegen Norvège
Portugal Portugal
Ver. Königreich RoyaumeUni
Schweden Suède
Kanada b) Canada b)
Ver. Staaten") ÉtatsUnis b)
Japan c) Japon c)
1965
104
89
90
103
97
a
)
96
91
95
101
133
104
107
108
107 1966
98
97
103
102
105
')
99
90
106
100
132
102
109
112
111 1967
88
88
104
94
103
■)
92
80
103
100
112
90
104
107
113 1968
101
94
113
102
114
*)
102
91
98
101
97
93
112
138 1969
104
98
132
101
124
*)
109
99
101
106
100
94
102
150 1970
102
85
122
104
107
")
100
98
105
106
106
93
97
157 1971
102
94
119
104
112
·)
103
98
114
108
105
93
159 1972
100
93
127
111
·)
108
106
93
•
1971
III
93
73
102
94
100
°)
89
99
104
98
104
82
158 IV
111
106
133
105
127
a
)
114
99
118
113
119
104
171
1972
I
100
100
127
107
118
')
106
111
122
119
98
91
175 II
103
102
133
105
127
*)
109
114
101
101
96
91
176 III
92
67
105
80
82
·)
86
96
89
94
107
87
173 IV
106
102
141
115
")
111
123
102 Paese
Land
Germania R.F. Duitsland BR
Francia Frankrijk
Italia Italië
Paesi Bassi Nederland
Belgio België
Lussemburgo Luxemburg
CEE EEG
Austria Oostenrijk
Grecia Griekenland
Irlanda Ierland
Norvegia Noorwegen
Portogallo Portugal
Regno Unito Ver. Koninkrijk
Svezia Zweden
Canada b) Canada ")
Stati Uniti b) Ver. Staten ")
Giappone0) Japan c)
a) Produktion unterbrochen. b) Einschl. Schuhherstellung.
c) Ab 1968 sind die Vierteljahresangaben saisonbereinigte Indizes.
a) Production interrompue.
b) Y compris la fabrication de chaussures.
Papierindustrie
Industria della carta
Industrie du papier
Papierindustrie
1963^100
Land Pays
Deutschland (BR) Allemagne R.F.
Frankreich France
Italien Italie
Niederlande PaysBas
Belgien Belgique
Luxemburg Luxembourg
EWG CEE
Österreich Autriche
Griechenland Grèce
Irland Irlande
Norwegen Norvège
Portugal Portugal
Ver. Königreich ■) RoyaumeUni")
Schweden Suède
Kanada Canada
Ver. Staaten ÉtatsUnis
Japan ") Japon b)
1965
113
107
116
120
116
112
116
119
118
124
113
121
114
116 1966
117
116
135
129
123
121
119
144
106
121
115
132
122
130 1967
117
120
151
133
128
125
123
154
132
125
114
133
123
145 1968
132
122
158
145
145
134
136
163
144
136
120
131
159 1969
145
130
179
160
159
147
150
189
161
148
126
140
179 1970
150
136
181
164
168
152
163
209
159
153
122
138
204 1971
152
138
171
162
167
152
174
206
169
145
119
208 1972
160
149
187
177
188
144
125
1971
III
145
111
153
154
152
137
172
187
167
136
115
206 IV
159
151
187
162
177
161
179
204
177
153
122
212
1972
I
157
155
191
168
181
163
182
230
175
146
124
214 II
163
157
201
174
184
169
188
209
193
139
128
216 III
151
123
154
158
159
144
184
225
187
136
119
224 IV
167
163
200
183
199
153
128
Paese Land
Germania R. F. Duitsland BR
Francia Frankrijk
Italia Italië
Paesi Bassi Nederland
Belgio België
Lussemburgo Luxemburg
CEE EEG
Austria Oostenrijk
Grecia Griekenland
Irlanda Ierland
Norvegia Noorwegen
Portogallo Portugal
Regno Unito') Ver. Koninkrijk ")
Svezia Zweden
Canada Canada
Stati Uniti Ver. Staten
Giappone0 Japan b)
a) Einschl. Druckerei und Verlagswesen.
b) Ab 1968 sind die Vierteljahresangaben saisonbereinigte Indizes.
a) Y compris imprimerie et édition.
Produktionsindex des Baugewerbes
:')
Indice di produzione dell'industria edilizia e del
genio civile
8)
Indice de la production de l'industrie du bâtiment
et du génie civil ")
Produktie-index van de bouwnijverheid '')
1963 -► 100
Land Pays
Deutschland (BR) Allemagne R.F.
Frankreich France
Italien Italie
Niederlande Pays-Bas
Belgien Belgique
Luxemburg Luxembourg
EWG CEE
1965
116
121
97
133
122
138
114 1966
121
126
98
143
126
138
118 1967
112
130
106
161
129
139
119 1968
118
130
115
176
125
123
125 1969
123
135
126
168
125
129
130 1970
135
140
123
173
138
138
136 1971
138
137
114
180
134
[135] 1972
153
139
1971
IM
159
133 IV
141
142
1972
I
111
139
,
II
160
147 III
159
129 IV
146
140 Paese
Land
Germania R. F. Duitsland BR
Francia Frankrijk
Italia Italië
Paesi Bassi Nederland
Belgio België
Lussemburgo Luxemburg
CEE EEG
a) Kalendermonatlich. a) Indice non corrigé de l'inégalité du nombre de jours ouvrables.
..·'
s
•¿v
'
\
\
3 4 1967
***
i
· · ■ ■
—ι * *
...·
X
·'·.
^ V
1 2 3 4
1968
u / ·
m ^
• ·
·• ·
• ·
<
f
í
^ C
\ \
1 2 3 4
1969
• ·
T
SiV "
.A
» ·
1 2 3 4
1970
V
4
\
7
V
*
v*
1 2 3 4
1971
/ \
\A
r
U
V
,
" V
\
* * v
1 2
Zweiter Teil
Angaben über die Produktion von
Grundstoffen und Fertigerzeugnissen
in der Gemeinschaft
Seconda parte
Dati sulla produzione
nella Comunità di alcune materie
prime ed articoli elaborati
Deuxième partie
Données sur la production dans la
Communauté de certaines matières
de base et articles élaborés
Tweede deel
Produktiecijfers van enige
basisgrondstoffen en bewerkte
Kohlenbergbau; Brikettfabriken;
Kokereien
Estrazione e agglomerazione di
combustibili solidi; Cokerie
11/12
Extraction et agglomération
de combustibles solides; Cokeries
Winning en bewerking van vaste
brandstoffen; Cokesovenbedrijven
ERZEUGNIS . PRODUIT PRODOTTO . PRODUKT
Steinkohle Houille Carbon fossile Steenkolen Houille Steinkohlenbriketts
Agglomérés de houille . . . Agglomerati di carbon fossile . Steenkoolbriketten
Agglomérés de houille . . .
Lignite Lignite
Braunkohlenbriketts und Schwelkoks, Staub und Trockenkohle
Bruinkoolbriketten
Steinkohlenkoks und Schwel koks
Coke de four et semicoke de houille
Coke da cokeria Cokesovencokes Coke de four
LAND PAYS/PAESE
DEUTSCHLAND (BR) FRANCE
ITALIA NEDERLAND BELGIQUE/BELGIË LUXEMBOURG
EWG · CEE
DEUTSCHLAND (BR) FRANCE ITALIA NEDERLAND BELGIQUE/BELGIË LUXEMBOURG
EWG · CEE
DEUTSCHLAND (BR)
FRANCE ITALIA NEDERLAND BELGIQUE/BELGIË LUXEMBOURG
EWG · CEE
DEUTSCHLAND (BR) FRANCE
ITALIA NEDERLAND BELGIQUE/BELGIË LUXEMBOURG
EWG · CEE
DEUTSCHLAND (BR)
FRANCE ITALIA NEDERLAND BELGIQUE/BELGIË LUXEMBOURG
EWG · CEE
m2, m3, t h i . . .
Mio t Mio t Mio t Mio t Mio t
Mio t
Mio t Mio t Mio t Mio t Mio t
Mio t
M i o í <S K E [t tac »
»
M¡o{¡feKcE
Mio t Mio tMio t
Mio t
Mio t Mio t Mio t Mio t
Gewinnung von Mineralöl und Erdgas;
Mineralölverarbeitung
Estrazione di petrolio e di gas naturale;
Industria petrolifera
1 3 / 1 4
Extraction de pétrole et de gaz naturel;
Raffinage de pétrole
Aardolie en aardgaswinning;
Aardolieindustrie
ERZEUGNIS . PRODUIT PRODOTTO . PRODUKT
Erdöl, roh Pétrole brut Petrolio greggio Ruwe aardolie
Erdund Grubengas
Gaz naturel, y compris grisou . Gas naturale ( m e t a n o ) . . . . Aard en mijngas
Gaz naturel, y compris grisou .
Flüssiggas *) Gaz liquéfiés ") Gas liquefatti *) Vloeibaar gas ■) Gaz liquéfiés *)
Motorbenzin ■) ï
Essence moteur ") I Benzina auto *)
Autobenzine ") Essence moteur ")
Flugkraftstoffe *) . . . Carburants d'aviation *) Carburanti avio * ) . . . Vliegtuigbrandstoffen ") Carburants d'aviation *)
Petroleum ") Pétrole lampant *)
Petrolio illuminante " ) . . . . Petroleum ")
Pétrole lampant *)
LAND PAYS/PAESE
DEUTSCHLAND (BR) FRANCE
ITALIA NEDERLAND BELGIQUE/BELGIË LUXEMBOURG
EWG · CEE
DEUTSCHLAND (BR) FRANCE
ITALIA NEDERLAND BELGIQUE/BELGIË LUXEMBOURG
EWG · CEE
DEUTSCHLAND (BR) FRANCE
ITALIA NEDERLAND BELGIQUE/BELGIË LUXEMBOURG
EWG ■ CEE
DEUTSCHLAND (BR) FRANCE
ITALIA NEDERLAND BELGIQUE/BELGIË LUXEMBOURG
EWG · CEE
DEUTSCHLAND (BR) FRANCE
ITALIA NEDERLAND BELGIQUE/BELGIË LUXEMBOURG
EWG · CEE
DEUTSCHLAND (BR) FRANCE
ITALIA NEDERLAND BELGIQUE/BELGIË LUXEMBOURG
EWG ■ CEE
m2, m3, t, n i . . .
Mio t Mio t Mio t Mio t
Mio t
103 Tea I (Ho/PCS) 103 Teal (Ho/PCS) 1000 t 1000 t 1000 t 1000 t 1000 t 1000 t 1000 t 1000 t 1000 t 1000 t 1000 t 1000 t 1000 t 1000 t 1000 t 1000 t 1000 t 1000 t 1000 t 1000 t 1000 t 1000 t 1000 t 1000 t Ρ L
c
Ρ Ρ Ρ Ρ Ρ Ρ Ρ Ρ Ρ Ρ Ρ Ρ Ρ Ρ Ρ Ρ Ρ Ρ Ρ Ρ Ρ Ρ Ρ Ρ Ρ Ρ Ρ Ρ Ρ Ρ Ρ Ρ Ρ Ρ Ρ 1970 7,5 2,3 1,4 1,9 13,2 109,7 64,6 120,2 266,4 0,4 561,32 406 2 307 2 064 704 382
7 863
14 502 13 208 12 949 4 615 3 577
48 851
1 449 2 955 1 638 2 276 1 065
9 383
50 48 4 348 1 200 132
5 778 1971 7,4 1,9 1,3 1,7 12,3 132,0 67,4 122,5 368,2 0,4 690,5
2 442 2 339 2 011 785 367
7 944
14 884 13 577 13 047 4 833 3 761
50 102
1 494 2 802 1 991 2 419 1 131
9 837
9 0 44 4 141 1 238 58
5 391
1971 III 1,9 0,5 0,3 0,4 3,1 26,5 15,6 27,3 71,8 0,1 141 576 509 531 174 80
1 870
3 731 3 549 3 533 1 190 952
12 955
432 735 640 768 350
2 925
3 1 10 841 133 2 5
928 IV 1,8 0,4 0,3 0,4 2,9 37,0 17,9 35,3 116,7 0,1 207 658 653 498 223 111
2 143
3 921 3 500 3 595 1 313 934
13 263
327 731 570 508 211
2 347
6 16 1 263 485 26
1 784
1972 Ι 1,8 0,4 0,3 0,4 2,9 41,4 18,2 35,0 137,6 0,1 232 672 714 498 241 113
2 238
3 701 3 647 2 834 1 310 983
12 475
286 695 339 664 268
2 252
3 24 1 104 410 48
1 589 II 1,8 0,4 0,3 0,4 2,9 32,5 16,1 29,0 107,8 0,1 185 662 547 547 211 114
2 081
3 688 3 803 3 386 1 241 1 146
13 264
323 747 547 995 311
2 923
4 26 859 239 31
1 159 III 1,8 0,4 0,3 0,4 2,8 29,7 18,8 28,1 95,1 0,1 172 626 553 535 157 84
1 955
4 028 4 021 3 811 1 397 1 237
14 494
411 864 676 942 359
3 252
2 6 897 142 34
1 081