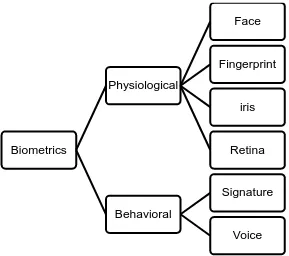
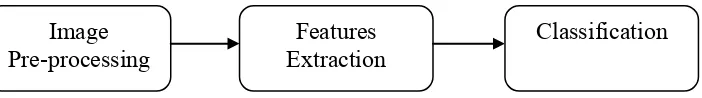
Comparative study between feature extraction methods for face recognition
Full text
Figure

Related documents
Quality: We measure quality (Q in our formal model) by observing the average number of citations received by a scientist for all the papers he or she published in a given
recommendations about improvement of the legislation regarding assignment of punishment for preparation follows that this punishment always does not have to be
With 85 corporations in Hong Kong stock market as research sample, they empirically analyzed the correlation between proportion of independent directors and level
The small premature infant who has undergone a sur gical procedure and would have to be fed by gavage is much more easily and safely fed through a gastrostomy tube (Fig. 2)..
Have academic administrators and legal counsel investigated whether any outside recruiters, vendors, or student ambassadors are making statements regarding accreditation of
Table depicts Cumulative Abnormal Returns (CAR) for alternative asset pricing models (APMs) over 12, 36 and 60 month horizons. A firm’s monthly abnormal return conditioned by an APM
Improper use of a work tool resulting in sweeping, prying, twisting and/or catching of heavy loads will reduce the life of the boom and stick.. *This bucket might reduce boom
We therefore de- scribed the types and rates of early complications in cementless RTSA during the learning period, character- ized a learning curve for our RTSA series to
