Essays on intangible capital and economic development
Shenglang Yang
A thesis submitted to for the degree of Doctor of Philosophy of
The Australian National University.
Canberra, March 2018.
Declaration
I certify that the thesis I have presented for examination for the PhD degree of The
Australian National University is solely my own work other than where I have clearly
indicated that it is the work of others (in which case the extent of any work carried out
jointly by me and any other person is clearly identified in it).
The copyright of this thesis rests with the author. Quotation from it is permitted, provided
that full acknowledgement is made. This thesis may not be reproduced without my prior
written consent.
I warrant that this authorisation does not, to the best of my belief, infringe the rights of
any third party.
I declare that my thesis consists of approximately 48,000 words.
Statement of conjoint work
I certify that
Chapter 1 was co-authored with Yixiao Zhou, and I contributed 80% of the work;
Chapter 2 was co-authored with Yixiao Zhou and Ligang Song, and I contributed 70% of
the work;
Chapter 4 was co-authored with Xunpeng Shi, and I contributed 80% of the work;
Acknowledgement
I am in debt to a number of people for their insights, support and encouragement while
completing my PhD program. Most importantly, I wish to thank Professor Ligang Song,
Professor Kaliappa Kalirajan, Dr Creina Day and Dr Ying Xu for their invaluable advice
and trust.
I would like to thank my co-authors Dr Yixiao Zhou and Dr Xunpeng Shi for their
contributions to my thesis as well as my colleagues and peers at Crawford School and
beyond for their helpful comments and fruitful discussions. I would also like to thank
Karin Hosking for copyediting the thesis.
Finally, I would like to thank Rio-Tinto very much for funding my PhD study through the
Abstract
This thesis consists of six chapters that examine issues on intangible capital and economic
development. Chapter 1 assesses the role of intangible capital in sectoral economic
growth in China based on data from Input-Output Tables, and identifies the type of
disaggregated intangible capital that has the largest effect on economic growth in each
sector group. Chapter 2 studies the determinants of intangible investment in Chinese firms
as well as the relationship between firm-level productivity and various types of intangible
investment, and finds that firm size, human capital and institutional quality as well as
market competition all play important roles in determining firms’ intangible investment.
Chapter 3 investigates the role of organization capital in the production of Chinese listed
firms, compares the contributions of organization capital to firms’ financial performance
between listed state-owned enterprises (SOEs) and non-SOEs and finds that SOEs invest
more in organization capital but have lower returns from the investment. Chapter 4
analyses the effect of intangible capital in reducing sectoral energy intensity as well as
how this effect varies across sectors and economies of different development stages,
which provides some useful policy implications. Chapter 5 compares the changing output
elasticity as well as heterogeneity in the productivity spillover effect of intangible capital
across various sectors and economy of different income level, and finds some interesting
patterns. Chapter 6, which is the last chapter, revisits the lost decades of the Japanese
economy based on an extended neoclassical growth model with intangible investment
incorporated and finds that unmeasured intangible investment actually plays an important
Table of Contents
Introduction ... 1
1. Intangible capital and China’s economic growth: Evidence from Input-Output Tables ... 8
1.1 Introduction ... 8
1.2 How do we conduct growth accounting with sectoral data?... 13
1.3 Intangible capital and TFP growth ... 18
1.4 Growth accounting incorporating intangible capital ... 26
1.5 Conclusion ... 30
1.6 Appendix A Industry classification ... 36
1.7 Appendix B Sensitivity analysis... 39
1.8 Appendix C Hausman test for Table ... 39
2. Determinants of intangible investment and its impacts on firms’ productivity: Evidence from Chinese private manufacturing firms ... 40
2.1 Introduction ... 40
2.2 Theoretical framework for analysing firms’ behaviour in intangible investment ... 44
2.3 Data and empirical strategy ... 48
2.4 Pattern of intangibles investment in China ... 56
2.5 Firm-level evidence ... 59
2.6 Conclusion and policy implications ... 69
3. Organization investment in a transitional economy: The role of ownership control type ... 77
3.1 Introduction ... 77
3.2 The role of organization capital in production: Evidence from Chinese listed companies 80 3.3 Employee turnover and efficiency of organization capital in Chinese SOEs: A simple model 85 3.4 Empirical evidence from Chinese listed firms ... 92
3.4.1 Methodology ... 92
3.4.2 Summary statistics ... 94
3.4.3 Results ... 95
3.5 Conclusions and policy implications ... 99
4. Intangible capital and sectoral energy intensity: Evidence from 40 economies between 1995–– 2007 ... 105
4.1 Introduction ... 105
4.2 Measuring sectoral energy intensity and intangible capital ... 109
4.2.1 Sectoral energy intensity ... 109
4.2.2 Intangible capital ... 111
4.3 Intangible capital and energy intensity: A theoretical analysis ... 113
4.4 Data source and empirical strategy ... 116
4.4.1 The WIOD and the Penn World Table 8.1 ... 117
4.4.2 Empirical strategy ... 117
4.4.3 Descriptive analysis ... 120
4.5 Empirical results ... 121
4.5.1 An overall picture ... 121
4.6 Conclusion and policy implications ... 131
4.7 Appendix A ... 137
4.8 Appendix B ... 138
5. Intangible capital, productivity spillover and economic growth: Cross-country evidence ... 139
5.1 Introduction ... 139
5.2 Intangible capital: definition and measurement ... 143
5.3 Empirical strategies and data sources ... 145
5.3.1 Empirical strategies ... 145
5.3.2 Data sources and summary statistics ... 148
5.4 Empirical results ... 149
5.5 Discussions and Conclusion ... 160
5.6 Appendix A ... 166
6. Unmeasured investment and the puzzling Japanese lost decades ... 167
6.1 Introduction ... 167
6.2 Predictions of the basic theory without intangible investment... 173
6.3 Evidence of decreased intangible investment ... 179
6.4 Predictions of the extended theory with intangible investment ... 181
6.5 Results with alternative model settings ... 191
6.6 Conclusion ... 193
6.7 Appendix A Data and parameters ... 194
6.8 Appendix B Varying the depreciation rate of intangible capital ... 198
6.9 Appendix C Simulation results of models with tangible capital adjustment costs ... 200
Conclusion ... 206
List of abbreviations ... 211
Introduction
‘Why are some nations rich and others poor?’, this is the big question that has bothered
economists for decades. The most obvious answer is differences in labour productivity.
In the past, we thought it was physical capital that led to the differences in labour
productivity. However, in recent decades, some nations, some industries and some firms
do not have a high amount of physical capital but they do demonstrate a high level of
labour productivity. The first thought that comes to our mind is that it might be due to
intangible capital, and the newest national account system (SNA08) as well as firm
accounting standard have already captured some parts of it. However, due to the
conservative nature of the national account and firm accounting standard, there is still a
significant amount of intangible investment that remains unmeasured. Specifically, the
firm accounting standard normally only capitalizes development costs that lead to
measurable economic value. For research costs that improve knowledge and efficiency of
firms but the economic value of which cannot be measured accurately, the firm
accounting standard directly treats them as expenses. Although the new national account
system SNA08 begins to capitalize R&D costs, other intangible capital such as
organization capital, brand equity and staff training that significantly contributes to the
value of firms has not been considered as capital. Moreover, there are still many
developing economies that have not yet adopted SNA08, which means that their national
account data excludes R&D expenditure as measured GDP. Therefore, a comprehensive
system for measuring intangible capital, and relevant measurement technique are needed.
Corrado et al. (2009) propose such a system, and they find that as much as 800 billion
There is a growing amount of literature based on or relevant to the study by Corrado et
al. (2009), which can be divided into several streams. First, the measurement of intangible
investment and its contributions to economic growth. For example, at national level,
Fukao et al. (2009), van Ark et al. (2009), Corrado and Hulten (2010), Hulten and Hao
(2012), and Chun and Nadiri (2016) have discussed the measurement of intangible
investment and its contributions to economic development in Japan, Europe, the US,
China and Korea respeciviely; at sectoral level, Corrado et al. (2014) and Chun and Nadiri
(2016) provide data on intangible capital for various sectors across certain developed
economies. Second, discussion of the role of intangible capital in firms’ valuation and
performance, such as organization capital (Atkeson and Kehoe, 2005; Eisfeldt and
Papanikolaou, 2013; Tronconi and Marzetti, 2011) and customer capital (Gourio and
Rudanko, 2014a). Third, adding intangible capital to solve some macroeconomic issues.
For instance, McGrattan and Prescott (2010) explain why the basic real business cycle
model fails to explain the fluctuations of the US economy during the 1990s and early
2000s by revealing that unmeasured intangible investment grew much more than that of
measured output and therefore measured productivity during the research period was
underestimated; Goodridge et al. (2013) argue that inconsistent movement between hours
growth and output growth in the UK after the Global Financial Crisis is because
unmeasured intangible investment led to underestimated productivity growth; Gourio and
Rudanko (2014b) demonstrates in their preliminary study that intangible investment can
Although many aspects of intangible capital have been well studied, there are still some
important questions yet to be answered. For example, although unique features in
developing economies such as underdeveloped institutions may interact with intangible
capital, the role of intangible capital in developing economies has not been well
documented due to the lack of data. Moreover, intangible capital as a production factor is
changing the production structure of various sectors across the world and thus may impact
the energy efficiency of those sectors, but relevant studies on the relationship between
intangible capital and sectoral energy intensity as well as the heterogeneity of this
relationship are rare. Furthermore, while intangible capital as a source of growth as well
as its productivity spillover has been confirmed, the heterogeneity in its output elasticity
and productivity spillover effect across sectors and economies has not received much
attention. Finally, although some new macroeconomics theories with intangible capital
incorporated have been proposed, they have rarely been tested widely. This thesis aims to
fill the above gaps in the literature on intangible capital.
The first three chapters of this thesis focus on intangible capital in China. Chapter 1
assesses the role of various intangible capital in sectoral productivity and sectoral
economic growth in China. By taking advantage of China’s Input-Output Tables, a dataset
of intangible capital for 100 sectors from 1997 to 2012 is constructed. Detailed analyses
are conducted for aggregate intangible capital as well as its disaggregated components
including computerized information, innovative property and economic competency
across four sector groups (agriculture, light industry, heavy industry as well as service).
productivity (TFP) growth over the period 1997 to 2012. At the sector level, it is revealed
that different types of intangible capital play different roles across the four sector groups.
Chapter 2 analyses the determinants and impacts of intangible investment in China using
a firm-level dataset extracted from the World Bank China Enterprise Survey 2012. It is
discovered that more human capital, larger firm size and better institutional quality
generally increase the propensity and the amount of intangible investment, and yet fiercer
market competition generally decreases both the propensity and the amount to invest in
intangibles. The disaggregated components of intangibles are found to be positively
correlated with firm productivity, and there is complementarity between software
investment and organization investment. Chapter 3 studies the interaction between
organization capital and firm human management practice using data from Chinese listed
firms. Organization capital, unlike physical capital, is likely to be influenced by the
human management practice of a firm. The listed firms of China provide a valuable
sample for studying the interaction between human management practice and the
efficiency of organization capital given that there exists a large number of listed
state-owned enterprises (SOEs). The study finds that organization capital is indeed an
important production factor in Chinese listed firms, and SOEs invest more in organization
capital due to low employee’ turnover but have a lower efficiency in organization capital
compared with private enterprises.
The other three chapters include issues on intangible capital related to energy intensity,
macroeconomics and productivity. Chapter 4 investigates the relationship between
economies. Although intangible capital has been well documented to be essential for
economic and productivity growth, relevant studies on its role in improving energy
intensity are rare. This chapter establishes a relatively robust causal relationship between
intangible capital and sectoral energy intensity, based on a rich dataset of 40 economies
derived from the World Input-Output Database (WIOD) spanning across 13 years (1995
– 2007). The qualitative and quantitative interactions of this relationship with income
level and sectoral heterogeneity are also revealed. Chapter 5 examines the heterogenous
output elasticity and productivity spillover effect of intangible capital between sectors
and economies. It is found that intangible capital significantly contributes to both output
growth and productivity spillover, and both effects demonstrate an inverted U-shape
relationship with income level and significantly vary across sectors. Chapter 6 surveys
why the basic neoclassical growth model fails to explain the lost decades of the Japanese
economy and demonstrates how the extension of intangible capital and non-neutral
technology greatly improve the simulation results, which highlights the importance of
References
Atkeson, A., Kehoe, P.J.J., 2005. Modeling and measuring organization capital. Journal of Political
Economy 113, 1026–1053. https://doi.org/10.1086/431289
Chun, H., Nadiri, M.I., 2016. Intangible investment and changing sources of growth in Korea. Japanese
Economic Review 67, 50–76. https://doi.org/10.1111/jere.12079
Corrado, C.A., Hulten, C.R., 2010. How do you measure a “technological revolution”?, in: American Economic Review. pp. 99–104. https://doi.org/10.1257/aer.100.2.99
Corrado, C., Haskel, J., Lasinio, C.J., Iommi, M., 2014. Intangibles and industry productivity growth:
Evidence from the EU, the IARIW 33rd General Conference.
Corrado, C., Hulten, C., Sichel, D., 2009. Intangible capital and US economic growth. Review of Income
and Wealth 55, 661–685.
Eisfeldt, A.L., Papanikolaou, D., 2013. Organization capital and the cross-section of expected returns.
Journal of Finance 68, 1365–1406. https://doi.org/10.1111/jofi.12034
Fukao, K., Miyagawa, T., Mukai, K., Shinoda, Y., Tonogi, K., 2009. Intangible investment in Japan:
Measurement and contribution to economic growth. Review of Income and Wealth.
https://doi.org/10.1111/j.1475-4991.2009.00345.x
Goodridge, P., Haskel, J., Wallis, G., 2013. Can Intangible Investment Explain the UK Productivity
Puzzle? National Institute Economic Review 224, R48–R58. https://doi.org/10.1177/002795011322400104
Gourio, F., Rudanko, L., 2014a. Customer capital. Review of Economic Studies 81, 1102–1136. https://doi.org/10.1093/restud/rdu007
Gourio, F., Rudanko, L., 2014b. Can intangible capital explain cyclical movements in the labor wedge?,
Hulten, C.R., Hao, J.X., 2012. The role of intangible capital in the transformation and growth of the
Chinese economy, NBER Working Paper No. 18405.
McGrattan, E.R., Prescott, E.C., 2010. Unmeasured investment and the puzzling US boom in the 1990s.
American Economic Journal: Macroeconomics 2, 88–123. https://doi.org/10.1257/mac.2.4.88 Tronconi, C., Marzetti, G.V., 2011. Organization capital and firm performance: Empirical evidence for
European firms. Economics Letters 112, 141–143. https://doi.org/10.1016/j.econlet.2011.04.004 van Ark, B., Hao, J.X., Corrado, C., Hulten, C., 2009. Measuring intangible capital and its contribution to
1.
Intangible capital and China
’s economic growth: Evidence
from Input-Output Tables
*This study uses data from Input-Output Tables and a methodology adopted from Corrado
et al. (2009) to provide empirical evidence of the role of intangible capital in China by
industrial sector. In doing so it offers a first and new methodology for measuring the role
of intangible capital in a country where data on intangible capital are insufficient. It finds
that growth in intangible capital explains almost 20% of the total factor productivity (TFP)
growth over the period 1997 to 2012. Moreover, these effects of intangible capital remain
robust under various forms of sensitivity analysis including bootstrap, Levinsohn and
Petrin (2003) approach and changes in the depreciation rate. At the sector level, we find
that research and development (R&D), which embodies innovation, plays a more
important role in agriculture than economic competency and computerized information;
but that the role of economic competency is more important than that of R&D and
computerized information in the services and light industry sectors.
1.1
Introduction
China has enjoyed rapid growth since its reform and opening up policies were
implemented in 1978. Real GDP per capita of China in 1978 was only one-fortieth of
the US level and one tenth of the Brazilian level (Zhu, 2012). By 2015 however, China
had real GDP per capita that was almost equal to one fourth of the US level and at the
same level as Brazil1. Growth in total factor productivity (TFP) has played a critical role
* This chapter is also published as a book chapter in China Update2017.
1 GDP per capita using PPP approach (constant 2011 international currency), data from International
in China’s growth miracle. According to Zhu (2012), positive change in TFP accounts
for 78% of the growth in China’s GDP per capita between 1978 and 2007. The
transition from the planned economy to the market economy is a major source of TFP
growth and has significantly improved China’s TFP, but this source of TFP growth
cannot last forever since return from earlier reforms is diminishing.
From the year 2012, Chinese economic growth has been slowing down and has entered
a stage called the ‘New Normal’. The Chinese official definition of the ‘New Normal’ is
that China will maintain stable and relatively lower growth compared with earlier
growth rates. What could be the new source of growth of China in the stage of the ‘New
Normal’? The script on the back of an iPhone may provide a hint. It reads, ‘Designed by
Apple in California. Assembled in China.’ Payment to Chinese labour and profits of
non-Apple companies respectively account for only 1.8% and 9.2% of the value added
of an iPhone while profits of Apple takes up 58.5% of the total value added in 2010,
according to Kraemer et al. (2011). This striking fact has an important implication: the
distribution of value added in the global value chain is favourable to those who own the
product design and hence the market power instead of those who manufacture the
products.
Product design and market power embody a broader concept called intangibles (Corrado
et al., 2009). Intangible capital consists of the stock of immaterial resources that enter
the production process and are important for the creation or improvement of products as
defined in a broad way, following Corrado et al. (2009). Specifically, it includes
innovative property (R&D), computerized information (software, database etc.) and
economic competency (brand equity and organization capital). Intangible capital has
been playing an increasingly important role in boosting productivity and economic
growth since the ‘IT revolution’. In developed economies, the relative use of tangible
capital is decreasing while the relative use of intangible capital, such as production
technologies, product design, market power, and intangibles embodied in employees
and firm structure, has been increasing (Chun and Nadiri, 2016; Corrado and Hulten,
2010; Fukao et al., 2009; Marrano et al., 2009; Miyagawa and Hisa, 2013; van Ark et
al., 2009).
The literature on intangible capital is significant, and includes discussion of intangible
capital as a source of growth in various countries at national level and industry level
(Borgo et al., 2013; Chun and Nadiri, 2016; Corrado et al., 2013; Corrado and Hulten,
2010; Fukao et al., 2009; Haskel and Wallis, 2013; Marrano et al., 2009; Miyagawa and
Hisa, 2013; van Ark et al., 2009), discussion of intangible capital in firms’ valuation and
productivity (Arato and Yamada, 2012; Atkeson and Kehoe, 2005; Clausen and Hirth,
2016; Eisfeldt and Papanikolaou, 2014, 2013; Gourio and Rudanko, 2014a; Tronconi
and Marzetti, 2011), and discussion of incorporating intangible capital to solve
macroeconomic puzzles (Goodridge et al., 2013; Gourio and Rudanko, 2014b;
McGrattan and Prescott, 2014, 2010). However, studies on intangible capital in China
are scarce both due to the lack of data and the newer importance of intangible capital to
2000 and 2008 and conduct growth accounting of national data using the income share
method. The authors gather only nine observations, which is not sufficient for a
comprehensive analysis. Given China’s shifting growth model and the possibility of
utilizing alternative data sources, it is timely to further investigate the role of intangible
capital in China’s growth.
To the best of our knowledge, this study is the first empirical test of how intangibles
enhance economic growth at sectoral level in China. In contrast to national-level study,
industry-level study has the advantage of generating more observations and thus allows
more statistical degrees of freedom to analyse how different categories of intangible
capital impact on economic growth. This will provide a better way to assess the role of
intangibles in an economy.
We divided one hundred sectors from China’s Input-Output Tables of 1997, 2002, 2007
and 20122 into four subgroups: agriculture, light industry, heavy industry and service,
to alleviate the problem of parameter heterogeneity between sectors. The selected
Input-Output Tables are constructed using data from China’s National Bureau of Statistics and
Input-Output Survey. The measurement of intangible investment in this study follows
the literature in capitalizing either intangible intermediates or intangible expenditure.
Use of intermediates from input-output tables to estimate intangibles is common in
previous literature3, including Chun and Nadiri (2016), Corrado et al. (2014) and
2 The reason we exclude the Input-Output Tables for 1987 and 1992 is that these two earlier tables are
inaccurate and include few of the intangible intermediates.
3 Intangible investment produced within firms is not reflected in input-output tables. However, as long as
Miyagawa and Hisa (2013).
Different from Corrado et al. (2009), Fukao et al. (2009) and Hulten and Hao (2012),
this study, however, uses a proxy approach. That is, using the entries relevant to
intangible investment as proxies, and assuming that the ratios of intangible investments
to the proxies remain constant over time. Using the proxy approach and assuming the
ratio of true value to proxies constant overtime is also common in the literature on
intangible capital. For example, Gourio and Rudanko (2014a) proxy the Selling &
General Administration (S&GA) expense for investment in customer capital; Tronconi
and Marzetti (2011) and Eisfeldt and Papanikolaou (2014) proxy S&GA expense for
investment in organization capital. Although this assumption is often found to be
invalid, it is the best this study could adopt based on the available data; if this
assumption is true, the study will avoid the inaccurate measuring problems found in
Corrado et al. (2009) and Fukao et al. (2009).
When conducting growth accounting, we adopt the Cobb-Douglas parameter estimation
based on econometrics instead of income/cost shares, along the lines of Niebel et al.
(2017). The advantage of this approach is to allow for the existence of error terms. The
income share method used by Corrado et al. (2009), Fukao et al. (2009), and Hulten and
Hao (2012) may, in contrast, underestimate the contribution of resource reallocation to
economic growth when the economy is in disequilibrium, according to Nadiri (1970). In
the case of a transitional economy like China, the economy is likely to remain in
disequilibrium over time. Therefore, the income share method is not suitable in the case
of China. Our choice of econometric approach allows for an error term, which alleviates
the problems arising from disequilibrium.
Our study also conducts bootstrap regressions to confirm the robustness of the results,
which is new to the existing literature. Limited by the time span (T=4), the standard
system GMM approach is not suitable for this study. Bootstrap is the only feasible
method given data limitations. Studies on intangible capital often suffer from the
problem of small samples. Bootstrap regressions alleviate this problem to some extent.
Moreover, the depreciation rate of intangible capital is debatable. To confirm the
significance of the impacts of intangible capital, we will conduct a sensitivity analysis
by experimenting with various depreciation rates.
This study consists of five sections. In the next section, the methodology of growth
accounting at the industry level is discussed, and a traditional growth accounting
excluding intangible capital is conducted. Section 3 provides empirical evidence on the
relationship between intangible capital and total factor productivity (TFP). In section 4,
a growth accounting incorporating intangible capital is conducted. Section 5 draws the
conclusion.
1.2
How do we conduct growth accounting with sectoral data?
Growth accounting often utilises the Cobb-Douglas production function:
where Y is GDP, A stands for the total factor productivity, and K represents the capital.
If the object is a nation, then we directly take the logarithm of both sides and then run a
regression. The parameters 𝑎𝑘 and 𝑎𝑙 can be estimated in this way. However, with
sectoral data, there is a problem: the parameters of each industry may vary. If a pooled
regression is conducted, the heterogeneity of parameters will cause bias of the estimates.
Moreover, each industry may have its own initial TFP value, which implies different
intercepts of various industries. To cope with the problem of parameter heterogeneity,
we categorize industries according to similarities in parameters following previous
literature such as Harris and Robinson (2002). In this study, the subgroups are defined
as follows: light industry, heavy industry, agriculture and service4
. Then, we assume a
Cobb-Douglas production function:
𝑌𝑖𝑡 = 𝐴𝑖𝑡𝐾𝑖𝑡𝑎𝑘𝐿𝑎𝑙𝑖𝑡 (1)
Y𝑖𝑡 is the value added of sector i at time t; A𝑖𝑡 is the TFP of sector i at time t; K𝑖𝑡 is
the capital by traditional definition (excluding most of the intangibles); L𝑖𝑡 is the
number of labour input. 𝑎𝑘 and 𝑎𝑙 are the capital and labour elasticities of output
respectively. Due to sectoral heterogeneity, the initial values of TFP may be different
across sectors. We therefore assume:
A𝑖𝑡 = A𝑖0𝑒𝛾𝑡
Take the logarithm of both sides:
lnY𝑖𝑡 = lnA𝑖𝑡 + 𝑎𝑘lnK𝑖𝑡+ 𝑎𝑙lnL𝑖𝑡 (2)
The equation can be estimated by either the fixed effects model or the random effects
model, depending on whether A𝑖0 varies from sector to sector within a subgroup.
A key issue in production function estimation is, however, correlation between the
un-observable productivity shocks and input levels. An industry responds to positive
productivity shocks by expanding output and input. Negative shocks lead an industry to
reduce output and input usage. When true, ordinary least square (OLS) estimates of
production functions are likely to be biased, which leads to biased estimates of
productivity. Olley and Pakes (1996) (OP) develop an estimation approach using
investment as a proxy for these un-observable shocks. More recently, Levinsohn and
Petrin (2003) (LP) point out that investment is lumpy. If this is true, then the investment
proxy may not smoothly respond to productivity shocks. Levinsohn and Petrin (2003)
suggest that using intermediate input can solve this problem. Therefore, here we also
adopt growth accounting without intangibles5 using the LP approach. The proxy used in
this study is the usage of electricity, heating, fuel and water intermediates at 1997
constant prices6.
The growth rate of TFP is backed out as:
𝑔_𝑡𝑓𝑝 = 𝑔𝑦− 𝑎𝑘𝑔𝑘− 𝑎𝑙𝑔𝑙 (3)
Capital and labour inputs are not available at a sectoral level as detailed as the one in
China’s Input-Output Tables. Luckily, China’s Input-Output Tables have two variables:
the total wages of labour and the depreciation of capital. We adjust the nominated
5 The LP approach allows only one capital variable. However, when incorporating intangible capital,
there are at least two capital variables. Therefore, we do not conduct growth accounting with intangible capital using the LP approach.
6 Deflators are obtained from National Bureau of Statistics of China and the World Input Output
depreciation of capital to real depreciation using the Price Index of Investment in Fixed
Assets from National Bureau of Statistics of China.
Assume a constant depreciation rate θ as is the convention in previous literature:
θK𝑖𝑡 = real depreciation𝑖𝑡 (4)
Then, it is clear that real depreciation𝑖𝑡 has a strictly linear relationship with K𝑖𝑡 and
therefore is a perfect proxy for capital. As for the quantity of labour, we have:
L𝑖𝑡 = total wage𝑖𝑡
average wage𝑖𝑡 (5)
Total wage𝑖𝑡 is from China’s Input-Output Tables and average wage𝑖𝑡 is from the
Labour Statistics Yearbook of China. However, the sectoral classification in the Labour
Statistics Yearbook of China is not as detailed as that in China’s Input-Output Tables.
Therefore, the average wage of the upper level of classification is used as a proxy for
the average wage of individual sectors7.
Substitute K𝑖𝑡 in (2) with (4),
lnY𝑖𝑡 = lnA𝑖𝑡− 𝑎𝑘ln(θ) + 𝑎𝑘ln Capital_proxy𝑖𝑡+ 𝑎𝑙lnL𝑖𝑡 (6)
It is clear that substituting the capital proxy (real depreciation𝑖𝑡) for K𝑖𝑡 is appropriate
because the coefficient of real depreciation𝑖𝑡 is the same as that of K𝑖𝑡. The
depreciation rate θ becomes a part of the intercept. The growth rate of K𝑖𝑡 that is used
for the calculation of TFP is exactly the same as the growth rate of real depreciation𝑖𝑡.
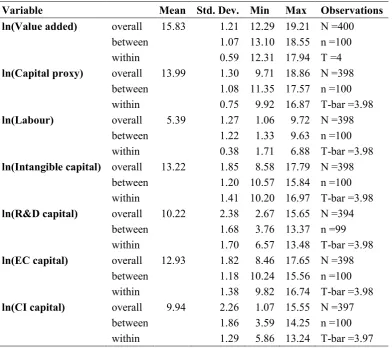
Table 1 reports the descriptive statistics of the variables used in regressions, over the
7 The proxy is based on an assumption that the ratio of the average wage of a lower level sector to that of
period 1998 to 2012. It is clear that the ranges of value added, capital proxy, labour and
different categories of intangible capital are large. This sample consists of 100 sectors in
[image:23.595.117.510.180.528.2]China across four years and therefore has nearly 400 observations.
Table 1 Descriptive statistics
Variable Mean Std. Dev. Min Max Observations
ln(Value added) overall 15.83 1.21 12.29 19.21 N =400
between 1.07 13.10 18.55 n =100 within 0.59 12.31 17.94 T =4
ln(Capital proxy) overall 13.99 1.30 9.71 18.86 N =398
between 1.08 11.35 17.57 n =100 within 0.75 9.92 16.87 T-bar =3.98
ln(Labour) overall 5.39 1.27 1.06 9.72 N =398
between 1.22 1.33 9.63 n =100 within 0.38 1.71 6.88 T-bar =3.98
ln(Intangible capital) overall 13.22 1.85 8.58 17.79 N =398
between 1.20 10.57 15.84 n =100 within 1.41 10.20 16.97 T-bar =3.98
ln(R&D capital) overall 10.22 2.38 2.67 15.65 N =394
between 1.68 3.76 13.37 n =99 within 1.70 6.57 13.48 T-bar =3.98
ln(EC capital) overall 12.93 1.82 8.46 17.65 N =398
between 1.18 10.24 15.56 n =100 within 1.38 9.82 16.74 T-bar =3.98
ln(CI capital) overall 9.94 2.26 1.07 15.55 N =397
between 1.86 3.59 14.25 n =100 within 1.29 5.86 13.24 T-bar =3.97
Notes: EC stands for economic competency and CI stands for computerized information. Source: Authors’ own calculation.
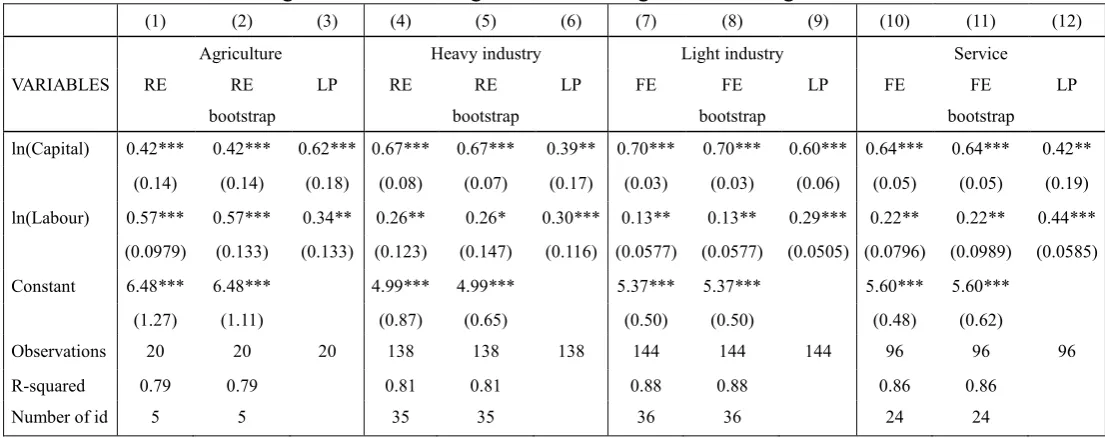
The results for growth accounting are displayed in Table 2. According to Hausman tests
(please see Appendix C), random effects models are appropriate to study agriculture and
light industry sectors, and fixed effects models are used for the heavy industry and
services sectors. Both labour and depreciation are highly economically and statistically
significant, and remain robust when using bootstrap regressions. A 1% change in capital
agriculture, heavy industry, light industry and service respectively. A 1% change in
labour is associated with 0.57%, 0.26%, 0.13% and 0.22% changes in value added in
agriculture, heavy industry, light industry and service respectively. The growth rate of
[image:24.595.24.577.211.430.2]TFP is calculated according to equation (3).
Table 2 Regression results for growth accounting without intangibles
(1) (2) (3) (4) (5) (6) (7) (8) (9) (10) (11) (12)
Agriculture Heavy industry Light industry Service
VARIABLES RE RE
bootstrap
LP RE RE
bootstrap
LP FE FE
bootstrap
LP FE FE
bootstrap LP
ln(Capital) 0.42*** 0.42*** 0.62*** 0.67*** 0.67*** 0.39** 0.70*** 0.70*** 0.60*** 0.64*** 0.64*** 0.42**
(0.14) (0.14) (0.18) (0.08) (0.07) (0.17) (0.03) (0.03) (0.06) (0.05) (0.05) (0.19)
ln(Labour) 0.57*** 0.57*** 0.34** 0.26** 0.26* 0.30*** 0.13** 0.13** 0.29*** 0.22** 0.22** 0.44***
(0.0979) (0.133) (0.133) (0.123) (0.147) (0.116) (0.0577) (0.0577) (0.0505) (0.0796) (0.0989) (0.0585)
Constant 6.48*** 6.48*** 4.99*** 4.99*** 5.37*** 5.37*** 5.60*** 5.60***
(1.27) (1.11) (0.87) (0.65) (0.50) (0.50) (0.48) (0.62)
Observations 20 20 20 138 138 138 144 144 144 96 96 96
R-squared 0.79 0.79 0.81 0.81 0.88 0.88 0.86 0.86
Number of id 5 5 35 35 36 36 24 24
Notes: Cluster robust standard errors in parentheses. *** p<0.01, ** p<0.05, * p<0.1. Number of bootstrap replications: 400 for normal bootstrap, 250 for LP.
Source: Authors’ own calculation.
1.3
Intangible capital and TFP growth
According to Corrado et al. (2009), intangible investment consists of computerized
information, innovative property and economic competency. Traditionally, intangible
investment is classified as intermediate or expenditure and is therefore not manifested in
national accounts. However, investment is the action of sacrificing today’s consumption
for increasing consumption in the future, according to Hulten (1979) and Corrado et al.
(2009). Moreover, the effects of the intangible expenditure mentioned above last more
We follow the literature to measure intangibles by capitalizing intangible intermediates
or intangible expenditure. Specifically, this study obtains relevant intermediate data
from China’s Input-Output Tables and assumes the ratio of the intermediate to the true
intangible investment remains constant over time. The proxy approach is commonly
adopted in measuring intangible investment and is well founded. For example, Gourio
& Rudanko (2014) proxy the Selling & General Administration (S&GA) expense for
customer capital investment; and Tronconi & Marzetti (2011) and Eisfeldt &
Papanikolaou (2014) proxy S&GA expense for organization capital investment. Table 3
[image:25.595.89.560.377.635.2]presents our proxies for intangible investment.
Table 3 Categories of intangible investment
Proxy Comments
1.Computerized information (mainly software)
Computer services and software intermediate
Include software
2.Innovative property
(a)Scientific R&D Research industry intermediate Include R&D expenditure
(b)Non-scientific R&D 3.Economic competencies
(a)Brand equity (mainly advertising)
(b)Firm-specific resources (Organization capital and staff training)
Culture, arts, radio, movie and television industry intermediate
Include parts of advertising expenditure
Business service industry intermediate
Include advertising expenditure and organization investment
Education industry intermediate Include staff training
Notes: The intangible investment classification follows Corrado et al. (2009). Source: Authors’ own construction.
Following Corrado et al. (2009), intangible investment is deflated to 1997 constant price
using the GDP deflator8. Since the interval of each Input-Output Table is five years, we
interpolate the missing data within the interval by assuming the growth rate is constant
within the five-year interval. The depreciation rate of the intangible capital is set
according to Corrado et al. (2009): 20% for R&D, 33% for computerized information,
60% for brand equity, and 40% for firm-specific resources. Based on these, we assume
40% for overall intangible and 50% for economic competency intangible. Intangible
capital in 1997 was set to zero, and therefore 1998 is the first year for which this study
calculates the intangible capital. According to Corrado et al. (2009), the year that initial
capital stocks are zero has little effect on growth accounting analysis because
depreciation rates are high and much previous capital has been depreciated away by the
date we start the analysis, i.e., the year 1998. Moreover, the amount of intangible capital
in China was considerably smaller in the 1990s, as manifested by low R&D (0.57% of
GDP in 19969 and unavailable before 1996) and software use. Therefore, setting
intangible capital in 1997 to zero will not cause significant problems.
Table 4 shows the trend of the sectoral average ratio of intangible to tangible. The
amount of tangible capital is derived based on an assumed depreciation rate of 5%10.
The amount of intangible capital is calculated using the method explained above.
Accompanying China’s rapid economic growth over the last two decades is a significant
rise in its intangible-tangible ratio. However, compared with more advanced economies,
the intensity of using intangible capital in China’s production is still low and therefore
there is great room for catch-up in the future. For example, the intangible-tangible ratios
9 Data obtained from the World Bank.
of Japan, the US, the UK in 2007 were 17%, 22% and 24%11 respectively. Please note
that parts of the proxies include expenditures that are not intangible investment and
exclude those that are produced within firms. This suggests that the actual
intangible-tangible ratio might be lower or higher than the figures in Table 4.
Table 4 Increasing trend of intangibles in China
1998 2002 2007 2012
Sectoral average intangibles 1,573,790 8,880,930 24,017,800 59,924,580
Sectoral average tangibles 216,289,200 333,212,600 697,231,200 1280,413,600
Ratio 0.7% 2.7% 3.4% 4.7%
Unit: thousand RMB
Source: Authors’ own calculation. Raw data obtained from China’s Input-Output Tables.
Since TFP is the portion of output that cannot be accounted for by input (Comin, 2006),
we should be careful when linking TFP to intangible capital. Change in TFP is possibly
caused by changes in human capital and institutional quality. Changes in human capital
and institutions are often not sector-specific, which can be controlled for at the national
level. To capture human capital and institutional quality changes, this study uses two
proxies. The first is GDP per capita and the second is time dummy that captures time
effects. The positive correlation between economic development, human capital and
institutional quality has been well documented (Weede et al., 2002; Gwartney et al.,
2004), which forms the basis of using GDP per capita as the proxy for human capital
and institutional quality. The time dummy provides a different overall TFP growth rate
for each year so we can separate TFP growth at the national level from that caused by
changes in intangible capital within individual industries. To control for the scale of an
industry, the indicator of intangible capital is the ratio of intangibles to tangibles instead
11 Tangible capital data is obtained from the Penn World Table 8.1 and intangible capita data is obtained
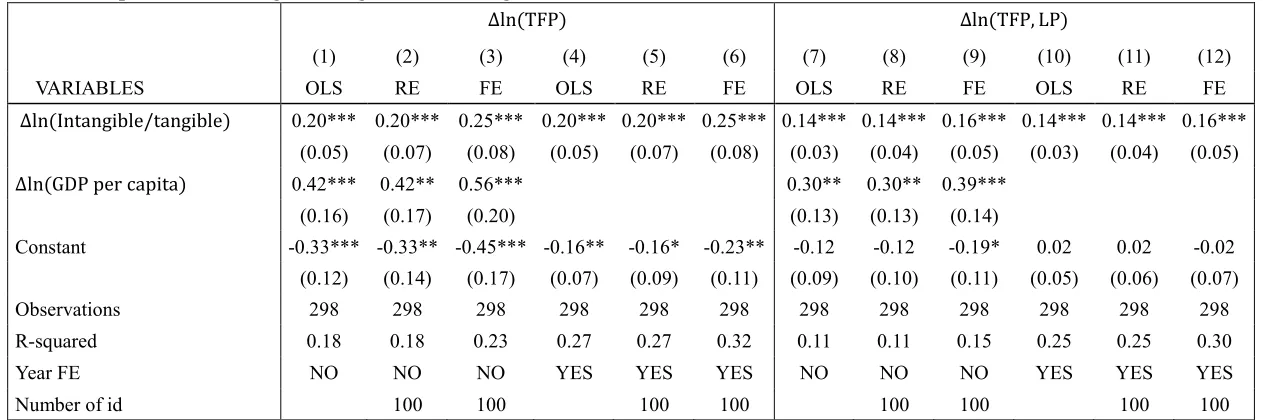
of the absolute amount of intangibles. Table 5 demonstrates the relationship between the
growth rate of TFP and the growth rate of the intangible to tangible ratio. Please note
that there are two types of total factor productivity: one is TFP derived from RE/ FE
models and the other is TFP, LP derived from the LP models, which are used to check
Table 5 Relationship between intangible-tangible ratio and growth of TFP
∆ln (TFP) ∆ln (TFP, LP)
(1) (2) (3) (4) (5) (6) (7) (8) (9) (10) (11) (12)
VARIABLES OLS RE FE OLS RE FE OLS RE FE OLS RE FE
∆ln (Intangible/tangible) 0.20*** 0.20*** 0.25*** 0.20*** 0.20*** 0.25*** 0.14*** 0.14*** 0.16*** 0.14*** 0.14*** 0.16*** (0.05) (0.07) (0.08) (0.05) (0.07) (0.08) (0.03) (0.04) (0.05) (0.03) (0.04) (0.05)
∆ln (GDP per capita) 0.42*** 0.42** 0.56*** 0.30** 0.30** 0.39***
(0.16) (0.17) (0.20) (0.13) (0.13) (0.14)
Constant -0.33*** -0.33** -0.45*** -0.16** -0.16* -0.23** -0.12 -0.12 -0.19* 0.02 0.02 -0.02 (0.12) (0.14) (0.17) (0.07) (0.09) (0.11) (0.09) (0.10) (0.11) (0.05) (0.06) (0.07)
Observations 298 298 298 298 298 298 298 298 298 298 298 298
R-squared 0.18 0.18 0.23 0.27 0.27 0.32 0.11 0.11 0.15 0.25 0.25 0.30
Year FE NO NO NO YES YES YES NO NO NO YES YES YES
Number of id 100 100 100 100 100 100 100 100
Notes: cluster robust standard errors in parentheses except OLS, OLS is with robust standard error. *** p<0.01, ** p<0.05, * p<0.1. Number of bootstrap replications: 400 for normal bootstrap, 250 for LP. TFP denotes the total factor productivity derived from RE/FE models while TFP, LP denotes the total factor productivity derived from LP models.
Importantly, the growth rate of the intangible-tangible ratio is economically and
statistically significant across all specifications. A 1% growth in the intangible tangible
ratio is associated with 0.26%, 0.26%, 0.31%, 0.26%, 0.26%, 0.31% growth in TFP
respectively according to models (1) – (6). A 1% growth in the intangible-tangible ratio
is associated with a 0.14%, 0.14%, 0.16%, 0.14%, 0.14%, 0.16% growth in TFP, LP
respectively according to models (7) – (12). Growth of the intangible tangible ratio also
explains a significant amount of TFP change, respectively at 17% according to model
(4) and at 11% according to model (10)12. The significant impact of intangibles on TFP
is consistent with the findings of Corrado et al. (2014). Corrado et al. (2014) regress
TFP on intangibles, ICT and other variables and find that intangible capital is the only
one that is significant. With GDP per capita and time effects as the control variables and
the fixed effects estimator, the intangible to tangible ratio is still statistically and
economically significant, which suggests that the finding is robust. Based on the above
evidence, we thus conclude that intangible capital does play a significant role in China’s
productivity increase.
Another interesting question to ask is how the contributions of different categories of
intangible capital to TFP growth differ. Table 6 shows the results of the effects of
different intangible capital on TFP growth. When using TFP derived from RE/ FE
models, all categories of intangible capital play important roles in the growth of TFP,
being robust across all the models. Specifically, according to model (4), a 1% increase
12 The square of partial correlation coefficient between ∆ln (TFP)/∆ln (TFP, LP) and ∆ln (Intangible/
tangible) is the percentage of variance in ∆ln (TFP)/∆ln (TFP, LP) that can be explained by
in the ratio of computerized information capital to tangible capital is associated with
0.08% of growth in TFP; a 1% growth in the ratio of R&D capital to tangible capital is
associated with 0.11% of growth in TFP; a 1% growth in the ratio of economic
competency capital to tangible capital is associated with 0.13% of growth in TFP. This
is consistent with Chun et al. (2012) who find that innovative property is the most
significant among all sorts of intangible investments when they are used to explain the
growth of TFP in the Japanese economy. However, when the method of deriving TFP
changes from FE/RE models to LP models, the results differ. Although the scale of the
coefficients has not changed dramatically, the statistical significance has. Computerized
information capital is no longer significant, and economic competency is insignificant
when year effects not controlled. R&D capital remains generally significant. When it
comes to the scale of the effects, according to model (8), a 1% growth in the ratio of
computerized information capital to tangible capital is associated with a 0.03% increase
in TFP, LP; a 1% growth in the ratio of R&D capital to tangible capital is associated
with a 0.04% increase in TFP, LP; a 1% growth in the ratio of economic competency
capital to tangible capital is associated with a 0.11% increase in TFP, LP.
∆ln (TFP) ∆ln (TFP, LP)
(1) (2) (3) (4) (5) (6) (7) (8)
VARIABLES OLS RE OLS RE OLS RE OLS RE
∆ln (CI/Tangible) 0.07** 0.07** 0.06* 0.06* 0.05 0.05 0.03 0.03
(0.03) (0.03) (0.03) (0.03) (0.03) (0.03) (0.03) (0.03)
∆ln (R&D/Tangible) 0.11*** 0.11*** 0.07** 0.07*** 0.09*** 0.09*** 0.04 0.04* (0.03) (0.03) (0.03) (0.03) (0.03) (0.03) (0.03) (0.02)
∆ln (EC/Tangible) 0.08* 0.08* 0.12*** 0.12*** 0.05 0.05 0.11*** 0.11*** (0.04) (0.04) (0.04) (0.04) (0.03) (0.03) (0.03) (0.03) Constant -0.05 -0.05 -0.14*** -0.14*** 0.07* 0.07** -0.05 -0.05 (0.04) (0.04) (0.05) (0.04) (0.04) (0.04) (0.04) (0.04)
Observations 196 196 196 196 196 196 196 196
R-squared 0.30 0.30 0.35 0.35 0.21 0.21 0.31 0.31
Year FE NO NO YES YES NO NO YES YES
Number of id 98 98 98 98
Notes: cluster robust standard errors in parentheses except OLS, OLS is with robust standard error. *** p<0.01, ** p<0.05, * p<0.1. Cluster robust standard error is unavailable when using FE models due to insufficient rank and therefore FE models are not used. CI stands for computerized information (mainly software); R&D stands for innovative property; EC stands for economic competency. TFP denotes the total factor productivity derived from RE/FE models while TFP, LP denotes the total factor productivity derived from LP models.
Source: Authors’ own calculation.
1.4
Growth accounting incorporating intangible capital
According to Corrado et al. (2009), the production function could be written as below
when intangible capital is incorporated:
𝑌 = 𝐴𝐾𝑎𝑘𝐼𝑎𝑖𝐿𝑎𝑙
where I is the intangible capital stock and ai is the output elasticity of intangible capital.
When intangible expenditure is viewed as investment, it should be counted as value
added according to the national account identity (Corrado et al., 2009). Therefore, when
conducting growth accounting with intangible capital, an even more accurate
measurement of intangible investment is required. In this study, however, we do not
assume 100% as the base case13.
Table 7 demonstrates the results of growth accounting incorporating intangible capital.
The impacts of intangibles on economic growth of all the subgroups are economically
and statistically significant. A 1% increase in intangible capital is respectively
associated with 0.16%, 0.22%, 0.14% and 0.24% output growth in agriculture, heavy
industry, light industry and service. This indicates that intangible capital has become an
[image:33.595.69.586.336.579.2]important source of growth in the Chinese economy.
Table 7 Results of growth accounting with intangibles
(1) (2) (3) (4) (5) (6) (7) (8)
Agriculture Heavy industry Light industry Service VARIABLES RE RE bootstrap RE RE bootstrap FE FE bootstrap FE FE bootstrap ln(Tangibles) 0.36*** 0.36*** 0.29*** 0.29** 0.40*** 0.40*** 0.32*** 0.32***
(0.09) (0.13) (0.11) (0.12) (0.04) (0.04) (0.08) (0.09) ln(Labour) 0.54*** 0.54*** 0.44*** 0.44*** 0.37*** 0.37*** 0.39*** 0.39***
(0.04) (0.09) (0.11) (0.10) (0.06) (0.06) (0.07) (0.10) ln(Intangibles) 0.16*** 0.15** 0.22*** 0.22*** 0.14*** 0.14*** 0.24*** 0.24***
(0.05) (0.08) (0.05) (0.05) (0.02) (0.02) (0.05) (0.06) Constant 5.68*** 5.65*** 6.56*** 6.56*** 6.36*** 6.36*** 6.09*** 6.09***
(0.38) (0.54) (0.74) (0.83) (0.39) (0.39) (0.49) (0.68)
Observations 20 20 138 138 144 144 96 96
R-squared 0.87 0.87 0.88 0.88 0.92 0.92 0.93 0.93
Number of id 5 5 35 35 36 36 24 24
Notes: cluster robust standard errors in parentheses except OLS, OLS is with robust standard error. *** p<0.01, ** p<0.05, * p<0.1.
Source: Authors’ own calculation.
As mentioned earlier, intangible capital can be divided into computerized information,
innovative property and economic competency. A question to be investigated is whether
their roles differ across industries. To answer this question, we first assume a production
13 The value of proportion does not matter for the results. When varying the proportion, the results remain
function in which intangible capital is decomposed:
𝑌 = 𝐴𝐾𝑎𝑘𝐼𝐶𝑎𝑖1𝑅𝐷𝑎𝑖2𝐸𝐶𝑎𝑖3𝐿𝑎𝑙
where CI stands for computerized information (mainly software); RD stands for
innovative property (R&D); EC stands for economic competency; 𝑎𝑖1, 𝑎𝑖2 and 𝑎𝑖3
are the output elasticities of the three inputs respectively.
Table 8 shows the results of growth accounting using the above production function.
Not all categories of intangible capital are significant (e.g. economic competency within
agricultural sector; R&D within services). One reason might be the strong positive
correlation between different categories of intangible capital due to their co-movement.
However, from the results in Table 8, we are able to obtain some information on the
roles of different intangible capital in different industries. In agriculture, R&D is
significant and positive. A 1% increase in R&D capital is predicted to increase a sector’s
value added by 0.15%. The coefficients of economic competency and computerized
information are small, which may indicate that their effects are trivial. In heavy
industry, all are economically and statistically significant. A 1% increase in R&D,
economic competency and computerized information is associated with 0.13%, 0.11%
and 0.04% growth in value added respectively. In light industry, both R&D and
economic competency capital are significant. A 1% growth in R&D and economic
competency is respectively correlated with 0.08% and 0.14% increases in value added.
The coefficient of computerized information capital is insignificant and small.
Therefore, economic competency capital is likely to play the most important role in
economic competency is significant. A 1% increase in economic competency capital is
associated with 0.25% of value added growth. The coefficients of both R&D and
computerized information capital are insignificant and small in value, which may imply
that economic competency is the most important category of intangible capital in
[image:35.595.73.581.240.557.2]service.
Table 8 Results of growth accounting with detailed intangible capital
(1) (2) (3) (4) (5) (6) (7) (8)
Agriculture Heavy industry Light industry Service VARIABLES RE RE bootstrap RE RE bootstrap FE FE bootstrap FE FE bootstrap ln(Tangibles) 0.35*** 0.35 0.22*** 0.22** 0.30*** 0.30*** 0.29*** 0.29***
(0.08) (0.27) (0.09 (0.10) (0.06) (0.05) (0.06) (0.07) ln(Labour) 0.52*** 0.52** 0.49*** 0.49*** 0.44*** 0.44*** 0.39*** 0.39***
(0.06) (0.21) (0.07) (0.07) (0.08) (0.08) (0.07) (0.11) ln(RD) 0.15*** 0.15 0.13*** 0.13*** 0.08** 0.08** 0.02 0.02
(0.03) (0.15) (0.02) (0.03) (0.03) (0.03) (0.02) (0.02) ln(EC) 0.02 0.02 0.11*** 0.11** 0.14*** 0.14*** 0.25*** 0.25***
(0.05) (0.13) (0.04) (0.05) (0.02) (0.03) (0.05) (0.05)
Ln(CI) -0.06*** -0.06 0.04** 0.04** -0.01 -0.01 0.02 0.02
(0.01) (0.07) (0.02) (0.02) (0.01) (0.01) (0.03) (0.03) Constant 6.57*** 6.57*** 7.02*** 7.02*** 6.78*** 6.78*** 6.05*** 6.05***
(0.81) (1.70) (0.60) (0.79) (0.39) (0.43) (0.41) (0.67)
Observations 20 20 137 137 144 144 92 92
R-squared 0.99 0.99 0.93 0.93 0.94 0.94 0.94 0.94
Number of id 5 5 35 35 36 36 23 23
Notes: cluster robust standard errors in parentheses except OLS, OLS is with robust standard error. *** p<0.01, ** p<0.05, * p<0.1. CI stands for computerized information (mainly software); R&D stands for innovative property; EC stands for economic competency.
1.5
Conclusion
Intangible capital and its various forms – technology, product design, marketing and
organizational development – is the foundation of knowledge economies. According to
our results, China, a transitional economy, has started to benefit from the rapid growth
of intangible capital. Using China’s Input-Output Tables of various years, this study
provides an important insight into the role of intangible capital in different industries in
the context of an emerging knowledge economy. It is specifically found that growth in
intangible capital is significantly associated with TFP growth in China, and explains
almost 20% of the TFP growth over the sample period. The results are generally robust
across the different model specifications.
This study also reveals the relative importance of different categories of intangible
capital in different industries. In agriculture, R&D is likely to play a critical role, but the
role of other intangible capital is relatively trivial. To the heavy industry sector, R&D,
computerized information (mainly software) and economic competency all are
important to growth, but R&D is the most important. While the effects of both
economic competency and R&D are significant to the growth of light industry, R&D is
more significant. Last but not least, in service, the role of economic competency is
critical while others are relatively unimportant. In other words, the role of R&D is
important across all non-service industries while the role of economic competency is
paramount across all non-agriculture industries.
small compared with that in advanced economies. In 2007, the intangible-tangible ratio
in China was approximately 3.4%. This compares to the same ratio for Japan, the US,
the UK being 17%, 22% and 24% respectively. This is consistent with China’s role at
the assembly end of global value chains and the fact that the investment in design /
intellectual property / brands remains the preserve of more developed economies. Given
that the productivity boost from ‘reform and opening up’ is diminishing and China has
entered the ‘New Normal’, it is evidently time for China to invest in new sources of
growth – and clearly intangible capital is one of them.
The transformation from ‘made in China’ to ‘designed in China’ has a long way to run,
but the shifts in the intangible to tangible ratio identified here suggest that China is
catching up to frontier economies. Given the gradually increasing intangible capital in
China, there is every reason to believe that rapid growth in intangible capital will
References
Arato, H., Yamada, K., 2012. Japan’s intangible capital and valuation of corporations in a neoclassical
framework. Review of Economic Dynamics 15, 459–478. https://doi.org/10.1016/j.red.2012.01.001 Arrighetti, A., Landini, F., Lasagni, A., 2014. Intangible assets and firm heterogeneity: Evidence from
Italy. Research Policy 43, 202–213. https://doi.org/10.1016/j.respol.2013.07.015
Atkeson, A., Kehoe, P.J.J., 2005. Modeling and measuring organization capital. Journal of Political
Economy 113, 1026–1053. https://doi.org/10.1086/431289
Borgo, M.D., Goodridge, P., Haskel, J., Pesole, A., 2013. Productivity and growth in UK industries: An
intangible investment approach. Oxford Bulletin of Economics and Statistics 75, 806–834. https://doi.org/10.1111/j.1468-0084.2012.00718.x
Chun, H., Kyoji, F., Shoichi, H., Miyagawa, T., 2012. Measurement of intangible investments by industry
and its role in productivity improvement utilizing comparative studies between Japan and Korea
(No. 12-NaN-37), RIETI Discussion Paper Series.
Chun, H., Nadiri, M.I., 2016. Intangible Investment and changing sources of growth in Korea. Japanese
Economic Review 67, 50–76. https://doi.org/10.1111/jere.12079
Clausen, S., Hirth, S., 2016. Measuring the value of intangibles. Journal of Corporate Finance 40, 110–
127. https://doi.org/10.1016/j.jcorpfin.2016.07.012
Corrado, C.A., Hulten, C.R., 2010. How do you measure a “technological revolution”?, in: American Economic Review. pp. 99–104. https://doi.org/10.1257/aer.100.2.99
Corrado, C., Haskel, J., Jona-Lasinio, C., Iommi, M., 2013. Innovation and intangible investment in
Europe, Japan, and the United States. Oxford Review of Economic Policy 29, 261–286. Corrado, C., Haskel, J., Lasinio, C.J., Iommi, M., 2014. Intangibles and industry productivity growth:
Corrado, C., Hulten, C., Sichel, D., 2009. Intangible capital and US economic growth. Review of Income
and Wealth 55, 661–685.
Eisfeldt, A.L., Papanikolaou, D., 2014. The value and ownership of intangible capital, in: American
Economic Review. pp. 189–194. https://doi.org/10.1257/aer.104.5.189
Eisfeldt, A.L., Papanikolaou, D., 2013. Organization capital and the cross-section of expected returns.
Journal of Finance 68, 1365–1406. https://doi.org/10.1111/jofi.12034
Fukao, K., Miyagawa, T., Mukai, K., Shinoda, Y., Tonogi, K., 2009. Intangible investment in Japan:
Measurement and contribution to economic growth. Review of Income and Wealth.
https://doi.org/10.1111/j.1475-4991.2009.00345.x
Goodridge, P., Haskel, J., Wallis, G., 2013. Can intangible investment explain the UK productivity
puzzle? National Institute Economic Review 224, R48–R58. https://doi.org/10.1177/002795011322400104
Gourio, F., Rudanko, L., 2014a. Customer capital. Review of Economic Studies 81, 1102–1136. https://doi.org/10.1093/restud/rdu007
Gourio, F., Rudanko, L., 2014b. Can intangible capital explain cyclical movements in the labor wedge?,
in: American Economic Review. pp. 183–188. https://doi.org/10.1257/aer.104.5.183
Harris, R., Robinson, C., 2002. The effect of foreign acquisitions on total factor productivity: Plant-Level
evidence from U.K. manufacturing, 1987–1992. Review of Economics and Statistics 84, 562–568. https://doi.org/10.1162/003465302320259556
Haskel, J., Wallis, G., 2013. Public support for innovation, intangible investment and productivity growth
in the UK market sector. Economics Letters 119, 195–198. https://doi.org/10.1016/j.econlet.2013.02.011
Chinese economy, NBER Working Paper No. 18405.
Kraemer, K., Linden, G., Dedrick, J., 2011. Capturing value in global networks: Apple’s iPad and iPhone
[WWW Document]. University of California, Irvine. URL
http://pcic.merage.uci.edu/papers/2011/Value_iPad_Iphone.pdf
Levinsohn, J., Petrin, A., 2003. Estimating production functions using inputs to control for unobservables.
Review of Economic Studies 70, 317–341. https://doi.org/10.1111/1467-937X.00246
Marrano, M.G., Haskel, J., Wallis, G., 2009. What happened to the knowledge economy? ICT, intangible
investment, and Britain’s productivity record revisited. Review of Income and Wealth.
https://doi.org/10.1111/j.1475-4991.2009.00344.x
McGrattan, E.R., Prescott, E.C., 2014. A reassessment of real business cycle theory. American Economic
Review, Papers & Proceedings 104, 177–182. https://doi.org/10.1257/aer.104.5.177
McGrattan, E.R., Prescott, E.C., 2010. Unmeasured investment and the puzzling US boom in the 1990s.
American Economic Journal: Macroeconomics 2, 88–123. https://doi.org/10.1257/mac.2.4.88 Miyagawa, T., Hisa, S., 2013. Estimates of intangible investment by industry and productivity growth in
Japan. Japanese Economic Review 64, 42–72. https://doi.org/10.1111/jere.12000
Nadiri, M., 1970. Some approaches to the theory and measurement of total factor productivity: a survey.
Journal of Economic Literature 8, 1137–1177.
Olley, B.Y.G.S., Pakes, A., 1996. The dynamics of productivity in the telecommunications equipment
industry. Econometrica 64, 1263–1297.
Tronconi, C., Marzetti, G.V., 2011. Organization capital and firm performance: Empirical evidence for
European firms. Economics Letters 112, 141–143. https://doi.org/10.1016/j.econlet.2011.04.004 van Ark, B., Hao, J.X., Corrado, C., Hulten, C., 2009. Measuring intangible capital and its contribution to
1.6
Appendix A Industry classification
Name Subgroup
1 Farming Agriculture
2 Forestry Agriculture
3 Livestock products Agriculture
4 Fisheries Agriculture
5 Agricultural services Agriculture
6 Coal mining and processing Heavy industry
7 Petroleum and natural gas extraction Heavy industry 8 Ferrous metals mining and processing Heavy industry 9 Non-ferrous metals mining and processing Heavy industry 10 Non-metal minerals mining and processing Heavy industry 11 Processing of petroleum and nuclear fuel Heavy industry
12 Processing of coke Heavy industry
13 Manufacture of chemical raw materials Heavy industry
14 Manufacture of fertilizer Heavy industry
15 Manufacture of pesticide Heavy industry
16 Manufacture of organic chemical products Heavy industry
17 Manufacture of rubber Heavy industry
18 Manufacture of plastics Heavy industry
19 Manufacture of cement and asbestos products Heavy industry 20 Manufacture of non-metallic mineral products Heavy industry
21 Iron steel products Heavy industry
22 Smelting of steel Heavy industry
23 Smelting of alloy iron Heavy industry
24 Smelting of non-ferrous metals Heavy industry 25 Processing of non-ferrous metals Heavy industry 26 Manufacture of boiler, engines and turbine Heavy industry 27 Manufacture of metalworking machines Heavy industry 28 Manufacture of other general industrial machinery Heavy industry 29 Manufacture of agriculture, forestry, animal husbandry
and fishing machinery
Heavy industry
30 Manufacture of other special industrial equipment Heavy industry 31 Manufacture of railway equipment Heavy industry
32 Manufacture of automobiles Heavy industry
33 Manufacture of ships equipment Heavy industry 34 Manufacture of other transportation equipment Heavy industry
35 Manufacture of generator Heavy industry
36 Recycling and disposal of waste Heavy industry 37 Production and distribution of electric power Heavy industry 38 Production and distribution of gas Heavy industry 39 Production and distribution of tap water Heavy industry