COMMISSION OF THE EUROPEAN COMMUNITIES 01 RECTORATE-GENERAL COMPETITION
IV/ A-3
JV/457/74- E
A STUDY OF THE EVOLUTION
OF CONCENTRATION
IN THE DANISH
PHARMACEUTICAL INDUSTRY
COMMISSION OF THE EUROPEAN COMMUNITIES
DIRECTORATE-GENERAL COMPETITION IV/ A-3
IV/457/74- E
/. I.J
/~A
STUDY OF THE EVOLUTION
OF CONCENTRATION
IN THE DANISH
.,---PREFACE
The present volume is part of a series of sectoral studies on the
evolution of concentration in the member states of the European Community.
These reports were compiled by the different national Institutes and
experts, engaged b,y the Commission to effect the study programme in
question.
Re&Qrding the specific and general interest of these reports and the responsibility taken by the Commission with regard to the European Parliament, they are published wholly in the original version.
The Commission refrains from commenting, only stating that the responsibility for the data and opinions appearing in the reports, rests solely with the Institute or the expert who is the author.
Other reports on the sectoral programme will be published by the Commission as soon as they are received.
THE DANISH PHARMACEUTICAL INDUSTRY
CONTENTS:
1.
1. 1.
1. 2.
1.3.
2. 1.
2. 2.
2. 3.
2. 4.
3.
3.1.
3.2.
4.
4. 1.
4.1.1.
4.1.2.
4.1.3.
4.1.4.
4.1.5.
4.1.6.
4.1.7.
4.1.8.
4. 2.
Introduction
Summary and Main Conclusions
Delimitations
Delimitation of Enterprises and Firms Within the Trade
Delimitation of the Final Products of the Pharmaceutical Trade
Information and Statistical .Material
Development Trends In the Trade
The Production of Pharmaceutical Products
The Pharmaceutical Industry (Trade 3194)
Danish Exports and Imports of Pharmaceutical Products
The Danish Consumption of Drugs
The Development in Concentration in the Danish Pharmaceutical Industry
The Development in Various Concentration Indices Over the Period 1968-73
An Estimate of the Development Within the Danish Pharmaceutical Industry
A
Qualitative Description of the Danish DrugIndustry
Main Structure
Production of Drugs
Wholesaling
Retailing
Hospital Dispensaries
The Danish Governmental Serum Institute and the
Danish Governmental Veterinary Serum Laboratory
Public Control
Prjces of Drugs
Advertising
The Dan.ish Pharn:aceuticai Factories
Page
1
2
6
6
8
9
10
10
10
18
24
31
31
44
50
50
50
52
52
52
52
53
53
54
4.2.1.
4.2.2.
4.2.3.
4.2.4.
4.2.5.
4.2.6.
4.2.7.
4.2.8.
4.3.
4.4.
4.5.
5.
5.1.
5.1.1.
5.1.2.
5.1.3.
5. 2.
5.3.
5.3.1.
5.3.2.
5 • 4 •
5 I 5 o
5. 6.
5. 7.
The Novo Combine
L¢vens kemiske Fabrik (Leo Pharmaceutical Products Ltd.)
H. Lundbeck og Co.
A/S Dumex
A/S 1-'errosan
A/S Alfred Benzon
A/S Grindsteclvrerket
The Connection Between the Danish and the Sweedish Pharmaceutical Industries
The Importers
The Wholesale Trade
The Pharmacies
Analyses of Product Markets
The General Competitive Situation for Pharmaceutical Preparations
The Product Development
the Competition Activities
Registration and Competion
Analyses of Product Markets
The Danish Market for Psychopharmacological Drugs
The Total Market for Psycopharmacological Drugs
Tranquilizers
The Danish Market for Antibiotics
The Danish ~1arket for Analgesics
The Danish Market for Vitamins
The Danish H:.:] rket for Contraceptive Pi 1·1 s
Page
ss
60
62
64
66 68
70
71
72
73
75
76
76
76
77
79 .
82
83
83
84 86
87
c
5.8. The Danish Market for Insulin
5.9. The Danish Market for Sulphonamides
Appendix A: Table of Symbols and explanatory notes to the tables.
Table No 1-4
Page
91
-
1-Introduction
This analysis of the Danish pharmaceutical trade has taken place
during
1974,
and it is one of a number of analyses of a similarkind which are made or have been made at the instance of the EC Commission in each member country of the Common Market in order to analyse the relationship between concentration and competition. A knowledge of this relationship is useful in connection with the administration of the provi.sions of the Rome Treaty as to competition, viz. the articles 85 to 90.
In
1974,
there have been made analyses of three trades inDen-mark:
(1) Radio and Television (ISIC Sllb-group 3731)
(2) Electric Household. Appliances (ISIC sub-group 3722)
(3) Drugs (ISIC sub-group 3194)
These trades have been selected. because they
(1) have a considerable size (2) are not monopolized
(3) do not have an atomistic structure ..
In Denmark the analyses have been made by
Professor, Haster of Economics, Th. Herbor~ Nielsen ..
Lektor, Master of Economics, Jens Vestergard and
Adju11kt, }1a.ster of Economics, Niels J0rgensen.
This analysis has been made by
Adjunkt, Master of Economics, Niels J0rgensen
Inntitute for History and Soci.al Science
University of Odense.
The analysis has been translated from Dan.ish into 2.1~nc11sh b:r:
stud. lin~. mere. 3ir~cr Andersen
T3':l....-(,~l o,n0·~ gl··o-! on ]• ~-,.-,•-;,,..-.
-2-Summary and 1:1ain Conclusions
The object of the present analysis of the D~~ish pharmaceutical
trade for the period
1968-1973
has been to describe itsstructu-ral development and to give an estimate of its development of the
near future on that basis. This has been done through a
descrip-tion of the general trends of the total Danish pharmaceutical
sec-tor, a more detailed description, quantitatively as v1ell as
quali-tatively, of the Danish pharmaceutical industry and the develop ....
ment in its concentration and through a description of the
com-petitive situation for 8 important product markets.
Section 1 is.a brief introductory section whose main purpose is
to delimit the enterprises included in the Danish pharillaceutical
industry and to delimit the final products conceived of i.n the
following exposition as pharmceutical products. This section also
states which sources have supplied information to the analysis.
Section 2 is a general section dealing with the essential
develop-ment trends. Firstly, the total production of pharmaceutical
pro-ducts in Denmark is described, and it is ascertained that it has
grov.'Ti considerably, i.e. almost doubling during the period.
Second-ly, "'lle deal with the development in the delimi tea. trade. 1?rom 1968
to 1973, there has been a vigorous increase in both t·urnover,
number of employees, as \·:ell as \vage bill, but it is pointed out
at the same time that both the wage bill and the turnover have
gro,;!n considerably more than the number of employees c The number
of enterprisee in the trade has been almost unchanged over the
per1odo Follo\,.ring these trade statements there is a. more detc..1J ed
description of the r;J.EFA-enterprises. It appears from this
descrip-tion also tl:.ai: the proouction per em.p1oyec has gro,:m consiclere.h1y.
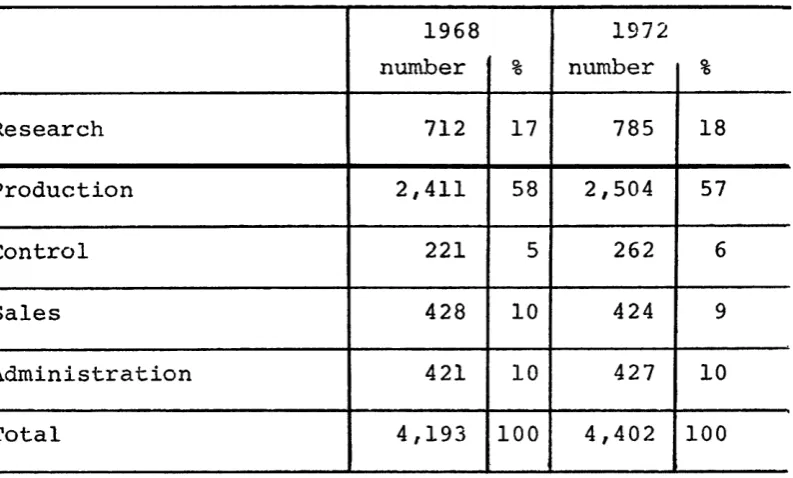
It appea.rs moreover, :from a distribution of the employees on f· .. rnc-~
ti~ons that the phar:mceutical enterprises employ an i.rnportant part
of tb.eir erllployces in researc~1 and control departments. rrhirdly,
the c.evelo1)ment in the Danish foreign tracle v;i th pharmaceutical
~
p:eod1.1cts is describedo It a1)pears from the tabulations that 1n:.ports
as v.rell g~1 ex·r_)orts have sho\'rn a vi fO:r·ous gro·v.rth where both ha.~;c-:
almost doubled, but eY:})OTts ha""~tc, hov.rever ~ exceeded ·Lw_ports to ;1~.1
-3-the largest dominance as far as imports are concerned, especially
\'lest Germany ancl UX, -v1hile Scandinavia, Sv:eden especially, is the
most important export market ')f the pharmaceutical industry. Finalr•
ly, section 2 shows the development in the Danish consumption of
medicine. v!e see also here a viborous increase, and. it appears tha-:
the gross turnover of the pharmacies has grovm by more than 50
per cent. It also appears that the main part of the medicine cons-w:::-·
ed are pharmaceutical specialities and the part "'rhich is subsidized
is very large. At the same time, hov1ever, a comparison of pr5.ces
shov1s that the prices of drugs have gro·,m less than. the average
of consumer goods.
Section 3 contains a descriution of the develournent in various
--
~-concentration measurements and an evaluation of the future develo~J-·
ment in the concentration in the Danish pharmaceutical industry.
it appears from the development in the values of the inequality
indices - the coefficient of variation, the Gini coefficient, the
Herfindahl-Hirschmann index e.nd the Entropi index - that the trade
has seen a grol;Jing inequality betvreen its enterprises, buton the
other hand that this increase has been relatively slight, The
in-crease is mainly due to the fact that the largest of the
enter-prises haveall gro\·m, vthile the small enterprises have stc:.gne .. ted.
Tr..~.us i t appears also from the various concentration ratios that
tile largest of the trade's enterprises account for a slightly
larr,-er share of both turnover as v.rell as number of employees and •,vage
bill. On the ot·hcr hand this increase is very modest. This mea.ns
in other v1orcts that i t is a shift bet1:1een the largest of the
en-terprises \'lhlch is due to the gro\·Jing ineq_ual.i ty vri thin the trade
as it expresses itself in the inequality measurements. This is
also confirmed by the Linda inc1ex values which shov1 a considerable
increase over the period.
It is also ascertainecl in this section that the Danish
pharmaceu--tical i~dustr-y is mainly Danish-o·vmed, that most of the
enterpris-es are f~'"T)ily joint stock co~p8TLiest and that it,. by and l2..rge,.
is the same c;::1ter:prises which are in the trade in 1973 tlJ.at ·were
also in tl";e trade in 1968 .. On this basis and .. on the basis of the
development trends i l l product developmen.~.:., prod"'J.ctlon costs, re ...
search costs a.n.rl ms.rketing costs \·Je ::J.1.:'.Dt conclude that a ft:;,:c-tr..er
-
4-pected in the years to come. This concentration need not nece-sarily take place in the way that Dru1ish enterprises are bought
by the large foreign combines; it may also be caused by fusions
and an integrated cooperation especially within research. We also
conclude that the share of the Danish pharmacies of the total
production will be falling until it stabilizes at a somewhat lower level.
Section
4
is a qualitative description of the Danish pharmaceuticaltrade. After a brief exposition of the existing structure with
producers, im~orters, whole-salers, pharmacies, and public
con-trol, the seven largest producers of medicine are described. The main product lines are stated, ho'" conditions as to O\Ame.rship are a.'tld which subsidiary and sales companies they have established during the years. Finally, it is stated which product groups the enterprises produce or sell apart from medicine. It appears from this description that the industry is Danish-owned, that the
in-dustry is internationally oriented, and that there is only a
limit-ed diversification - the enterprises are largely pure pharmaceutiu
cal factories. In a later section we also show the close connec-tion between the Danish and the Swedish pharmaceutical industries,
Finally, three small sub-sections indicate ~n1ich foreign
enterpris-es are represented on the Danish market and how the \·!holeS8.l.e trad.e
and the retail trade are org~~ized.
Section 5 is an analysis of a number of different product me.rkets.
\1le open, hoVTever, with a discussion of the general competitive
si.tuation for pharmaceutical preparations. It is noted that there
is a large number of product markets, w.d that the indi vitlual
pro-ducts have a relatively short existence. Therefore9 competition
takes place partly by furthering existing products, po.rtly by
la:v.nc'r:.-ing new preparations. The marketla:v.nc'r:.-ing of new products is different,
hc,,vever~ according to the degree of innovation ·whieh the prepar8. ....
tion introduced repr:esents6 The registration of pha.l:'flla.ceutical
s:~Jecia.li tiess includ1ng thc problem vri th names~ is stated as &"'1.otLe:"
aspect in the evaluation of the competitive s1 tuation in tJ~te
:i.:tl.di-vidual nroduct markets. It is ind.icated tb.8.t the phe.rmacics have
o. preferent.b. l posi tiOl1, 2.:'1d tr.c.t rest::.~ictio:r..s e.s to ne!:les :nay
have limited the nurr:oer cf suppl.ie:c-:.1 on the incl.iv-.idueJ_ :narr01H
-5-Then 8 product markets are a..11alysed: psychopharmacological drugs,
tranquilizers, antibiotics, vitamins, analgesics, contraceptive
pills, insulin and sulphon~~ides, and
CR
4
andL
4
are calculatedfor the last three years. In all product markets a minority of
suppliers are predominant, yielding a relatively high
CR
4
•
In oneindividual market there is an acutal monopoly. It is typical,
ho':T-~-~~ that different enternrises are predominant in th_e diffe~
If£9d.uct htarkets,_§_o that no single enterorise Ca.l1. be said to have
-6-1. Delimitations
1.1. Delimitation of Enterprises and Firms Within the Trade
To delimit the enterprises of the trade the same principles
as those employed by the National Bureau of Statistics at the
making up of Industriatatistik have been used. Cf. for instance
Industristatistik 1971, Statistiske IJieddelelser 197 4, 3.
This delimitation has been chosen to
be
ableto
use tothe
widest extent possible the surveys
and
results ofthe
officialindustrial statistics as a starting point and basis for
com-parisons.
Enterprises manufactu~ing drugs are delimited along the
follow-ing lines:
(1)
An enterprise is understood as a local unit exercisingan economic activity.
If
a local unit exercises severalimpor-tant
activities, and thereare
no possibilit1es of registeringany distinction of them, the activities are registered under
one unit, and the main activity forms the basis for the
class-ification of the unit in the trade.
(2) Only enterprises with at least 6 \torkers or salaried
em-pJoyees are considered industrial enterpriseso
(3) Only enterprises achieving the main part of their value
added through productive activity are considered industrial
enterprises.
(4) Only enterprises achieving the r:1ain part of their turnover
within the final products mentioned in 1.2. are included in
trade
3194 -
pharmaceutical factories.This delimitation implies that no pharmacy is included.
The ·firms of the trade are delimited along the follov:ing lines:
A
firm is understood aE a corporation aggregate exerclsingone or several economic activities in one or several local
-8-1. 2. Delimitation of the Fina·l Products of the Pharmaceutical
Trade
Final products are understood as goods or services supplied to others.
Drugs are found in chapters 29 and 30 in the Brussels
nomen-clature or in chapter 54 in the
SITC
nomenclature.The final products of the trade consist of the following main
product groups:
Vitamins and provitamins
Penicillin, st.reptomycin, tyrocidin and other antibiotics
AlKaloids of opium, cocaine, quinine and other vegetable alkaloids, their salts
and other derivatives
Hormones
Glycosides and derivatives
Organotheurapeutic glands and other or-gans and their extracts
Bacterial products, senun and vaccines Remedies
Cotton ·wool and the like impregnated or
coated with phramceutical preparations or in retail sale packages
Other pharmaceutical products Sulphonamides
SITC 541.10
541.30
541.40 541.50 541.61
541.62 541.63 541.70
541.91 54-1.99 512.86
BTN
29.38
29.44
29.42 29.39 29.41
30.01 30.02 30.03
30.04
30.05
29.36
The main group ,.,hich \'Till be treated most detailed in the
fol-lo\•Iing is BTl! 30.03 which is also called pharmaceutical
-9-1. 3. Infor!nation and Statistical ~·-'La~ erial
The Danish pharmaceutical industry has turned out to be an
extremely unapproachable trade. None of the enterprises have
p~blished their accounts before
1973
after which date it isprescribed by the lav1 to do so, and only a few small enter-prises
have been prepared to fill in the questionnaires submitted to
them.
In
return some importers of drugs and sales companieshave supulied some information. Therefore, the analysis is
based to a '"ide extent on information and statistical material
from other sources than the actual enterprises.
To a wide extent, section 2 is based on statistical material
from the publications of the national Bureau of Statistics:
I~dustristatistik (Industrial Statistics)
Produ~:tionsstatisti 1.<: (FroO.uctlo.n Statistics)
Import- og eksportstatistik (Import a.lld Export Statistics)
and from the publications published by the trade associations
lv1EFA and the Danish Pharmaceutical Chemists' Assoc1ation.
Section 3 is based on information from
Aktiesels1cabsregistret (The Danish Register of Comp&""lies) Industristatistikken (Industrial Statistics)
Greens dal1ske fonds og a1<:tier (Green's Dantsh Stocks and Shares)
J:om-pas Tianmar~\:
The 50() larr;est enterpr:ises in Denmark
Submitted questionnaires ru1d
Intervie,:rs v.ri th trade ex~)erts and managers.
A~art from the above-mentioned, section 4 is based en infor~ation
from 71ublished renorts in Denmar':: ana S1!:edr:!n as to st:rpply of
drugs and announ.cements from the r.~onouolies Authorities plus a
publication published b:y I,1EFA in 1973: 40 ::tears with drugs.
The ?...nalyscs in section 5 are based. on the turnover figures
from selected Danish pharmacies and. on information from the
-
10-2. Develonment Trends In the Trade
2.1. The Production of Pharr;:aceutical Products
Table 2.1. shows the total Danish production of pharmaceutical
products for the period 1968 to 1973. Pharmaceutical products
are understood as -pharmaceutical specialities and bulk goods
as delimited in section 1.2.
The table includes the ~reduction of this type of products for
the total Danish industry whether the enternrises in question
are classified under trade 3194 or not.
The products are stated in prices ex factory, and during the neriod these prices have risen only slightly. It appears from the table that the production has almost doubled during the
-period and that the main -part of the production are manufactured
goods - pharmaceutical specialities. ~~he producti.on of drugs
of the Danish pharmacies is not i:cluded in the figures.
2.2. The Pharmaceutical InduRtrv (Trade 3194)
Table 2. 2; sho;.rs the development in the Danish pharmaceutical
industry du:ring the period 1968-73. The number of cnte:r:pl:ises
is almost uncha_n_ged, and it is also to a wide extent the same
enterprises \vhidh existed in 1963 that are in the trade to-day.
Furthermore, the enterprises have almost the same relative
sizes to-day as in 1968. The largest enterprises are all
mem-bers of the trade association I·'tE}"'A, and these enterprises \·!ill
be described in detail in the following.
The total turnover, incJ,J.ding about 15 per cent trade turnover,
has alcost trebled during tl1e ':}eriod, vrhile the number of
em-nloyees has only [~I'O'\·.m from 3,126 to 6, 020. In other words, the
tul·n')Ver per emnloyee has gro\·:'11 considerably as it also a:Y~ears
fi·o::rl the table.
The to-~al \·:age bill, bo~.-.rever, has more thar1 trebled d1.1.ring
the 6 years. This development is a result partly of a
vigorous-}~' increasing Vla..';;e lev(;]_ in Dcn112.rk e;enera1ly and partly of the
-11-employees -..·:hose salaries have grov.rn more than the average wages.
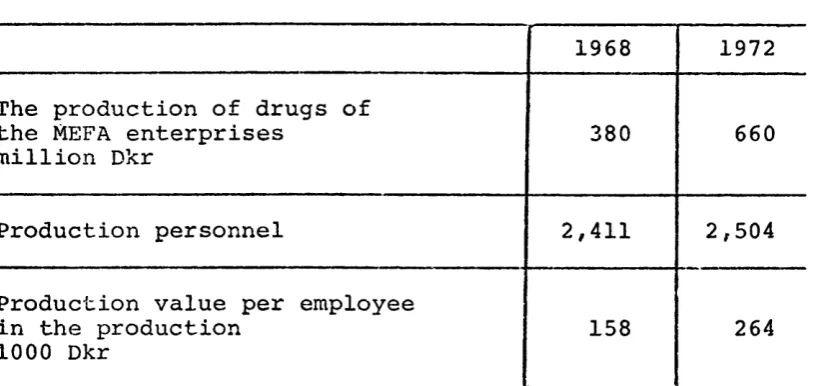
If \·:e look at the l\IEFA enterprises alone, table 2. 3. also
illu-strates the increased productivity in the trade and by its group-ing of the employees table 2.4. illustrates the fact that a
very substantial part of those employed are salaried emplpyees.
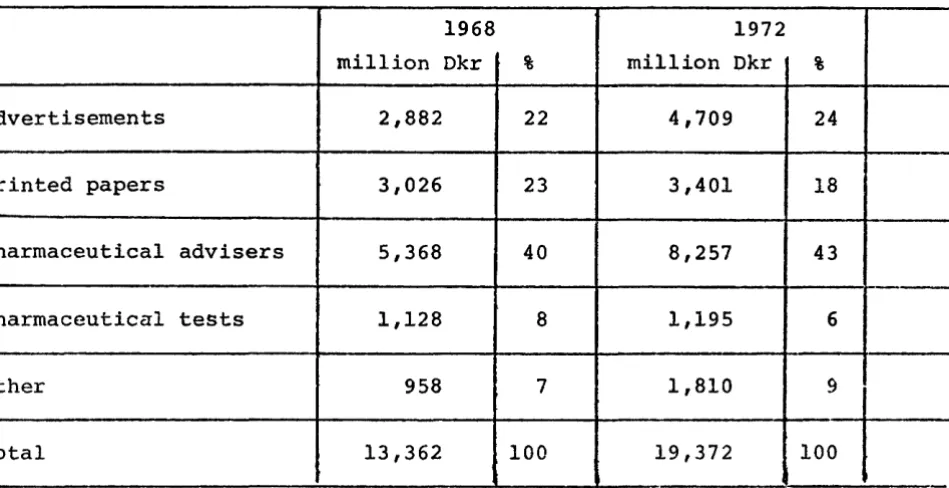
Finally, tables 2. 5. and 2. 6. shoHs the development 1n tv:o of
the most disputed cost i terns. Table 2. 5. sho\·rs a substantial
increase in the
HEFA
enterprises' costs to public relation andTable
2.1~
The
Danish
Production
of
Pharmaceutical
Products
(million
Dkr).
1968
1969
1970
1971
1972
1973
Total
production
471
528
592
657
735
827
Bulk
produc·i:s
of
this
109
118
148
154
141
178
~
Source:
Product
statistics
from
the
National
Bureau
of
Table
2.2.
Development
In
the
Pharmaceutical
Trade
1968-73.
1968
1969
1970
l97lx)
to
1972
1973
Number
of
enterprises
24
25
28
29
27
27
Total
turnover
425
494
573
862
973
1170
million
Dkr
Number
of
employees
3,126
I
3,556
I
3,3395,284
5,672
6,020
Turnover
per
employee
134
139
171
163
172
194
1000
Dkr
Total
\,;age
bill
104
117
129
253
301
358
million
Dkr
I
Source:
The
National
Bureau
of
Statistics:
Industristatistik
and
own
calcuaLtions.
x)
The
vigorous
increase
in
1971
is
mainly
due
to
the
fact
that
Novo
is
now
c1ass-fied
in
the
trade.
-
14-Table 2.3. The Production of Drugs of the MEFA Enterprises 1968
and 1972.
1968 1972
The production of drugs of
the MEFA enterprises 380 660
million Dkr
Production personnel 2,411 2,504
Production value per employee
in the production 158 264
1000 Dkr
[image:25.559.56.465.136.329.2]-
15-Table 2.4. The Personnel of the MEFA Enterprises 1968 and 1972
1968 1972
number % number %
Research 712 17 785 18
Production 2,411 58 2,504 57
Control 221 5 262 6
Sales 428 10 424 9
Administration 421 10 427 10
Total 4,193 100 4,402 100
[image:26.557.61.458.129.368.2]-
16-Table 2.5. Direct Costs to Public Relation and Advertising of the
MEFA Enterprises 1968 and 1972.
1968 1972
million Dkr % million Dkr %
Advertisements 2,882 22 4,709 24
Printed papers 3,026 23 3,401 18
Pharmaceutical advisers 5,368 40 8,257 43
Pharmaceutical tests 1,128 8 1,195 6
Other 958 7 1,810
lOt-Total 13,362 100 19,372
Table 2.6. Research and Development Costs of the MEFA Enterprises
1968 and 1972
-·--·---1968 1972
Research costs
45 65
million Dkr
[image:27.559.60.535.135.379.2]-
17-Table 2.7. shows Denmark's imports of pharmaceutical products
distributed on EC member countries for the period. Here, the
EC
countries account for a substantially larger share thanexports do. In
1973
almost50
per cent of the imports came fromthe enlarged Common Market.
Also with respect to imports are
vi
est Germany and UK Denmark'smost important trading partners within the
EC
with exports toDenmark in
1973
of92
and76
milll.on Dkr, respectively. Itappears from the table, furthermore, that the exports to
Den-mark forthe other countries within the EC have stagnated.
Outside the EC, Switzerland, USA, and Svreden are important
exporting countries.
If table 2.7. is compared to figure 2.1. it appears that the
'
growth in imports is based mainly on bulk products, while
im-ports of pharmaceutical se-pcialities are stagnant ..
The growth in both imports as well as exports illustrates the internationali?.ation that has taken place in the Danish
pharma-ceutical industry as a consequence of a pronounced
-
18-2.3. Danish Exnorts and Im~orts of Pharmaceutical Products.
The Danish pharmaceutical industry is a pronounced exporting
industry. If we compare table 2.8. which shows Danish exports
of pharmaceutical products distributed on EC countries for
the period, with table 2.1. which shows the total Danish pro-duction of these products, it appears that an ever larger share of this production is exported.
It appears from table 2. 8. , furthermore, that the enlarged. EC
takes a substantial part of these exports, but that the share, however, amounted to about 28 per cent only in 1973.
In contrast, figure 2.2. clearly illustrates where the most important markets of the Danish pharmaceutical industry are situated - viz&· in Scandinavia. In 1973 the exports to Sweden, Nor\vay B.nd Finland totalled 191 mi1lion Dkr or almost as much
as total exports to the enlarged EC. Apart from EC, USA, Spain,
and S\·Ti tzerland are large recipient countries.
With
69
million Dkr West Germany is by far the largestreci-pient country of the EC countries followed by UK with 36
mil-lion Dkr. As a whole the exports to the individual EC countries have grown steadily during the period.
The rest of the exports is distributed on a large number of
countries both in the rest of Europe as well as Asia, Americas
and Africa vThich also appears from figure 2. 2.
Table
2.9.
shows the distribution of exports on groups ofpre-parations. lJ.'he group penicillin and other antibiotics is clear-~
ly the most importru1t, but it must be noted that the exports of insulin totalling 103 million Dkr make Denmark the wor1d's largest exporter of this product.
Figure 2 .1. shovs, among other things, the exports of
phe.rma-cutical specialities which amounted to about 42~5 million Dkr
in 1973. If th1s figu:ee is compared with the figu.res in table
2.2. for total exports, it appears that the share of bulk
Table
2.7.
Danish
Imports
of
Pharmaceutical
Products
Distributed
On
Countries
For
the
Period
1968-1973
(million
Dkr).
1968
1969
1970
1971
1972
1973
Belgit::.m
-Luxemburg
8
8
10
10
11
10
France
-Monaco
4
4
5
6
7
8
The
Netherlands
21
23
24
28
20
24
r·taly
I
7
10
10
14
10
11
~·Jest
Gerrnany
37
48
70
79
75
92
Original
EC-countries
77
93
119
137
123
145
Eire
1
-1
-UK
34
36
38
55
41
76
- Present
EC-ccuntries
112
129
158
192
164
221
Other
countries
144
.171
197
192
208
235
Total
imports
256
300
355
384
372
456
S.ource:
Danmu.rks
Vareindf¢rsel
og
Vareudf¢rsel.
J
--..c I
Table
2.8.
Danish
Exports
of
Pharmaceutical
Products
Distributed
On
Countries
For
the
Period
1968-1973
(million
Dkr).
I
1968
1969
1970
1971
1972
1973
Belgium
-Luxemburg
I
7
9
9
12
12
13
France
-Monaco
13
13
13
16
15
25
-
T.}1cNethe!:'J.ands
13
I
18
22
26
27
30
.
It2iy
4
8
12
14
10
17
West
Germany
34
36
48
49
55
69
-
OriginalEC-countries
71
84
104
117
119
154
-·--· Eire
3
4
5
4
6
10
UK
17
21
28
25
22
36
Present
EC-countries
91
109
137
146
147
200
Other
countries
285
312
376
413
437
521
-
Totalexports
376
421
I
513
559
584
721
Source:
Danmarks
Vareindf¢rsel
og
Vareudf¢rsel.
Figure
2.1.
Imports
and
exports
of
pharm~ceutica1
specialities
1930-1973.
425 400 375 350 325 300 275 250 225 200 175 150 125 100 75 50 25
0
I I
t-
F
.1930
7
~
-
----I'
-T
1940
1950
/
Jf""
I
-I
-7
~
I
/-I
/
/
/
/,
-7
/
/~
/
____.;
-.
1960.
'
1970
71
/f;f!
xports
/
./
/
rnports
~~: ·-
·-
'
72
73
Source:
Statistical
material
from
the
National
Bureau
of
-
22-Figure 2.2. Danish Exports of Pharmaceutical Products in 1973.
72
12
I:Ij ~
~ (/}
t1 1-'·
0 SlJ
"0 CD
82
69
43
~0
36
Ul ~
z
hj G):e; CD 0 1-'· ti
(i) til ti ~
p. rT ~ 1-'
CD SlJ SlJ tJj
~ (j) ~ ~ li
CD 0.. f-l·
t1 rT
s
SlJPJ 1-'·
~ ~
~
Distributio continents
10
6
J
r;
~H\
co f1
[image:33.557.78.502.95.827.2]11 ...
... n
0 SlJ
SlJ
n of exports on
(per cent)
Total Danish exports of drug the 10 largest recipient cou in 1973 (million Dkr)
34
30
25
23
lb
c: 1-3 ~-:~
J (/) (/)
en ::> ... li "0 :e;
~ (O PJ Sli ...
:::1 ... rt
z 0 ~ N
{i) CD co
rt f1
:J ...
CD SlJ
ti ., ::s
f-l ~
PJ
:-J
0..
m
-
23-Table 2.9. Danish Exports of Pharmaceutical Products in 1973 Distri-buted On Groups of Preparations.
Groups of preparations million Dkr
Penicillin and other antibiotics 218
Insulin 103
Vitamin and vitamin preparations 87
Sulphonamides 52
Psychopharmacological drugs 51
-Otl;ler 210
~
Total 721
[image:34.561.20.539.136.424.2]-
24-2.4. '!'he Danish Consumption of Drugs.
The pharmacies are the retail outlet for drugs, cf. section
4.
In 1972 there were 348 pharmacies in Denmark which have a num-ber of chemist's shops attached to them. It appears from table 2.10. that the number of pharmacies has been slightly falling during the period under consideration. The gross turnover of the parmacies, however, has gro\vn during the same period by
more than 50 ~per cent from 617 million Dkr in 1968 to 962
mil-lion Dkr in
1972.
In1973
the gross turnover of the pharmaciesreached 1,016 million Dkr exclusive of V.A.T.
Most drugs for human consumption are prescribed by doctors in a prescription, the recipient then fetching his goods at the
pharmacy. It also appears from table 2.10. that about
i
of theturnover of the pharmacies is turnover deriving from prescrip-tions. Table 2.11. shows the distribution in per cent of pre-scriptions on pharmceutical specialities and on other drugs, i.e. drugs manufactured by the pharmacies. It will be seen that the share of pharmaceutical drugs has been steadily gro\'!ing during
the whole period both as to nw~ber as well as to amount.
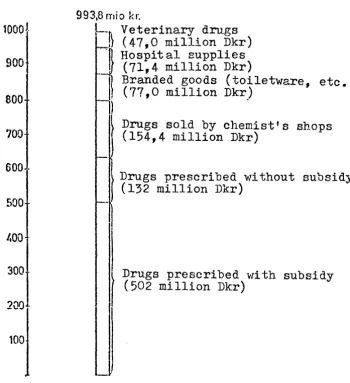
It appears from figure 2.4. that the turnover of the Danish
pharmacies totalled
993,8
million Dkr inclusive of V.A.T. in1971 .. Drugs prescribedaccountcd for635 million Dkr and of these
502 million Dkr were entitled to subsidies. To arrive at the total annual expenditure on drugs for human consumption it is necessary to further add the hospital supplies of 71,4 million
Dkr and the drugs sold by the chemist's shops totalling lf4,4
million Dkr. The hospital dispensariest !'lowever, make purchases of drugs directly from producers and importers and hav-e a
pro-duction of their O\·:n. This turnover is estimated to be tv:ice
as lare;e as the pharmacies' sales to the hos-pitals. If th.ese
items are added i t apnears that in 1971 the total consumption
of drue;-s for human consum::-~tion totalled about 1,000 million
-
25-~ith the purpose of analysing the consumption of drugs in
Den-mark in connection with a revision of the system of subsidies
to drugs the prescriptions received by every pharmacy during
one day at the end of
1971
v:ere analysed. By dividing thepre-parations prescribed in therapeutic groups it turned out that
the distribution of the consumption in Denmark in
1971
was asillustrated by figure
2.5.
The hatchings indicate thesubsi-dized nart of the turnover.
In 1971
the subsidies to that partof the drugs which were entitled to subsidies amounted to 75
per cent. Thus, the public expenditure in
1971
to drugsen-titled to subsidies totalled
i
of 502 million Dkr=
375 millionDkr.
Figure
2.3.
shows the development in prices of some importantDanish-produced preparations. If these prices are compared
to the retail price index for the same period it appears that
while the consumer price index grew by about
25
per cent, theprices of these preparations grew by an average of 10 per cent
Table
2.10.
Total
Turnover
and
Turnover
Deriving
From
Prescriptions
of
the
Danish
Phar-macies
During
the
Period
1968-72.
1968
1969
_1970
1971
1972
Number
of
pharmacies
353
353
352
349
348
Gross
turnover
617
687
747
844
962
million
Dkr
l
Of
this
sales
deriving
from
prescriptions
451
510
563
642
736
million
Dkr
I
Source:
Unders¢gelser
over
Apotekernes
Driftsforhold,
nr.
XXXVII,
Apotekerfonden
1973.
The
figures
are
stated
exclusive
of
Table
2.11.
Prescriptions
to
Individual
Persons.
Distribution
In
per
cent.
1968
1969
1970
1971
1972
!" [
Pharmaceutical
specialities
67.9
68.9
70.3
71.4
72.4
\
Number~
~
l
Other
32.1
31.1
29.7
28.6
27.6
J
Pharmaceutical
specialities
82.2
82.2
83~9
84.7
85.5
Amount)
.,_
17.8
17.2
16.1
15.3
14.5
l
0
,_her
Source:
Unders¢gelser
over
Apotekernes
Driftsforhold,
nr.
XXXVII.
Published
by
Apotekerfonden
-
28-Figure 2.3. Some prices of drugs in relation to retail price index
during the period 1969-1973.
180
170
160
150
140
130
1969
Retail price index
1964=
1001970 1971 1972 1973
The 8 most sold Dan~sh-produced preparations 1973. Consumer price inclusive of V.A.T.
110
100 ..
90
80
70.
60 .
1969
.---~ Abalgin retard 100 pieces
Dopamet 100 pieces
Confortid 25 mg 100 pieces
[image:39.561.52.490.383.743.2]-
29-Figure 2.4. The turnover of the pharmacies inclusive of
V~A.T. 1971-.
10001
900
800
700
600-500
1.00 .
300.
200
100
993.8 rnio kr.
~- Veterinary drugs
~
(47,0
millidn Dkr)··] Hospital supplies
(71,4
million Dkr)I
)
_} (7?,0
Branded goods ( toiletware, etc.) millionDkr)
l
.
l}. Drugs sold by chemist's shops
1
(154,4
million Dkr)~
Drugs prescribed without subsidy) (132 million Dkr)
} Drugs prescribed ·with subsidy
I
(502 million Dkr) [image:40.561.130.481.159.542.2]--A
f',)
w
.r.-.
(~) 0 0 r-,_
-/
_.,.
... ~ .__!, ._.-...!' ....
-: r1
CJ) -·~
•J
().)
(f) 0
-·' j,.)
C)
C"J
C)
r-"'1 ...
c:_,
r
---. _.-~ ...
C)
(_")
Endocrine diseases
Central nervous system
Autonomic nervous system
Analgesics
Skin and
mucosa
Others
-Of:-Psychopharma cological drugs
1-xj
...
~ ~
CD
N •
\.11
c+
§
!:5 Cl) ~r= {.\)
{l> 'd
1--' Cl)
r=
c+ c+
~ 1-'·
~ 0
::;
0 OQ
< ~
<V 0
~ ~
t-el
1-'· (I)
::;
1-J s ... \.0
-..J
1--' 1--'
1--' •
1-'·
0
~
t::t
~ ~ :e:
I-'•
rr
::Y 1-'·
~
c+
:s
ro
~
!).)
ti
1-J· 0
~
-
31-3. ~rhe Develonment In Concentration In the Danish Pharmaceutlcal
Indust~J.
3.1.
The DevelopmentIn
Various Concentration Indices Over thePeriod
1968-73.
Section 2.2. gave a description of the Danish pharmaceutical i~du
stry for the period
1968-1973.
This section will furtherillustra-te this development by means of a number of concentration
measure-ments, each of which deal with different aspects of industrial concentration.
These concentration measurements give an idea of the distribution
of size of the enterprises included in the trade~ as we assume
that size is a reasonably good indicator for the position or power
of an enterprise. We can disting·v.ish between measurements of
an-solute concentration and :i,nequality measurements. The former is
a measurement of e.g. the part of the total turnover referable
to a small number of large enterprises, while the latter is 2.
measurement for that percentage of the total nu.lnber of entcr):'rir5es
in the trade controlling a certain percentage cf e.g. the total
turnover.
~his a.nalysis ap-plies 4 measureme::nts for j_:r.(;quali t~:r: the coc
ff:i-cif~nt of variation, the Gini coefficient, the
Herfj_ndahl-Elrsch-mann index a~d the Entropi index, v.rhile t 1:.:o measurements concern
absolute concentration, vlz. tl'.te coneentration ratio and trH.;
Lin-da index.
In appendix A there is a more detailed expl8-LYJ.ation of the indi
vi-dual concentration measurements. The 2ppcndix contains also the
main tables for the respective indices.
Ineoulitv ~e~surements
______ .... _,... ___ ... *_...~-.... -~---..-.. -
-The c o e ff j_ c i c r: t of v a r i 21. t i O!.&_ is a me a S'!J rc 7 P r: t for the re 1 at i Y e
-
....~---~---~~--·~---~--spreading of t~1e various variables aB .it is the sta-n.da:rd de-..,r1e.tio:c
divided by tbe mean VG.lue. This rna];:es i·t. alsv a ffiea.Ru::rcm.ent fo:t"' t}ls
inequality within the trade. The smaller tbe coefficient of
-
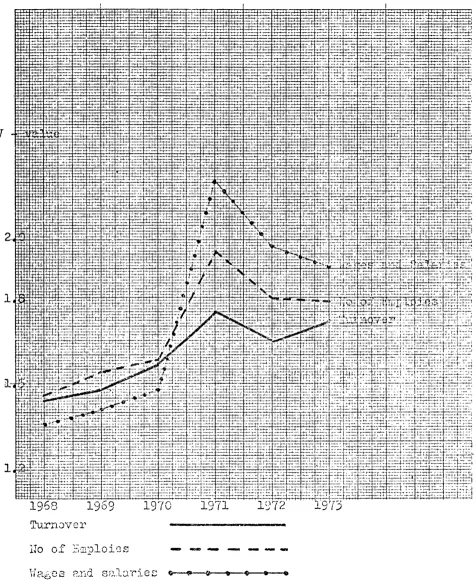
32-The development in the coefficient of variation for the three
variables is shown in figure
3.1.
For all three variables, thecoefficient of variation has been increasing at first, then slight--· ly falling. This somewhat growing inequality in the trade is an
indication of the fact that the largest enterprises have gro~1
larger, while the small enterprises have stagnated. The vigorous
increase in
1971
is mainly imputable to the fact that Novo isclassified under the pharmaceutical industry that year. The
strong-er increase in the variable '-v1ages and salaries' may probably be
explained by the fact that only the largest enterpriseshave
defi-nite research departments with highly salaried staffs and that
the shares of wages and salaries of the largest enterprises, there-fore, have groJNn in relation to those of the small enterprises.
The Gini coefficient is also a measurement for spreading. It is
a measurement of the degree of unequa.l sizes of the enterprises
of the trade. If the Gini coefficient is 0, it means that all the enterprises of the trade are equal as to size. It gives no
indication, however, \•Thether there are 20 or 200 enterprises in
the trade. The Gini coefficient is a sunming up of the
informa-tion conveyed by the Lorenz cu1~e.
The development of the Gini coefficient for the three variables
is sho\-m
ln
figure3.2.
Like the coeffj_cient of variation, theOini coefficient also sho;·Js a gro·v1ing j_nequali ty over the period. Here, too, the addition of a large enterprise means that the
co-efficient jumps to a higher level \iherc it stabilizes. Apart from
that there has been a moderate increase in inequality.
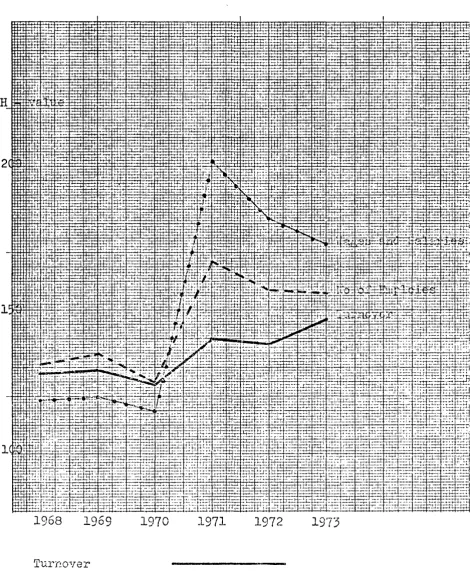
The Herfinoahl-Hirsc"h.mann index is a concentration measurement
which takes into consideration both the nu..vnber of enterprises l.n
a trade and. the inequality of si.ze between them. Other things
being eq·ual, a larger number of enterprises in the trade &J.d/or
a larger equality will diminish the index value. As data ·bo·t;h about
inequality c.nd number are combined, a comparison of the vari.ous index values i.s most lilcely to make sense, when the number in the
trade, as ~ere, is fairly constant.
IrreGpective of the n1J::aber of enterprisss in tlie trade, the index
value will approach 1000 when the largest enterprise' r:; shn:r·e of
-
33-will be reached when all enterprises are of the same size, and this limit varies with the number of enterprises.
The development in the index values for the Danish pharmaceutical
industrJ is given in figure
3.3.
The development is largely thesame as for the previous two indices.
The Entro:Qi index i.s the fourth inequality measurement, and the measurement that attaches most importance to the small
enterpris-es. As it will appear from figure
3.4.
the values have beenfair-ly stable over the period.
Concentration Measurements
The concentration ratio and the J,inda -index belong together.
Whereas the concentration ratio gives a simple exposition of the paucity of a trades thus giving an idea whether it is clearly
do-minated by a small group of enterprises, the Linda index measures
the relatlve sizes of the enterprises for which the concentrr:...tion ratio has been calculated.
The concentration ratio is obtained from the concentraticn curve
of the trade .. This curve is dravrn in a system of coordinates, v{here
the absclssa axis indicates the number of enterprises - from the
largest to the smallest - while the ordinate a:x:is indicate the
cumulated percentage of the variable for the number ofenterpTise[-;
plotted on the abscissa axis. The hcdGht of the curve above any
point x on the abscissa axis measui·es the percentage of the total
size of the trade accounted for by the x largest enterurises- i.e.
the concentration ratio.
For the Danish pharmaceutical in.dtJ.stry, the curve is vigorousl:t
rising from left to right, i1.1 us indicating a fairly conce~1tra:tcd
trade. This appears from fiGUres 3.5" to 3.7. It aJ.so appe2.rs tl;.at
the concentration curves have shovrn o.lmost no shifts for the .ll,}D::·ce
variabler~ over the period.
As men-cioned, the J.,inda inc1cx. is a mcasu.:ee~uent for the inequality
-
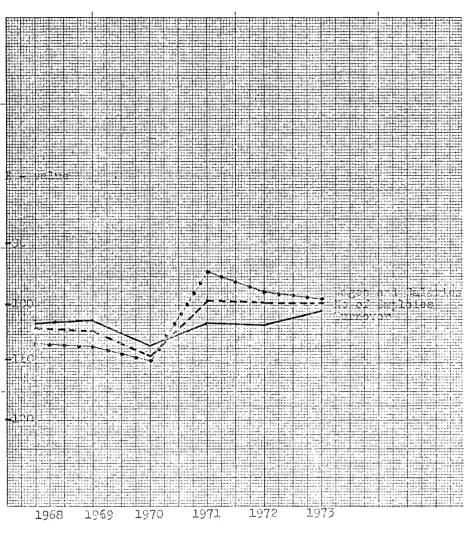
34-three variables is sho\vn in fi~~re
3.8.
At firstf it is slightlyincreasing and then it jumps to a higher level, again as a con-sequence of the fact that Novo enters the trade. In contrast, there are slight differences as to for which spot tests the Linda i.n-dex assumes its minimum value, but here, in return, the fluctua-tions are not so pronounced as for the maximum values. The
deve-lopment i~ the minimum values for the three variables is sbo\m.
-
35-Figure 3.1 Development in Variation Coefficient
v
Tu.rnover
[image:46.557.36.512.116.697.2]---~
...
....-=='
1-3
1-;&:j
...
--:
p:J
0
~~
...
Gq
~
~
m
0
... ...
m
!-!;,
() ~
(1)
Sl'
tx-1
(1)
,_._.
i3
~
\>.1
,.J p_,
•c:
•
:_:
1'\)
C'2
0
p
t-J·
d
f...l
(('
p
{12
<t>
i-1
<
!..J·
~_J
CD
C:J
\..0
...
m
-...J
0
0
.. d a CD :::s c+ 1-'• l:$ c+ P" CD
~ 0\
I
Q
I
I
1-'·
I
H
2
-
37-Figure
3.3
Development en the Herfindahl-Hirschmann Index··~
"
f,h
l:j:t;i: ~ i-'-• ~i;. -:_~.
t±tl.:!: ~:i;!~::-:-:!~-~rl:::
1968
1969
'!
. J
t+-• .... t'-7"'
- .,--f-:-~-~-: 1·-' ~ t-·---1- .... ~ ~-' ,_ ... +
.;_1---·~--., ~- t-'-~H! ~:.·:; ~:.:_-
e;+-~·l·-: -·
t·-'-i-1970
1971
No of Emploies
·~-..
~· '
'! ··'-'- ··---:-:.::;:~.'I~ :~-~
_;. i-~-'
1972
1973
[image:48.558.43.513.94.665.2]
-38-Figure
3.4
Development in the Entropy Index, ... -,... ~ .
[image:49.558.49.514.105.649.2]-
39-Figure 3.5
The Concentration Curve: lurnover
--LOO i
·- ,_,__ - ::=-~--· 'I
'•· ,_-~::--=~::~- i
I
80
·~r • -r+ ,,....:_ -~-~ ~-~ :-"-# ;;..,' -1
:"-:-1::':::-. ----,
f-.-'-· I·
---1·-·- · - .. ---t-:- I
'-:~ ·:"- ,.,.
·:---··-'-r---+----·
'·-;. ":• 1·+. - '
~r---. ~ "'-:
60 II f
l11:;:
'-~ ...
40 I·-- .. ,..·--~~;-'
-· :·-- 'cc; ·:-::-cc::-:·c_
I
'~·-·
I - -- I :c.-·:::: . .:-::··
~~ - -~
, . ...,.. ,: -· 'cc , . .,. .... '-· c -,:: -::::~b=:-j--1
20 ,,... ~- =~ ::' ~F::t~,:P,_;__: f_!~ :c. ·~: i,.r: ::•.,... •;:; .,.;-:c -::; _;:";!;;· r1·~c-!--:: __ ~!.:_ :~=-- .• :j.,:--"-:
·'-;
,,..~f-C4 --- --t-· -,-:-;- .,.,. h-,·
l:: c:r;' F;-~.r =~.;::!.-·1 +- '..;..:..
,.:;-·,;-~~_, -~ tn :;-!- ;~~ :1:;!,_:::-;~~~~i~;)f£ fT I:-: :;:-:-;·--;:: ~~~~-:
•. ::·--r-.,-- IT •~r~ . ~-~---~~=: .. ~~ , .. , .. ~,:_ ··-·-·:t:
. . . L. f~'-:- ..--- ·-· ,_,_ . r::r;-: .. ~~=; _ _t_ --· -=·+-- ·=-;::::-.'
·1·-' +~_;_....,-:--!-t;-'- •• ~ ,_ ·:1"~' '·' "G+•t ·-:-:: ,.,. .. ,. -~~t:t:. ~~:::~ i's.::r.:-;r ~:.! ::::.t.;;-~==1 1
;;•-·-fr' ·"~·'7•··;
~T
;·.1·'-0
" n :1::-~ +_;_:~~;-±.:.::l:r-• ft' f+-'· ~::.::i::-::L:::t--:: --~~~; ~-· t·:·- ::-: • .,.. •• :...;
~~ '+'+H·:-H- , , 20 =,r:;
J.L,
1968
[image:50.564.39.532.134.450.2]
40-Figure 3.6
The Concentration Curve: No of Emploies
LOO
K!
6
'·1.
··'-•
A. ,_,~
i
: :<.I
C::\
,.~
0 4 8 10 12
1968
1973
--·
-·--'·+-·
' ..
--:~~:
r: -'---;~
.;
-1. -~ ... 1--~-.~·
• -r··""'·-+Tr· ~.::.t:,~-:
~ -k•· .~. c---+--'~i
·--t
'·- '"';l
_.::t:.~::i
. -··
I •-'-c-~ f.· • ~~ l~.:::
r:::::-1-<--~~r;-~ . c.
; _:_~
;;.,... __ , ___ _
[image:51.564.35.527.147.533.2]80
60
40
20
·-.
, ..
!f·
'"
-
41-Figure 3.7
The Concentration Curve: \·!ages and Salaries
:r_;_
• (..!
4
1968 197:5
~. r1:;2- 1-;.
,.
,:..:i.
... :~
i->1 cr
'~~ d..,.;
-4+
·-•," ·'·
rr. .,... .• ,
1--'~ ~-~:
·•~-'-·
;:1:
...
'H+· '~~
leo
-:-,_,
.,-•:-
··-·----.:;:f;:f ;-:::0
[image:52.563.37.527.159.553.2]h-~ ~: ~~:::
...
:._--:-• fiCT
~-l.Jd:~~ i··
. ...,
..
--.:.:::~~, 'r~·:::c;_
... :..
~ ---· ,.... ..• ,....
~-- -~.:. .
~ ~~~-~§
f-;~ IH-HI•t ;~:f~:if!..!:::-.. ;;" ;i~t::!:f ;·t: .c_; r·~,:.:_:; lc, ~:_;:; ::~. ~~
•~, !•C • --· 1;.., --~. :· ! rc '"'-c 7-'- ;'-··
d- cCI l:j'it lT"I:-:t~:j_ Lt{;.~jJf'~!r·+;@~f-t·;·~i:·tfEtt~}~~~:t_c ~ffij·~~Ef;.~J~>r, fic-.t;:.tf]~~.:-::.C~';:
.,.J. <!'f:?f;~:!~ H;P~;_:r=~r~~-- _;". :::,=~:' ::~· ~Y·:~~i?
~~~~ 4·!~.~ ~· .:··~~~~
I~~- i~l-- :t_~ .6~;.;:
~· r!·• ;:~~-Z
Figure
3.8
Developr:H~nt
Turnover
o.
o.
-
43-Figure
3.9
Development in the Lindaindex: r;Tinimum value
If-;:t:;ft
• ::t~-~
:-trhft :f-h_-t
! i. ti , .
,·r;.J::r~:
.)i_r~·r-r,._ ·[h
,-r+ 'l.L
~·~:-
i;:-:, ,_, !-' ~Ti1
~h ,_,_
1+--+ :i-'
rr.. t'
1'-1·-.
-~1 ~'
19 8
Turl1ovcr
·:--l-
,1-•-• ,1-•-•-••r~-'-1 ~-,
",_··--'+->-'" r;-h
fi-; l-1!'1
i" ~; __ - • i+: "
rH-•
1970
19'7l 19721973
[image:54.561.38.517.161.591.2]
-44-~.2. An Estimate of the Development 1vithin the DP..nish
Phar-maceutical Industry
For several reasons the production of drugs must be assumed to be suitable for Denmark:
(1) The country has an educational level which makes it possible
for a pharmaceutical industry to recruit a sufficient qualified
personnel.
(2) The country has a well-established pharmaceutical
statistl-cal material and. a developed hospital service.
(3) As far as weight and quantity are concerned, the
corH:sump-tion of raw materials is modest.
The negative factor is that Denmark is a small national market
area whose dema.r1d is not alone R-ble to support an independent
pharmaceutical research.
The Danish pharmaceutical industry as delimited by the
Natio-nal Bureau of Statistics consits of a small number of
rela-tively large enterprises and a large number of small
enter-prises.
The total number of enterprises has not changed very much
during the last 6 years, a.nd the structure has not changed
either. It can also be ascertained that tbe largest Danish
pharmaceutical factories are the same as those \·lhich have
been prec1ominant c:iuring the last 15 to 20 years. Tlrns, the
concentration has increased, because t}le largest enterprises
have experienced a substantial gro~.-:th, vihile the mediu:-:1-sj_z:ed
and small enterprises are still at the srune level.
The main part of the Danish pharmaceutical industry has always
been on Danish hands, and most Danish enterprises are still
managed by descend.:mtfJ of the original ovn.1ers.
The grov1th in the pharmaceutical industry is ma.:tnly ::: result
of the utilization of the lat8st advr1.:nces \>'i th.i.n the
pharma-ceutical :research: antibiotics, psychopha:r.Yuaco1og1ca1 drues
D.nd ora.l contracepti'v8s .. In acldj_tion 9 De:r.naar1;:: r.:.as a special
-pre-- pre--
45-aence of a great number of pigs within a relatively small geo-graphical area and a vigorously growing need for vitamins.
By and large the latest pharmaceutical advances are utilized
by now, however, i.e. there is actually nothing new about the preparations appearing within the fields in question.
Because of that, the problems faced by the producers have assum-ed another character:
(1) The research must be applied to other than the usual fjelds.
(2) The marketing becomes more important.
(3) Advantages as to production may become decisive.
During recent years, the Danish pharmaceutical factories have made fairly good profits. It must be expected, however, that
~hese profits will be reduced in the years to come, because:
(1) There has been no new category of drugs d.uring recent years
to replace antibiotics, psychopharmacological drugs and oral
contraceptives, and i.t must be expected that remedies against
cancer and colds "'ill be long in coming.
(2) Higher research costs have reduced the speed of
appearan-ces of new drugs.
(3) It must be assumed that the prices of drugs will be
sub-jected to an increased supervision partly from the National
Health Service and partly by the Honopolies Authorities
posRib-ly taking over the price control. A changed system of subsidies for medicine with the consequence of highe:r expenses for the
consumers may clamp do·i,n the consumption of certain categories
of drugs.
(4) Endeavours of the enterprises towards diversification will
contril1ute to the equalizing of p:eofi ts, because nev.r product
lines may have diffi.culties in reaching the same bigh level
of profi tabilj_ ty \vhich is tradi tlonal in the production of
drugs.
Economies of scale at the production stage is less 1mporta:nt
in the phaTmaceuticcl industry than in the majority of other
• ~ J...
-
46-In return, the costs for research and development and for
infor-mation and advertising have increased during recent years.
To carry through a large research project requires a certain number of researchers from different disciplines. The number
may be 60 to 100 men. T,'linimum requirements of this type imply
that small enterprises cannot undertake certain types of
pro-jects or that the project vrill require very much time. At the
same time certain indivisibilities im-ply that the utilization
of the capacity of the research department may be increased
by working simultaneously at several projects and with doubling
of certain functions.
The research activities is that paTt of the activities of the pharmaceutical industry where the advantages of large units
are most evident, and these advantages have increased during
~ecent years. Economies of scale are increased by the
superiori-ty which the lar,se enterprises have obtained through better
possibilities of a distribution of risks by aiming at several
independent projects.
It is assumed in the trade that it costs 15 to 20 million Dkr
over 5 to 7 years to dev-elop a regular ne''' :product. To a large
extent, therefore, the Danish pharmaceutical industry has had
to consider Scandinavia its domestic market~ ~his also appears
from export statistics, cf. figure 2. 2. For many preparations,
satisfaetory sales in Scandinavia will not be sufficient to
cover the growing development costs. In other ~ords9 if the
Danish phar;naceutical industry must develop its own preparations
based on its O\·Jn research in the future, it will be necesse.ry
\"Ti th marketing/ establishing j_n a n1J_mber of countries outside
Scandinavia. Of course, this ·vlill engage a. number of resources 16
The concentration vri thin the Danish ·pharmaceutical 1ndustry
is relatively· small. Tbis LS apparently due to two nircumstan(;es:
( 1) There has been no gensrati0!1 pro blell)S. T·he major~~ t~{ of the
growth has taken place during so fe~ years that there has been
no al tcrnation of generations duri::.1g that pGriocL.
(2) The results of the enterprises have been so ~ood that they
l!.a.ve been able to fj_nGJ1.::;c to a larz€ extent the e:-:I..IS'_1J.si.on