Research Article
A Computer Simulation Study of Anatomy Induced Drift of
Spiral Waves in the Human Atrium
Sanjay R. Kharche,
1Irina V. Biktasheva,
2Gunnar Seemann,
3Henggui Zhang,
4and Vadim N. Biktashev
11College of Engineering, Mathematics and Physical Sciences, University of Exeter, Exeter EX4 4QF, UK 2Department of Computer Science, University of Liverpool, Liverpool LS9 3BX, UK
3Institute for Biomedical Engineering, University of Karlsruhe (TH), 76131 Karlsruhe, Germany 4Biological Physics Group, Department of Physics, University of Manchester, Manchester M13 9PL, UK Correspondence should be addressed to Vadim N. Biktashev; [email protected]
Received 31 October 2014; Accepted 9 December 2014
Academic Editor: Michael Gotzmann
Copyright © 2015 Sanjay R. Kharche et al. This is an open access article distributed under the Creative Commons Attribution License, which permits unrestricted use, distribution, and reproduction in any medium, provided the original work is properly cited.
The interaction of spiral waves of excitation with atrial anatomy remains unclear. This simulation study isolates the role of atrial anatomical structures on spiral wave spontaneous drift in the human atrium. We implemented realistic and idealised 3D human atria models to investigate the functional impact of anatomical structures on the long-term (∼40 s) behaviour of spiral waves. The drift of a spiral wave was quantified by tracing its tip trajectory, which was correlated to atrial anatomical features. The interaction of spiral waves with the following idealised geometries was investigated: (a) a wedge-like structure with a continuously varying atrial wall thickness; (b) a ridge-like structure with a sudden change in atrial wall thickness; (c) multiple bridge-like structures consisting of a bridge connected to the atrial wall. Spiral waves drifted from thicker to thinner regions and along ridge-like structures. Breakthrough patterns caused by pectinate muscles (PM) bridges were also observed, albeit infrequently. Apparent anchoring close to PM-atrial wall junctions was observed. These observations were similar in both the realistic and the idealised models. We conclude that spatially altering atrial wall thickness is a significant cause of drift of spiral waves. PM bridges cause breakthrough patterns and induce transient anchoring of spiral waves.
1. Introduction
Atrial arrhythmias are complex phenomena involving a combination of electrophysiological [1, 2], structural [3], and anatomical [4, 5] factors. Persistent atrial arrhythmias are associated with ectopic beats [6], shortened action potentials [1, 7], and high rates of tissue excitation [8]. Due to the complex atrial electrophysiology and anatomy, complex rhythms arise as evidenced by multiple clinical and experimental studies [9,10]. However, there is experimental evidence that spiral and scroll waves (SWs) play a prominent role in promoting atrial arrhythmia [11, 12] as reflected in recent experimental, computational, and theoretical studies [13–17].
SWs have been linked to subcellular electrophysiological ion channel remodelling [18–20] and the increasing stability
of SWs studied extensively in multiple modelling studies in 2D tissue preparations [19,20]. Fibre orientation structure in cardiac tissue has been shown to cause distortion, anchoring, and breakup of stable SWs according to Majumder et al. [21] and others. Other important mechanisms affecting SWs are breakthrough patterns associated with pectinate muscle (PM) bridges and are predominantly thought to be due to the complex arrangement of PMs on the atrial endocardial wall as observed in the sheep atria [17]. In extensive optical mapping studies, the Allessie group has shown atrial arrhythmia to be sustained by epicardial-endocardial dissociation leading the breakthrough patterns [22,23]. The uneven cardiac anatomy also plays an important role in the dynamical behaviour of SWs [16, 17, 24–26]. The junctions of PM bridges and the atrial wall have been hypothesised to be anchoring locations for SWs by Yamazaki et al. [16]. Thus, the SWs may be drifting
or pinned depending on heterogeneities in atrial anatomy and electrophysiology [16,17,26].
In contrast to studies exploring mechanisms of SW persistence, the drifting and pinning of SWs during an arrhythmia remain underexplored. Here, we explore the drift and pinning mechanisms of SWs induced by anatomy. The role of anatomy alone on atrial arrhythmia has not been extensively quantified to date, and therefore such an investi-gation is warranted. A general theory of perturbation induced SW drift in cardiac tissue has been discussed by Biktasheva et al. [27]. A nonuniform diffusive coupling has been shown to cause a spontaneous drift of SWs [28]. The genesis and drift of SWs in ischemic tissue involving gap junctional gradients and spatially heterogeneous cellular electrophysiology in cardiac tissue have been demonstrated by Biktashev et al. [29].
In the present study, the ideas of the theory of per-turbation induced SW drifts are applied to the 3D atrial organ. The motivation for this computer modelling study is at the interface of theoretical mathematical developments and experimental atrial arrhythmia research. Based on idealisa-tions of tissue homogeneity and simulation of stable SWs, we hypothesized that SWs are affected by anatomical perturba-tions giving rise to SW spontaneous drift. We interpreted the simulations in the realistic 3D model of the human atrium from the viewpoint of the previously developed mathematical theory [27,30]. The theory states that a stationary scroll wave may spontaneously drift in response to small perturbations arising from electrophysiological, structural, or anatomical properties. Using both anatomically realistic 3D model of the human atrium and simplified 3D models, we demonstrate the role of atrial anatomy on the drift of SWs and identify individual causes of such drift.
2. Methods
Computational cardiology allows the systematic dissection of causal mechanisms of observed effects in the heart. As the aims of this study were to isolate the influence of anatomy on atrial SWs, the following assumptions were implemented:
(a) the electrophysiological model of ion current alter-ations was chosen that gave a stationary, nonmean-dering SW;
(b) a constant diffusive intercellular coupling throughout the anatomy was assumed;
(c) the 3D atrium was assumed to be structurally isotropic without effects of fibre orientation.
These assumptions are justified by our focus on the specific effects of anatomical geometry on the evolution of SWs. Hence the complicating factors, such as meander of SWs, multiple wavelets, fibrosis, gap junctional heterogeneity, and fibre orientation, are excluded from consideration. All these factors are important, but they deserve their separate studies and hence are left beyond the scope of this paper.
2.1. Atrial Excitation Model. The established human atrial action potential (AP) cell model by Courtemanche et al. [31] (CRN) was used in this study. The use of CRN model is
justified while striking a balance in the use of a biophysically detailed cell model to simulate stable SWs and to maintain a reasonable cell model complexity. It is the single most widely used cell model [19,32] shown to have similar AP properties to the more recent cell models [7] as far as this study is concerned. Electrophysiological changes to the CRN model were implemented as in previous studies [33, 34] to give stationary rotating reentry. This was achieved by reducing the maximum conductance of the L-type calcium current by 65%, along with a ninefold increase of slow delayed and the rapid delayed outward potassium currents. In addition, a simplified formulation of an acetylcholine-dependent potassium (𝐼KAch) current was added according to the formulas:
𝑂Ach=
10
(1 + 9.13/[Ach]0.47),
𝐶Ach= 0.052 +
0.45
(1 +e(𝑉+59.53)/17.18),
𝐼KAch= 𝐶𝑚× 𝑂Ach× 𝐶Ach× (𝑉 − 𝐸𝑘) ,
(1)
where𝑂Achis the acetylcholine-dependent activation gating variable, 𝐶Ach is the voltage dependent inactivation gating variable, [Ach] is the acetylcholine concentration taken to be 0.0035𝜇mol/L in this study [33–35],𝑉is the membrane potential, and 𝐸𝑘 is the reversal potential associated with potassium currents. This defines an electrophysiological con-dition giving stationary spiral SWs in isotropic homogeneous sheets of atrial tissue (Figure 1).
The time stepping in all simulations was using Rush-Larsen technique for gating variables and forward Euler for all other variables, with a fixed time step of 0.01 ms. This time step was sufficiently small that further decrease did not affect simulation results.
2.2. Tissue Modeling. A monodomain formulation of cardiac tissue was used in this study. The formulation can be written as
𝐶𝑚𝜕𝑉𝜕𝑡 = −𝐼ion+ 𝐷∇2𝑉,
𝑛 ⋅ ∇𝑉 = 0,
(2)
where𝐶𝑚is cell capacitance,𝐼ionis the total current, and𝐷is the diffusive coupling that represents intercellular gap junc-tional coupling. The value of𝐷was taken to be 0.07 mm2/ms to give a solitary wave conduction velocity of 0.4 mm/ms in the atria.
8mm
(a) Spiral wave reentry (left) and tip trace (right)
0 0 1
8 16
9.2Hz
Frequency (Hz)
PS
D (no
rmalis
ed)
300 200
100 0
−80mV 100ms
20
mV
CLn
CL
n+
1
0 100 200 300
[image:3.600.71.527.64.474.2](b) AP profile, power spectrum density, and recurrence map
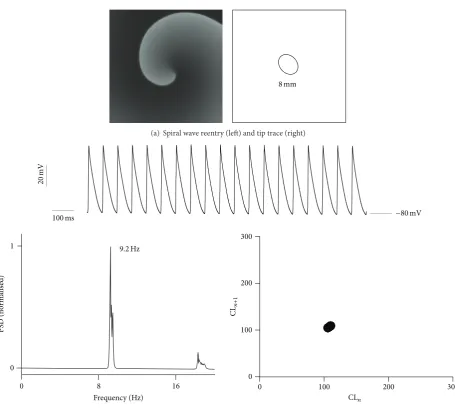
Figure 1: 2D simulation of AF with stationary reentry. (a) Spiral wave reentry (left) with spiral wave tip trace (right). The diameter of the spiral wave core (8 mm) is indicated in the right hand side panel. (b) Analysis of representative AP profile (top panel) from the 2D simulation. PSD of the representative AP profile (bottom left) showing a peak frequency of around 9.2 Hz. Recurrence map (bottom right) of consecutive cycle length durations of AP profile indicates the monomorphic nature of the reentry.
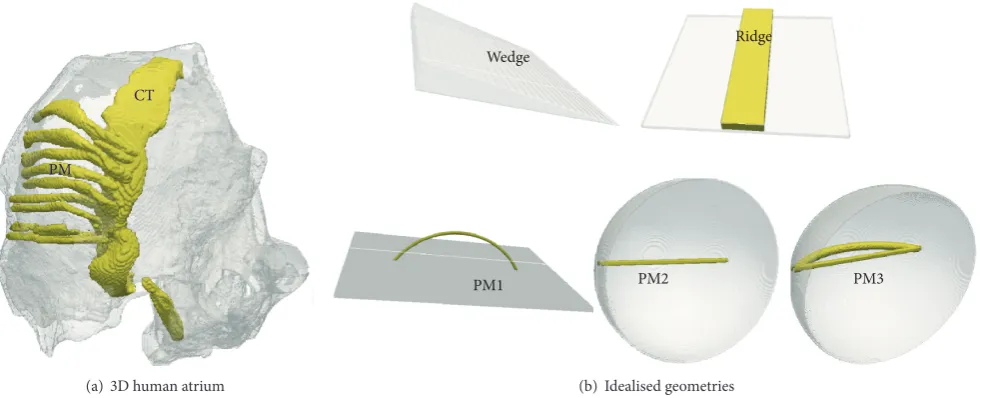
PMs attached to the endocardial atrial wall or by the CT attached to the endocardial atrial wall; and (c) multiple bridge geometries to simulate PMs that are joined to the atrial walls only at their ends. The locations where the bridges join the atrial wall are referred to as junctions. Based on these observations, the following idealised anatomical models were developed: (a) wedge, where the atrial wall has a varying thickness; (b) ridge, where a central strip is thicker than the underlying atrial wall; and (c) multiple bridge geometries where a PM forms a bridge on the endocardial surface of the atrial wall. The first bridge geometry (PM1) was a flat-walled bridge forming the base of a curved PM. Such a geometry has been considered previously by Gray et al. [17], though they assigned a higher value of conduction velocity to propagations in the PM as well as considering a longer PM bridge. In the second bridge geometry, a curved atrial wall
was taken with a PM bridge that formed a shorter connection between the two junctions of the atrial wall and the bridge (PM2). This geometry was then extended to include a ridge that went from one junction to the next but along the curved atrial wall (PM3).
PM
CT
(a) 3D human atrium
PM1 PM2 PM3
Ridge Wedge
[image:4.600.56.547.76.275.2](b) Idealised geometries
Figure 2: 3D human atrium anatomical model and idealised geometries. In all geometries, the atrial wall is shown as translucent gray while the endocardial structures and their idealizations are shown as solid (yellow online). (a) 3D human atrial geometry showing uniform atrial tissue and anatomically variable tissue consisting of the conduction pathways, including CT and PMs. (b) The idealised geometries with wedge (variable wall thickness), ridge (constant thickness atrial wall with a ridge on it), a flat atrial wall with a curved PM bridge (PM1), a hemispherical atrial wall with a shorter pectinate muscle bridge (PM2), and a hemispherical atrial wall with a shorter PM bridge as well as a PM ridge that goes along the atrial wall between the junctions (PM3).
surfaces representing the atrial wall in the wedge, ridge, and PM1 were taken to be 25 mm×25 mm. The length of the curved PM bridge in PM1 geometry was taken to be 14 mm. In the PM2 and PM3 geometries, the curved atrial wall was formed of a hemisphere with diameter of 30 mm. The straight PM bridges in PM2 and PM3 were given a length of 8 mm corresponding to the length of the PM bridge estimated in the 3D atrial anatomical model.
In the wedge model, the thickness was gradually reduced from the maximum at the left end till zero thickness at the right end. An SW close to the thick end of the wedge was initiated and allowed to evolve. In the ridge and the bridge models, SWs were initiated at multiple locations far away, close to, or at the location of ridges, bridges, or bridge-atrial wall junctions. In all idealised geometry simulations, the space step was 0.33 mm. Test simulations performed at a more refined space step of 0.1 mm produced similar results.
The space discretization in all cases was on a Cartesian grid with constant space step and 7-point stencil for the Laplacian of(2), with the no-flux boundary conditions imple-mented using the methods of weights as in Clayton and Panfilov [37] and in ten Tusscher and Panfilov [38], both for the anatomically realistic geometry and for the idealized geometries.
2.4. Simulation of SWs, 3D Data Analysis, and Visualization.
SWs were initiated at multiple locations in the right atrium or the idealised geometries by means of the phase distribution method [39]. Briefly, the phase distribution method of scroll wave initiation involves pacing of the cell model rapidly till steady APs as well as oscillations in all other state variables are obtained. The state variables over the span of one oscillation are then used to pace a 1D tissue to produce steady
M
o
th
er r
o
to
rs
x 1
2 3
4 5
6 7
8
9
0 1
T
ip traces
(a) Clockwise
1 3 4 5
6 7 8
9
0
2
[image:5.600.123.478.71.443.2](b) Anticlockwise
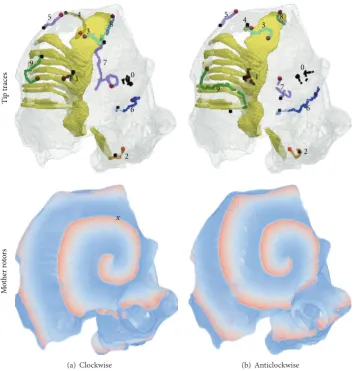
Figure 3: Summary of the anatomical model simulations. Column (a) shows data for clockwise and column (b) shows data for anticlockwise SW simulations. Top row shows nine selected tip traces of the spontaneously drifting scroll waves in different colours. On each trace, the red dot is the earliest point and the black dot is the latest point of the tip trace. The traces are also enumerated, and the numbers are referred to in the text. The initiation location of traces with the same numeric labelling is the same in the left and right panels. Bottom row shows typical snapshots of spiral waves seen on the surface nearest to the viewer. Left panel shows a clockwise rotating spiral while the right panel anticlockwise rotating spirals. The cross in the top right (left panel) designates the position of the registration electrode where a representative AP was recorded.
drift the simulation was not taken into account in this study. This allowed exclusion of transient initial conditions effects as well as overly complex drifting behaviour which is beyond the scope of the present study. Power density spectrum (PSD) of the registered AP profiles was computed to obtain the domi-nant pacing rates [18]. Recurrence maps were computed from the registered AP profiles to elucidate the form of the apparent arrhythmia, that is, monomorphic or polymorphic [43].
The visualisation was carried out using a combination of in-house software and VTK [44]. The 3D output files from Beatox cardiac simulation environment consisted of binary files which contained discretised data for three chosen dynamical variables from each location in the spatial model. These data were converted to binary VTK files and thereafter visualised using VTK pipelines. As the data were large (a total of 2.5 TB data were visualised), the visualisation was carried out noninteractively using the UK EPCC service as well as
the University of Exeter HPC service. The tips were tracked noninteractively using the Marching Cubes algorithm as described above, and the resulting data converted to VTK files to allow superimposition of data.
to low level code manipulation. In the 3D human atrium simulations of this study, 256 processors yielded the 40 s of simulated electrical activity within 38 hours. The numerical efficiency of BeatBox is reflected in its highly scalable nature as shown previously [46]. Thisin silicostudy demonstrates the functionality of the BeatBox package in conducting large scale computational investigations that potentially impact clinical practice. The simulation environment is freely distributed under GNU license and can be obtained from http://empslocal.ex.ac.uk/people/staff/vnb262/software/Beat-Box/index.html.
3. Results
3.1. Persistence of 2D Spiral Waves. Under the electrophysio-logically remodelled conditions, the AP is drastically abbre-viated with an AP duration (APD90) of 106 ms as compared to control conditions where APD90 is 302 ms [31]. Upon simulating spiral waves in a 2D homogeneous sheet of atrial tissue, the reentry is stable and persistent (Figure 1). The spiral wave tip trace shows no meander and is about 8 mm in diameter. Analysis of an AP recording from a representative location in the 2D model can be seen to have a dominant frequency of 9.2 Hz with minimum contributions from other pacing rates indicating a monomorphic atrial tachycardia. The recurrence map also shows a stable monomorphic period of 106 ms throughout the simulated interval of 40 s.
3.2. Observation of Spontaneous Drift in the Human Atrium.
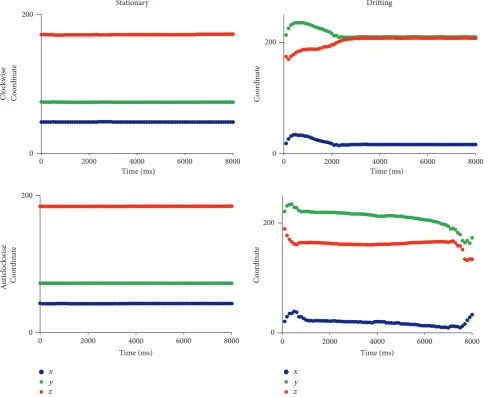
Selected tip trajectories of SWs in the 3D atrium simulations are shown inFigure 3. In parts of the atrium devoid of signif-icant anatomical features, the SWs were stationary (Figure 3, tip trace 0 of both chiralities). A closer examination of the local atrial anatomy revealed that there are no appreciable alterations in atrial wall thickness and those regions were also devoid of ridge-like and bridge-like structures. Stationary SWs without drift, apart from a minor initial transient move-ment within a small area, were observed also in regions of large anatomical heterogeneity (Figure 3, tip trace 1, both chi-ralities). In several simulations, a significant drift of the SWs was observed (Figure 3, tip traces 2 to 9 of both chiralities, except for trace 4 in the anticlockwise simulation which has no drift although it is close to a ridge). Typical features of such drift were (a) a rapid initial transient; (b) a continuing drift along anatomical structures; (c) eventual apparent anchoring of the SW. When the chirality of the SWs was reversed from clockwise to anticlockwise, the behaviour of SWs starting at the same location was changed; see Figures3 and 4. In Figure 4, the drift is illustrated by plotting the𝑥,𝑦, and 𝑧 coordinates of the tip with respect to time. In tip traces 3, 4, and 5 of both chiralities inFigure 3, a drift of the rotors from thicker regions to the closest thinner regions was observed. In case of tips 3 and 4 (both chiralities), the drift was from the thicker CT region into the thinner adjoining atrial wall. In case of tip trace 5, the drift was from the thicker right atrial appendage region to relatively thinner regions. The online supplementary videos show the time course of the drift of trajectory 5 in the clockwise (Online Supplement, S1 available at http://dx.doi.org/10.1155/2015/731386) and anticlockwise
(Online Supplement, S2) cases. Apart from a varying wall thickness, ridge-like formations were also found to influence the evolution of the SW tip trajectories in their own way. In case of tip traces 6, 7, and 8, the drift proceeded along such ridges. In case of tip trace 6, the drift was along a ridge formed due to a sudden change in atrial wall thickness from right atrium to left atrium. In case of tip traces 7 and 8, the drift was along the CT ridge with the atrial wall. Tip trajectory 9 is near not only ridge-like formations made by PMs that are connected with the atrial wall along all of their lengths but also a bridge-like formation made by one of the PMs that is connected to the atrial wall only at its ends. This is illustrated in the endocardial surface view of the right atrial wall region as shown inFigure 5. In previous experiments and in simulations, breakthrough patterns were observed to emerge from the junctions of this bridge-like PM with the atrial wall, and the SW drifted towards the junctions [17, 18, 47–49]. Indeed, as trajectory 9 of the anticlockwise case shows, there is a definite drift of the SWs towards the junction of the PM. The online supplementary videos show the time course of the drift of trajectory 9 in the clockwise (Online Supplement, S3) and anticlockwise (Online Supplement, S4) cases. Having identified some specific behaviour of SW that is influenced by atrial anatomy, we conducted idealised geometry simulations.
3.3. Exploring the Mechanism for Spontaneous Drift in the Atrium Using Idealised Geometries. Based on the observa-tions of SW drift in 3D atrial geometry and theoretical knowledge of spiral and SW drift available from previous literature, we identified the following possible “elementary” mechanisms responsible for the observed drift:
(a) a “wedge” that is a gradual alteration of atrial wall thickness, which can cause the SWs to drift at a certain angle with respect to the thickness gradient [30]; (b) a “ridge” that is a sudden change in atrial wall
thick-ness which can cause the SWs to migrate along the ridge [27];
(c) a “bridge” made by a PM which may cause break-through patterns that affect the rotors. We explored three variants of the bridge geometry to elucidate the role of the PM bridge.
We tested the feasibility of these mechanisms by reproducing them in idealized geometries where only one feature was present in each simulation to explain the SW behaviour as seen in our 3D simulations with the anatomically realistic atrial model. A composite bridge-ridge geometry was also used to explore a more realistic structure of the bridge formation as observed in the 3D model (Figure 5(b)). Due to the simplicity and symmetry of the idealised geometries, SW simulations with only one chirality were conducted.
0 2000 4000 6000 8000
C
o
o
rdina
te
0 200
Time (ms)
0 2000 4000 6000 8000
C
o
o
rdina
te
C
o
o
rdina
te
C
o
o
rdina
te
An
ti
clo
ckw
is
e
0 200
0 2000 4000 6000 8000
0 200
x y z x
y z
Time (ms) Time (ms) Time (ms)
0 2000 4000 6000 8000
0 200
Stationary Drifting
Cloc
k
w
is
[image:7.600.58.547.75.472.2]e
Figure 4: Plots of the scroll tip coordinates (𝑥,𝑦, and𝑧) with respect to time for selected stationary (left column) and drifting (right column) trajectories. Clockwise spirals are shown in top row while anticlockwise spirals in bottom row. The stationary plots are from trace 0 as shown inFigure 3in both clockwise (top) and anticlockwise (bottom) cases. The drifting plots are from trace 9 as shown inFigure 3in both clockwise (top) and anticlockwise (bottom) cases. In the drifting cases, data for the first 8 s is shown after which the SWs became stationary.
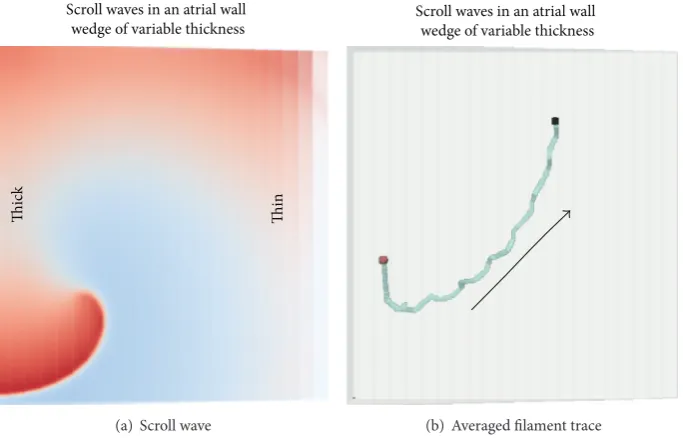
S5). The SW that was initiated in one corner of the thick end of the wedge spontaneously drifted to the thin end. This is consistent with the drift of scrolls in 3D atrial simulations through smooth parts of the atrial walls towards thinner loci and is an evidence that the SW filament tension in this model is positive, so that the filament length tends to get shorter as the SW drifts. The theoretical basis for the filament tension concept stems from Biktashev et al. [30].
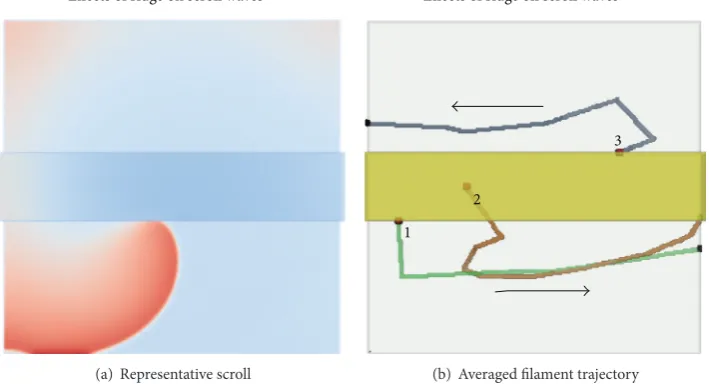
3.3.2. Ridge. In the anatomically realistic model, there are several ridge-like formations, that is, sudden increases of atrial wall thickness protruding on the endocardial side. In our anatomically realistic simulations, the tips numbers 6, 7, 8, and 9 drift along ridges. SWs were simulated in an idealised 3D ridge model as shown in Figure 7. When SWs were initiated sufficiently far away from the ridge, there was no drift. However, when SWs were initiated close
Thick Thin Thin
Ridges
Bridge Endocardial view of the 3D model
Ridg
e
Thic
k/thin
J1 J2
(a)
Endocardial view of the 3D model
Bridge
J1 J2
[image:8.600.129.467.73.298.2](b)
Figure 5: Cross-sectional endocardial views of the atrial geometry. (a) Overall anatomical structures considered in this study that give varying wall thickness, ridges, or bridge formations. The dotted line shows where a further cross section was taken and the arrow indicates the view of panel (b). A red dot is placed which indicates the orientation of panel (b) with respect to this panel. (b) The PM bridge in the 3D anatomical model which joins the atrial wall only at junctions J1 and J2.
Thic
k
Thin
Scroll waves in an atrial wall wedge of variable thickness
(a) Scroll wave
Scroll waves in an atrial wall wedge of variable thickness
(b) Averaged filament trace
Figure 6: Wedge simulation. (a) A snapshot of a surface spiral wave during an early stage of the simulation. (b) Trajectory of the tip. The direction of the drift is from thick to thin part of the wedge as indicated by the arrow.
videos show the time course of the drift in the ridge when initiated at various locations (Online Supplements, S6, S7, and S8). Some theoretical insight into this phenomenon can be obtained by comparison with simulations illustrated in Figure 4(g) in [27]. In that simulation, an attachment of a spiral wave to a stepwise parametric inhomogeneity and subsequent stable drift along it was described and explained theoretically. This is a phenomenon separate from filament tension and is related to nonmonotonic behaviour of the so-called response
[image:8.600.130.472.368.587.2]Effects of ridge on scroll waves
(a) Representative scroll
Effects of ridge on scroll waves
1
2
3
[image:9.600.123.478.80.272.2](b) Averaged filament trajectory
Figure 7: Ridge simulation. (a) A snapshot from the simulation where the SW was initiated close to the ridge. (b) Tip traces from 3 representative simulations where the scroll wave was initiated on the ridge (traces 1 and 3) or in the middle of the ridge (trace 2).
PM1 simulations
(a) Frame from simulation
1
2
3
4
J1 J2
PM1 simulations
[image:9.600.125.474.318.506.2](b) Filament traces
Figure 8: Flat wall bridge simulation. (a) Representative snapshot. (b) Tip traces from simulations where scroll waves were initiated close to the bridge (trace 1) or far away from the bridge (trace 3) or at intermediate locations (2 and 4).
parametric inhomogeneity considered in [27]. So, although we have not calculated the response functions for the current model, the observed drift along a ridge is an empirical evidence of their nonmonotonic behaviour.
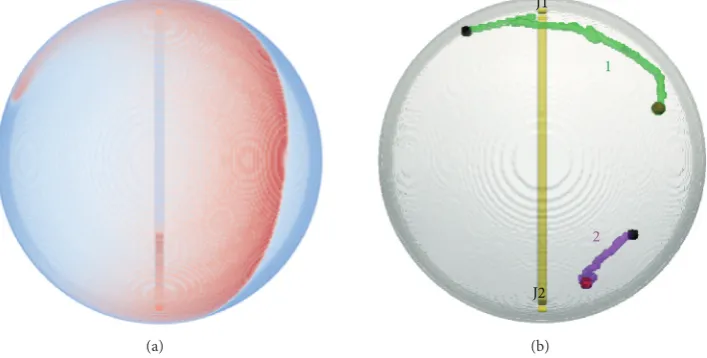
3.3.3. Bridges. In the anatomically realistic simulations, the PMs are finger-like structures, typically running along the endocardial side of the right atrial wall and making ridge formations. However, as shown in Figure 5, there are also PMs which form junctions with the atrial walls with the muscle body being unconnected to the atrial wall. We shall call the junctions of such a bridge J1 and J2. We have considered the following idealized bridge geometries.
(1) In a configuration such as flat atrial wall with a semicircular bridge (PM1 geometry inFigure 2(b)), the dis-tance between J1 and J2 along the atrial wall is noticeably shorter than along the bridge. Therefore, regardless of where
the SW was initiated, activation wave fronts always entered through both J1 and J2 in opposite directions into the bridge. The bridge, unsurprisingly, had no effect on the SW and it remained stationary. Tip traces from a few simulations that illustrate the stationary nature of the SWs when initiation sites were close to or far away from J2 are illustrated in Figure 8. An online supplementary video illustrates the time course of the drift in such a flat-walled bridge (Online Supplement, S9).
PM bridge. The location of collision progressively moved gradually from one junction to the other. This affected the SW and caused a slow but definite drift closer to the junction where the collision location was moving towards. Eventually in case of trajectory 1 (Figure 9(b)), the SW core was almost coincidental with J2 and breakthrough patterns also occurred at the same junction. The direction of propagations through the bridge was observed to be reversed when the SW reached J2. The breakthrough patterns emerging at J2 then promoted the SW to move away from that junction. The movement of the tip was faster when the SW was at J2 and when the wave-break patterns started to emerge at J2. Depending on where the SW was initiated, it eventually settled at a certain distance (as shown inFigure 9) from the junctions. Such equilibrium was achieved due to the SW arm allowing propagations through J1 and J2 which collided exactly in the middle and therefore did not offer any perturbations (small or large) to cause further drift of the rotor. An online supplementary video shows the time course of the drift in this geometry (Online Supplement, S10).
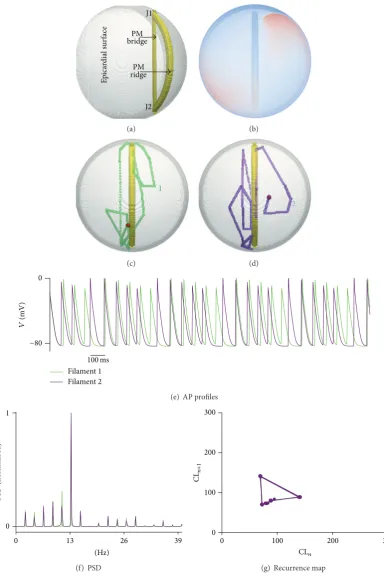
(3)In the final idealised bridge geometry (PM3 geometry in Figure 2(b)), one PM formed a bridge between J1 and J2, while another formed a ridge along the atrial walls. This is shown inFigure 10. An online supplementary video further illustrates the time course of the drift in the PM3 geometry (Online Supplement, S11). Irrespective of where the SW was initiated, it rapidly drifted towards and then along the ridge forming PM. Such a swift drift was accom-panied by an increased breakthrough pattern occurrence from J1 and J2 due to accompanying propagations through the PM bridge. In such a situation, the SW meandered rapidly between the two junctions along the ridge, while the bridge assisted in causing breakthrough patterns. The SW was also observed to spend prolonged durations at J1 and J2 (see Online Supplement Video S11). This complex propagation pattern is reflected in the representative recorded AP profiles (Figure 10(e)) where the AP amplitude was seen to periodically increase and reduce. In a marked difference to all other simulations presented in this study, several peaks were observed in the PSD of the AP profiles as shown in Figure 10(f) indicating the polymorphic nature of the excitation pattern. This was further confirmed in the recurrence map where consecutive cycle lengths had a periodic long/short variation. Such excitation patterns are known to be associated with Torsade de Pointes (TdP) where a periodically varying ECG is observed [50,51].
Existence of a bridge is not a small perturbation in any sense, and therefore the asymptotic theory [27,30] cannot explain its effect. Previous numerical studies have explored some of the effects of bridges [16,17]. They however combined the effects of anatomy and inhomogeneity of diffusion coef-ficient (i.e., conduction velocity was considered to be higher in the bridge) or considered truncated PM structures.
4. Conclusions and Discussion
In this paper, we have studied the spontaneous evolution of a persistent single SW in the human atrium. The behaviour of SWs was simulated and quantified in terms of the SW
drift and apparent anchoring. Further, the hypothesised mechanisms that lead to such spontaneous drift have been examined in idealised geometries which helped to separate and highlight the individual causes of the drift. The hypoth-esis that a variable wall thickness leads to drift of an SW was verified in this study. Another important feature of the atria is ridge-like formations in the PMs and the CT which form parts of the main conduction pathways in the organ. Even as the fibre orientation heterogeneity in the CT was not considered, we have seen that SWs tend to migrate along these ridges (Figure 3). This behaviour of the SWs was confirmed in the idealised ridge simulations. Thus one of the causes of SW migration is possibly due to sudden change in atrial wall thickness, as seen at the ridges formed by CT and atrial wall, and those of the PM and atrial wall (Figure 5).
Curved atrial wall and short PM bridge: PM2 simulations
(a)
Curved atrial wall and short PM bridge: PM2 simulations
1
2
J2 J1
[image:11.600.124.478.92.271.2](b)
Figure 9: Curved wall bridge simulations. (a) Representative snapshot. The reentry looks distorted as it is on the steep part of the hemispherical wall, at a large angle to the presented view. (b) Two tip traces from simulations where scroll waves were initiated on either side of the bridge junctions. J1 and J2 indicate junctions of the PM bridge with the atrial wall on the endocardial side of the model.
anatomy leads to increasingly complex excitation patterns. Apart from the PM3 simulations, all SW simulations are essentially monomorphic characterised by a single dominant frequency of approximately 10 Hz and a highly localised recurrence map. In case of the PM3 simulations, a simple addition of a PM ridge in addition to a PM bridge gave TdP type of excitation patterns. The ridge also assisted in tempo-rary anchoring of the SW to the junctions, although it was not persistent. We see that relatively simple geometries (i.e., PM3) can to certain extent explain the movement of SWs as well as providing a plausible mechanism for apparent anchoring of SWs. The PM3 simulation results may provide evidence for anatomy based evolution of the SWs, which may manifest as large/small amplitude modulation of the ECG signal [52,53].
4.1. Discussion. Pandit and Jalife [32] have recently reviewed the mathematical modelling as well as experimental literature on SWs and rotors. Reentry has been shown to be generated and sustained by means of focal activity in AF patients [54]. Ourin silicostudy allowed the elucidation of the effects of atrial anatomy on such atrial reentrant SWs, albeit without the focal activity. Simulations presented in this study show that SWs tend to spontaneously drift due to anatomical features. The SW becomes localised or anchors to locations where it does not experience further perturbations or when multiple perturbations cancel out each other’s effects. Unlike previous studies, in our simulations a PM bridge on its own did not form an SW anchoring location. It does however pro-vide a conduction pathway that may give rise to complex wave patterns. The understanding provided by this study has sev-eral clinical implications. Firstly, it will assist in further devel-oping efficient, low-amplitude defibrillation schemes [33,55– 57]. Secondly, clinical MRI based patient specific evaluation
of gross anatomy can be used in predicting the eventual loca-tions of the arrhythmic substrate, thereby personalising ther-apy. Results from this study can contribute to prediction of SWs in the proximity of such surgical remnants of anatomical deformities. Indeed, the presented computational framework can be used to predict the evolution of atrial arrhythmia given a reasonable patient specific atrial anatomy alone.
E
p
ica
rdial sur
face bridgePM
PM ridge
J1
J2
(a) (b)
1
(c)
2
(d)
Filament 1 Filament 2
V
(mV)
0
−80
100ms
(e) AP profiles
(Hz)
0 13 26 39
PS
D (no
rma
lis
ed)
0 1
(f) PSD
0 100 200 300
0 100 200 300
CLn
CL
n+1
[image:12.600.105.490.69.646.2](g) Recurrence map
drawn in this study rely on one anatomical model of the human atria which may be considered a limitation. Although it is known that human atrial anatomy is highly irregular, MRI data from AF patients and multiple anatomies may improve our evaluation of SW behaviour. Recent studies indicate that fibre orientation heterogeneity may be a key factor [64,65], potentially superseding the uneven anatomy, in the genesis of complex dynamics during episodes of AF. In future studies, the role of such anisotropy will be taken into account, which will make the simulation results more realistic. In addition to AF induced ionic remodelling and the existence of fibre orientation, AF patients are known to have atrial diffusion inhomogeneity as well as advanced fibrosis [66]. SW interaction with such inhomogeneity is expected to give rise to SW breakup and erratic propagations and requires further investigation.
Abbreviations
AP: Action potential
APD90: AP duration at90% repolarisation AF: Atrial fibrillation
CL𝑛: 𝑛th cycle length of an AP profile CT: Crista terminalis
CRN: Courtemanche et al. (1998) human atrial cell model
J1, J2: Junctions of PM with atrial wall SW: Spiral or scroll wave
PM: Pectinate muscle
PM1, PM2, PM3: Idealised geometries consisting of atrial wall, pectinate muscle bridges, and ridges
PSD: Power spectrum density TdP: Torsade de Pointes.
Conflict of Interests
The authors declare that there is no conflict of interests regarding the publication of this paper.
Authors’ Contribution
Sanjay R. Kharche, Irina V. Biktasheva, and Vadim N. Biktashev conceptualised and designed the simulations. Henggui Zhang, Sanjay R. Kharche, and Gunnar Seemann prepared the 3D atrial anatomical model, provided from Gunnar Seemann’s laboratory, for the simulations. Sanjay R. Kharche conducted the simulations and visualization. Sanjay R. Kharche, Irina V. Biktasheva, and Vadim N. Biktashev analysed and interpreted the simulation results. All authors contributed to the writing of the paper. All authors have confirmed and approved the final version of this paper.
Acknowledgments
This work is supported by EPSRC Grants (EP/I029664/1, EP/I029826/1, and EP/I030158/1), PRACE HPC Funding (PRPB09, 2012). The calculations for this were performed
using the University of Exeter Supercomputer and the UK National Supercomputer Facility HECToR. The authors thank the University of Exeter HPC Service and HPC Team, as well as HECToR staff, for their support. All simulations in this work were done using BeatBox HPC Cardiac Simulation Environment, and the authors are grateful to all BeatBox developers.
References
[1] A. J. Workman, K. A. Kane, and A. C. Rankin, “Cellular bases for human atrial fibrillation,” Heart Rhythm, vol. 5, no. 6, supplement, pp. S1–S6, 2008.
[2] R. F. Bosch and S. Nattel, “Cellular electrophysiology of atrial fibrillation,”Cardiovascular Research, vol. 54, no. 2, pp. 259–269, 2002.
[3] J. Pellman, R. C. Lyon, and F. Sheikh, “Extracellular matrix remodeling in atrial fibrosis: mechanisms and implications in atrial fibrillation,”Journal of Molecular and Cellular Cardiology, vol. 48, no. 3, pp. 461–467, 2010.
[4] M. Anselmino, A. Blandino, S. Beninati et al., “Morphologic analysis of left atrial anatomy by magnetic resonance angiog-raphy in patients with atrial fibrillation: a large single center experience,”Journal of Cardiovascular Electrophysiology, vol. 22, no. 1, pp. 1–7, 2011.
[5] P. G. MacEdo, S. Kapa, J. A. Mears, A. Fratianni, and S. J. Asirvatham, “Correlative anatomy for the electrophysiologist: ablation for atrial fibrillation. Part II: regional anatomy of the atria and relevance to damage of adjacent structures during AF ablation,”Journal of Cardiovascular Electrophysiology, vol. 21, no. 7, pp. 829–836, 2010.
[6] Y. Gong, F. Xie, K. M. Stein et al., “Mechanism underlying ini-tiation of paroxysmal atrial flutter/atrial fibrillation by ectopic foci: a simulation study,”Circulation, vol. 115, no. 16, pp. 2094– 2102, 2007.
[7] E. Grandi, S. V. Pandit, N. Voigt et al., “Human atrial action potential and Ca2+ model: sinus rhythm and chronic atrial fibrillation,”Circulation Research, vol. 109, no. 9, pp. 1055–1066, 2011.
[8] K. C. Ravi, D. E. Krummen, A. J. Tran, J. R. Bullinga, and S. M. Narayan, “Electrocardiographic measurements of regional atrial fibrillation cycle length,”Pacing and Clinical Electrophysi-ology, vol. 32, supplement 1, pp. S66–S71, 2009.
[9] S. Nakahara, N. Toratani, H. Nakamura, A. Higashi, and K. Takayanagi, “Spatial relationship between high-dominant-frequency sites and the linear ablation line in persistent atrial fibrillation: its impact on complex fractionated electrograms,”
Europace, vol. 15, no. 2, pp. 189–197, 2013.
[10] A. N. Ganesan, P. Kuklik, D. H. Lau et al., “Bipolar electrogram Shannon entropy at sites of rotational activation: implications for ablation of atrial fibrillation,”Circulation: Arrhythmia and Electrophysiology, vol. 6, no. 1, pp. 48–57, 2013.
[11] S. Nattel, “New ideas about atrial fibrillation 50 years on,”
Nature, vol. 415, no. 6868, pp. 219–226, 2002.
[12] A. J. Workman, “Cardiac adrenergic control and atrial fibril-lation,”Naunyn-Schmiedeberg’s Archives of Pharmacology, vol. 381, no. 3, pp. 235–249, 2010.
[14] I. V. Biktasheva, V. N. Biktashev, and A. V. Holden, “Wavebreaks and self-termination of spiral waves in a model of human atrial tissue,” inFunctional Imaging and Modeling of the Heart, vol. 3504 ofLecture Notes in Computer Science, pp. 293–303, Springer, Berlin, Germany, 2005.
[15] I. V. Biktasheva, A. V. Holden, and H. Zhang, “Stability, period and meander of spiral waves in two human virtual atrial tissues,”
The Journal of Physiology, vol. 544, pp. 3P–4P, 2002.
[16] M. Yamazaki, S. Mironov, C. Taravant et al., “Heterogeneous atrial wall thickness and stretch promote scroll waves anchoring during atrial fibrillation,”Cardiovascular Research, vol. 94, no. 1, pp. 48–57, 2012.
[17] R. A. Gray, A. M. Pertsov, and J. Jalife, “Incomplete reentry and epicardial breakthrough patterns during atrial fibrillation in the sheep heart,”Circulation, vol. 94, no. 10, pp. 2649–2661, 1996. [18] S. Kharche, C. J. Garratt, M. R. Boyett et al., “Atrial
proarrhyth-mia due to increased inward rectifier current (I𝐾1) arising from
KCNJ2mutation—a simulation study,” Progress in Biophysics and Molecular Biology, vol. 98, no. 2-3, pp. 186–197, 2008. [19] S. V. Pandit, O. Berenfeld, J. M. B. Anumonwo et al., “Ionic
determinants of functional reentry in a 2-D model of human atrial cells during simulated chronic atrial fibrillation,” Biophys-ical Journal, vol. 88, no. 6, pp. 3806–3821, 2005.
[20] C. S´anchez, A. Corrias, A. Bueno-Orovio et al., “The Na+/K+ pump is an important modulator of refractoriness and rotor dynamics in human atrial tissue,”American Journal of Physiology—Heart and Circulatory Physiology, vol. 302, no. 5, pp. H1146–H1159, 2012.
[21] R. Majumder, A. R. Nayak, and R. Pandit, “Scroll-wave dynam-ics in human cardiac tissue: lessons from a mathematical model with inhomogeneities and fiber architecture,”PLoS ONE, vol. 6, no. 4, Article ID e18052, 2011.
[22] J. Eckstein, S. Zeemering, D. Linz et al., “Transmural conduc-tion is the predominant mechanism of breakthrough during atrial fibrillation: Evidence from simultaneous endo-epicardial high-density activation mapping,”Circulation: Arrhythmia and Electrophysiology, vol. 6, no. 2, pp. 334–341, 2013.
[23] J. Eckstein, B. Maesen, D. Linz et al., “Time course and mechanisms of endo-epicardial electrical dissociation during atrial fibrillation in the goat,”Cardiovascular Research, vol. 89, no. 4, pp. 816–824, 2011.
[24] I. M. Graf, G. Seemann, D. L. Weiß, and O. D¨ossel, “Influence of electrophysiological heterogeneity on electrical stimulation in healthy and failing human hearts,”Medical and Biological Engineering and Computing, vol. 43, no. 6, pp. 783–792, 2005. [25] G. Seemann, C. H¨oper, F. B. Sachse, O. D¨ossel, A. V. Holden,
and H. Zhang, “Heterogeneous three-dimensional anatomical and electrophysiological model of human atria,”Philosophical Transactions of the Royal Society A: Mathematical, Physical and Engineering Sciences, vol. 364, no. 1843, pp. 1465–1481, 2006. [26] Y. Takemoto, H. Takanari, H. Honjo et al., “Inhibition of
intercellular coupling stabilizes spiral-wave reentry, whereas enhancement of the coupling destabilizes the reentry in favor of early termination,”American Journal of Physiology: Heart and Circulatory Physiology, vol. 303, no. 5, pp. H578–H586, 2012. [27] I. V. Biktasheva, D. Barkley, V. N. Biktashev, and A. J. Foulkes,
“Computation of the drift velocity of spiral waves using response functions,”Physical Review E, vol. 81, no. 6, Article ID 066202, 2010.
[28] M. Wellner, C. Zemlin, and A. M. Pertsov, “Frustrated drift of an anchored scroll-wave filament and the geodesic principle,”
Physical Review E: Statistical, Nonlinear, and Soft Matter Physics, vol. 82, no. 3, Article ID 036122, 2010.
[29] V. N. Biktashev, I. V. Biktasheva, and N. A. Sarvazyan, “Evolu-tion of spiral and scroll waves of excita“Evolu-tion in a mathematical model of ischaemic border zone,”PLoS ONE, vol. 6, no. 9, Article ID e24388, 2011.
[30] V. N. Biktashev, A. V. Holden, and H. Zhang, “Tension of organizing filaments of scroll waves,”Philosophical Transactions of the Royal Society of London Series A, vol. 347, no. 1685, pp. 611– 630, 1994.
[31] M. Courtemanche, R. J. Ramirez, and S. Nattel, “Ionic mech-anisms underlying human atrial action potential properties: insights from a mathematical model,” American Journal of Physiology—Heart and Circulatory Physiology, vol. 275, no. 1, pp. H301–H321, 1998.
[32] S. V. Pandit and J. Jalife, “Rotors and the dynamics of cardiac fibrillation,”Circulation Research, vol. 112, no. 5, pp. 849–862, 2013.
[33] S. W. Morgan, G. Plank, I. V. Biktasheva, and V. N. Biktashev, “Low energy defibrillation in human cardiac tissue: a simulation study,”Biophysical Journal, vol. 96, no. 4, pp. 1364–1373, 2009. [34] F. Xie, Z. Qu, A. Garfinkel, and J. N. Weiss, “Electrical refractory
period restitution and spiral wave reentry in simulated cardiac tissue,”American Journal of Physiology—Heart and Circulatory Physiology, vol. 283, no. 1, pp. H448–H460, 2002.
[35] G. Plank, L. J. Leon, S. Kimber, and E. J. Vigmond, “Defibril-lation depends on conductivity fluctuations and the degree of disorganization in reentry patterns,”Journal of Cardiovascular Electrophysiology, vol. 16, no. 2, pp. 205–216, 2005.
[36] M. J. Ackerman, “The Visible Human Project: a resource for anatomical visualization,” Studies in Health Technology and Informatics, vol. 52, part 2, pp. 1030–1032, 1998.
[37] R. H. Clayton and A. V. Panfilov, “A guide to modelling cardiac electrical activity in anatomically detailed ventricles,”Progress in Biophysics and Molecular Biology, vol. 96, no. 1–3, pp. 19–43, 2008.
[38] K. H. Tusscher and A. V. Panfilov, “Modelling of the ventricular conduction system,”Progress in Biophysics & Molecular Biology, vol. 96, no. 1–3, pp. 152–170, 2008.
[39] V. N. Biktashev and A. V. Holden, “Reentrant waves and their elimination in a model of mammalian ventricular tissue,”
Chaos, vol. 8, no. 1, pp. 48–55, 1998.
[40] C. Montani, R. Scateni, and R. Scopigno, “A modified look-up table for implicit disambiguation of marching cubes,”The Visual Computer, vol. 10, no. 6, pp. 353–355, 1994.
[41] D. Barkley and M. Dowle, EZ-SCROLL: a code for simulat-ing scroll waves,http://www.warwick.ac.uk/∼masax/Software/ ez software.html.
[42] M. Dowle, R. M. Mantel, and D. Barkley, “Fast simulations of waves in three-dimensional excitable media,”International Journal of Bifurcation and Chaos in Applied Sciences and Engineering, vol. 7, no. 11, pp. 2529–2545, 1997.
[43] F. Xie, Z. Qu, J. Yang, A. Baher, J. N. Weiss, and A. Garfinkel, “A simulation study of the effects of cardiac anatomy in ventricular fibrillation,”The Journal of Clinical Investigation, vol. 113, no. 5, pp. 686–693, 2004.
[44] W. Schroeder, K. Martin, and B. Lorensen,The Visualisation Toolkit, Kitware, 2006.
Conference, E. Gelenbe, S. Abramsky, and A. Sassone, Eds., pp. 99–109, British Computer Society, London, UK, September 2008.
[46] S. Kharche, I. V. Biktasheva, H. Zhang, and V. N. Biktashev, “Cardioversion in the human atria: a simulation study,” in
Proceedings of the Annual Computers in Cardiology Conference (CinC ’12), 2012.
[47] S. Kharche, G. Seemann, J. Leng, A. V. Holden, C. J. Garratt, and H. Zhang, “Scroll waves in 3D virtual human atria: a computational study,” inFunctional Imaging and Modeling of the Heart, F. B. Sachse and G. Seemann, Eds., vol. 4466 of
Lecture Notes in Computer Science, pp. 129–138, Springer, Berlin, Germany, 2007.
[48] S. Kharche, G. Seemann, L. Margetts, J. Leng, A. V. Holden, and H. Zhang, “Simulation of clinical electrophysiology in 3D human atria: a performance computing and high-performance visualization application,”Concurrency and Com-putation: Practice and Experience, vol. 20, no. 11, pp. 1317–1328, 2008.
[49] T.-J. Wu, M. Yashima, F. Xie et al., “Role of pectinate muscle bundles in the generation and maintenance of intra-atrial reentry: potential implications for the mechanism of conver-sion between atrial fibrillation and atrial flutter,” Circulation Research, vol. 83, no. 4, pp. 448–462, 1998.
[50] M. G. Chang, D. Sato, E. de Lange et al., “Bi-stable wave propagation and early afterdepolarization-mediated cardiac arrhythmias,”Heart Rhythm, vol. 9, no. 1, pp. 115–122, 2012. [51] M. J. Krantz and J. A. Garcia, “Images in cardiology:
pseudo-torsade de pointes with underlying wandering atrial pace-maker,”Clinical Cardiology, vol. 28, no. 7, p. 355, 2005. [52] J. C. Hancox, M. J. McPate, A. El Harchi, and Y. H. Zhang,
“The hERG potassium channel and hERG screening for drug-induced torsades de pointes,”Pharmacology and Therapeutics, vol. 119, no. 2, pp. 118–132, 2008.
[53] S. P. Seslar, S. M. Shepard, and C. I. Berul, “‘Atrial torsades de pointes’ in the long QT syndrome,”Journal of Interventional Cardiac Electrophysiology, vol. 24, no. 2, pp. 95–97, 2009. [54] S. M. Narayan, D. E. Krummen, and W.-J. Rappel, “Clinical
mapping approach to diagnose electrical rotors and focal impulse sources for human atrial fibrillation,”Journal of Car-diovascular Electrophysiology, vol. 23, no. 5, pp. 447–454, 2012. [55] T. K. Shajahan, A. R. Nayak, and R. Pandit, “Spiral-wave
turbulence and its control in the presence of inhomogeneities in four mathematical models of cardiac tissue,”PLoS ONE, vol. 4, no. 3, Article ID e4738, 2009.
[56] S. Sinha, A. Pande, and R. Pandit, “Defibrillation via the elimination of spiral turbulence in a model for ventricular fibrillation,”Physical Review Letters, vol. 86, no. 16, pp. 3678– 3681, 2001.
[57] V. N. Biktashev and A. V. Holden, “Design principles of a low voltage cardiac defibrillator based on the effect of feedback resonant drift,”Journal of Theoretical Biology, vol. 169, no. 2, pp. 101–112, 1994.
[58] S. Alonso, M. Bar, and A. V. Panfilov, “Negative tension of scroll wave filaments and turbulence in three-dimensional excitable media and application in cardiac dynamics,”Bulletin of Mathematical Biology, vol. 75, no. 8, pp. 1351–1376, 2013. [59] A. V. Panfilov, “Three-dimensional organization of electrical
turbulence in the heart,”Physical Review E—Statistical Physics, Plasmas, Fluids, and Related Interdisciplinary Topics, vol. 59, no. 6, pp. R6251–R6254, 1999.
[60] A. T. Winfree, “Electrical turbulence in three-dimensional heart muscle,”Science, vol. 266, no. 5187, pp. 1003–1006, 1994. [61] A. J. Workman, K. A. Kane, and A. C. Rankin, “The contribution
of ionic currents to changes in refractoriness of human atrial myocytes associated with chronic atrial fibrillation,” Cardiovas-cular Research, vol. 52, no. 2, pp. 226–235, 2001.
[62] D. Dobrev, E. Wettwer, A. Kortner, M. Knaut, S. Sch¨uler, and U. Ravens, “Human inward rectifier potassium channels in chronic and postoperative atrial fibrillation,”Cardiovascular Research, vol. 54, no. 2, pp. 397–404, 2002.
[63] R. F. Bosch, X. Zeng, J. B. Grammer, K. Popovic, C. Mewis, and V. K¨uhlkamp, “Ionic mechanisms of electrical remodeling in human atrial fibrillation,”Cardiovascular Research, vol. 44, no. 1, pp. 121–131, 1999.
[64] H. Dierckx, A. P. Benson, S. H. Gilbert et al., “Intravoxel fibre structure of the left ventricular free wall and posterior left-right ventricular insertion site in canine myocardium using q-ball imaging,” inFunctional Imaging and Modeling of the Heart, N. Ayache, Ed., vol. 5528 ofLecture Notes in Computer Science, pp. 495–504, Springer, Berlin, Germany, 2009.
[65] H. Verschelde, H. Dierckx, and O. Bernus, “Covariant stringlike dynamics of scroll wave filaments in anisotropic cardiac tissue,”
Physical Review Letters, vol. 99, no. 16, Article ID 168104, 2007. [66] B. Avitall, J. Bi, A. Mykytsey, and A. Chicos, “Atrial and