This is a repository copy of
Health related quality of life by age, gender and history of
cardiovascular disease: results from the Health Survey for England
.
White Rose Research Online URL for this paper:
http://eprints.whiterose.ac.uk/10880/
Monograph:
Ara, R. and Brazier, J. (2009) Health related quality of life by age, gender and history of
cardiovascular disease: results from the Health Survey for England. Discussion Paper.
(Unpublished)
HEDS Discussion Paper 09/12
eprints@whiterose.ac.uk https://eprints.whiterose.ac.uk/ Reuse
Unless indicated otherwise, fulltext items are protected by copyright with all rights reserved. The copyright exception in section 29 of the Copyright, Designs and Patents Act 1988 allows the making of a single copy solely for the purpose of non-commercial research or private study within the limits of fair dealing. The publisher or other rights-holder may allow further reproduction and re-use of this version - refer to the White Rose Research Online record for this item. Where records identify the publisher as the copyright holder, users can verify any specific terms of use on the publisher’s website.
Takedown
If you consider content in White Rose Research Online to be in breach of UK law, please notify us by
- 1 -
HEDS Discussion Paper 09/12
Disclaimer:
This is a Discussion Paper produced and published by the Health Economics
and Decision Science (HEDS) Section at the School of Health and Related
Research (ScHARR), University of Sheffield. HEDS Discussion Papers are
intended to provide information and encourage discussion on a topic in
advance of formal publication. They represent only the views of the authors,
and do not necessarily reflect the views or approval of the sponsors.
White Rose Repository URL for this paper:
Once a version of Discussion Paper content is published in a peer-reviewed
journal, this typically supersedes the Discussion Paper and readers are invited
to cite the published version in preference to the original version.
Published paper
None.
H
H
e
e
a
a
l
l
t
t
h
h
E
E
c
c
o
o
n
n
o
o
m
m
i
i
c
c
s
s
a
a
n
n
d
d
D
D
e
e
c
c
i
i
s
s
i
i
o
o
n
n
S
S
c
c
i
i
e
e
n
n
c
c
e
e
D
D
i
i
s
s
c
c
u
u
s
s
s
s
i
i
o
o
n
n
P
P
a
a
p
p
e
e
r
r
S
S
e
e
r
r
i
i
e
e
s
s
No. 09/12
Health related quality of life by age, gender
and history of cardiovascular disease:
results from the Health Survey for England
Roberta Ara
a*, and John Brazier
aa
Health Economics and Decision Science, University of Sheffield,
Regent Court, 30Regent Street, Sheffield, S1 4DA, UK
* Correspondence to: Roberta Ara, Health Economics and
Decision Science, University of Sheffield, Regent Court, 30 Regent
Street, Sheffield, S1 4DA, UK.
Telephone: +44114 222 0788.
Fax: +44114 272 4095.
Email:
r.ara@sheffield.ac.uk
This series is intended to promote discussion and to provide information about
work in progress. The views expressed in this series are those of the authors,
and should not be quoted without their permission. Comments are welcome,
and should be sent to the corresponding author.
Health related quality of life by age, gender and history of cardiovascular disease: results from the
Health Survey for England
Key words: health-state utility, health economics methods, cardiovascular, decision models,
health surveys
Abstract
Introduction: While there is an increasing volume of literature describing the health state utility
values (HSUV) individuals with angina, heart attack or stroke, research comparing HSUVs for these
conditions within the same study is sparse. This hinders analysts wishing to explore the benefits of
interventions in cardiovascular disease (CVD). The objective of this study was to obtain EQ-5D scores
to inform health states in CVD economic models using the same source for each health state.
Methods: EQ-5D data (N = 26,679) from individuals aged 16 to 98 years taking part in the
Health Survey for England (2003, 2006) was used. Regressions were employed to explore the
significance of age, gender and history of CVD on HSUVs taking into account the number and type of
cardiovascular condition(s) and time since event. The predictive ability of the model was assessed
using errors in predicted values on both the individual and the sub-group levels.
Results: Our results show HSUVs differ by age, gender, CV history, time since CV event and
the number of concurrent CV conditions. The regression model is reasonably accurate when
predicting mean values for sub-groups stratified by age, CV condition and time since event, with 67%
of predicted values within the minimal important difference for the EQ-5D index.
Conclusions: The results provide a consistent basis for analysts to populate the most frequently
defined health states (no CVD, heart attack, angina and stroke) in CVD models. Further research is
INTRODUCTION
Policy decisions on reimbursement within health care are frequently informed by economic evaluations
describing the cost-effectiveness of interventions in terms of the cost per quality adjusted life year. The
mathematical models used to generate these results are constructed to replicate the clinical pathway of
the disease under consideration. Models can vary from simple decision trees with just two health states
(alive or dead) to more complex forms where each health event associated with a disease is described
by a distinct health state.
Economic models require health state utility values (HSUV) obtained from preference-based measures
for each of the health states and the data needs to be obtained from patients whose health condition
corresponds to the definition of the individual health state. Depending on the health condition or the
particular health related event, health related quality of life (HRQoL) can either improve or deteriorate
over time. As respondents are asked to describe their HRQoL during the immediately preceding time
period (frequently the last seven days), long term studies are required to describe any changes over
time. While the evidence base describing HSUVs in different samples and settings is growing, patient
demographics, definitions of health conditions, and the follow-up period can all differ considerably
between studies. The heterogeneity in study design hinders analysts when the data required to populate
the different health states within a model is not available from a single study.
Cardiovascular disease (CVD) encompasses a number of distinct but related conditions including
angina, heart attack, stroke, transient ischaemic attack, peripheral arterial disease and peripheral
vascular disease. Depending on the intervention under evaluation, an economic model in CVD would
typically include health states for a number or all of these sub-conditions and events.[1,2] If the
intervention is for primary prevention of CVD, individuals would enter the model with no history of
CVD and the events modelled would be first ever CV events.[3] Conversely, if evaluating a secondary
intervention, individuals would enter the model with a history of one or more CV conditions and the
events modelled would include subsequent CV events.[2] As individuals with a history of one CV
condition are at high risk of developing another CV condition, secondary prevention models can
and heart attacks are frequently fatal thus a lifetime horizon is required to quantifying the benefits
associated with avoiding these.[4] While CV events have a large detrimental effect on HRQoL during
the period immediately following the event, the magnitude of the initial detriment may diminish over
time. Consequently CV health states are frequently defined to differentiate between the first year and
subsequent years after the event.[1]
Studies exploring the HSUVs associated with coronary heart disease and related conditions are
generally conducted in individuals who have recently experienced just one of the CV events. The
inclusion criteria frequently exclude individuals who have a history of the other related conditions. For
example, studies exploring the effect of heart attacks may exclude individuals with a history of stroke.
Long term data describing changes in HRQoL beyond the immediate period following a CV event are
also scarce. These limitations in the evidence base make it difficult to obtain HSUVs for the numerous
health states in CVD models, many of which include co-morbidities and different histories.
The objective of this study is to estimate HSUVs which can be used to populate the most frequently
defined health states used in conventional CVD models. Data collected during the Health Survey for
England (HSE) provide an opportunity to explore the HRQoL reported by individuals in the general
population. In particular, there is sufficient detail to investigate if HSUVs differ by age, gender, type
of cardiovascular condition (angina, heart attack or stroke), number of cardiovascular conditions and
time since CV event. While an analysis of US data showed differences between the HSUVs for angina,
heart attack and stroke,[5] to our knowledge, this is the first publication which provides all these data
from a single source for a UK population and also shows a change in HSUVs over time.
METHODS
Health Survey for England
The Health Survey for England (HSE) is an annual nationwide survey which uses a random sample of
the population living in private households in England.[6-7] The surveys conducted in 2003 (N =
angina, heart attack or stroke. The positive responses (i.e. “yes”) to the questions “doctor diagnosed
angina”; “doctor diagnosed heart attack” or “doctor diagnosed stroke” were used to identify individuals
who had a history of CVD. Given a doctor’s diagnosis of CVD, the positive responses to the questions
“angina in the last year”, “heart attack in the last year”, “stroke in the last year”, were used to identify
individuals who had experienced a CV event in the previous 12 months. These responses were then
used together with positive responses to the questions “ever had angina”, “ever had a heart attack” or
“ever had a stroke”, and a doctor’s diagnosis, to identify individuals who had a history of a CV
condition prior to the previous 12 months.
These data allow us to estimate EQ-5D scores for health states defined in both primary prevention
models (no history of CVD; angina, heart attack or stroke within the previous 12 months given a
history of just one CV condition; angina, heart attack or stroke but no event within the previous 12
months given a history of just one CV condition), and secondary prevention models (given a history of
more than one CV condition, angina, heart attack or stroke within the previous 12 months given a
history of more than one CV condition; angina, heart attack or stroke but no event within the previous
12 months given a history of more than one CV condition).
The EQ-5D preference-based instrument
A random sample of the HSE respondents were asked to complete the EuroQol questionnaire (N =
26,679).[8] This is a generic preference-based measure of health commonly used to obtain health state
valuations. It has five health dimensions with three levels each describing a total of 243 health states.
Patients complete a one page questionnaire to assign them to a health state and the preference-weighted
algorithm is then applied to obtain the corresponding EQ-5D index score. The weights for the EQ-5D
preference-based index used in the current study were obtained (based on time trade off valuations)
from the UK general public.[9] The index covers the range -0.594 to 1 whereby -0.594 represents the
most severe impairment on all five dimensions and 1 represents no problems on any dimension. The
minimal important difference (MID), defined as the smallest difference in score which patients
perceive as beneficial, is |0.074|.[10] The EQ-5D has to be completed by patients with different health
Statistical methods
Standard descriptive techniques were used (mean, range, standard error) and the significance of any
potential difference in mean EQ-5D values for either gender, presence of CVD, type of CV condition,
or time since event was assessed using independent t-tests (p = 0.05). The EQ-5D index was regressed
onto age, sex and history of CVD using ordinary least square (OLS) techniques. The model is of the
form:
EQ = β + β1xi + β2yi + β3zi + ε whereby
EQ represents the EQ-5D preference-based index, i represents individual respondents, β represents the
vector of unknown variables, x represents the vector of demographs (age and sex), y represents the
vector of health conditions (given a history of just one CV condition: angina within the previous year,
heart attack within the previous year, stroke within the previous year, angina prior to the previous year,
heart attack prior to the previous year, stroke prior to the previous year; given a history of greater than
one CV condition: angina within the previous year, heart attack within the previous year, stroke within
the previous year, angina prior to the previous year, heart attack prior to the previous year, stroke prior
to the previous year), z represents the vector of cross-products and ε represents the stochastic error term
of the regression (the residual).
History of CVD and sex were entered as dummy variables with zero representing no history of a CV
condition and female respectively. As no history of CVD was the reference category a negative
coefficient was expected for the regression coefficients for the various health conditions. Based on
evidence in the literature suggesting males have a higher QoL than females, the coefficient for sex was
expected to be positive.
Analyses were performed in SPSS (v12) and the models were constructed in STATA (v6). Models
using the mean error (ME), the mean absolute error (MAE), the root mean squared error (RMSE) and
the proportion of values within the MID.[10] As we were interested in estimating mean cohort values
to populate health states within a model as opposed to individual patient level values, the model was
also assessed in terms of ability to predict mean values for sub-groups (age, history of CV condition(s)
and time since event).
RESULTS
The mean age of all participants with EQ-5D data (n = 26,679) is 48 years (range 16-98) and 44%
(11,837) are male. The mean age of respondents (n = 1,599) who report a doctor’s diagnosis of CVD is
68 years (range 19-97) and 56% (897/1599) are male. The prevalence of CVD is low below the age of
50 years (<1%) compared to prevalence in the older group (14%), and is higher in males than females
of the same age reflecting the increased risks in these cohorts. The mean duration of time since a
doctor’s diagnosis of CVD is 10 years (median: 10 years).
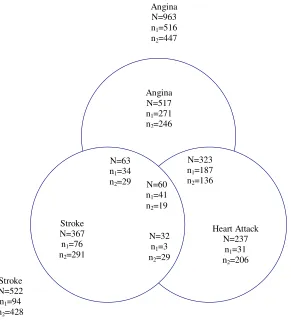
The data were sub-grouped according to type and history of CV conditions: just angina, just heart
attack, just stroke, or any combination of these (Figure 1). Of the 1,599 with a doctor’s diagnosis of
CVD, 963 (57% male) have a history of angina, 652 (67% male) have a history of a heart attack and
522 have a history of a stroke (49% male). 63 (53% male) have a history of both angina and stroke,
323 (72% male) have a history of both angina and heart attack, 32 (59% male) have a history of both a
heart attack and a stroke, and 60 (72% male) have a history of all three conditions. 643/1599 (56%
male) of individuals with a history of CVD report they had at least one event in the previous 12
months. For angina, the majority (516/963) reported an event within the previous 12 months, but for
heart attack and stroke this was 94/428 and 67/585 respectively.
INSERT Figure 1: Number of respondents with a doctor’s diagnosis of CVD sub-grouped by
Health state utility values: univariate results
The EQ-5D scores cover the full range (mean: 0.860; range: -0.59 to 1) and 58% (15409/26679) score
the maximum value of 1. There is a significant difference (Table 1) in the mean EQ-5D scores for
males compared with females (males EQ-5D = 0.87, females EQ-5D = 0.850; p <0.001). There is also
a significant difference (p <0.001) in the mean EQ-5D scores for those with no history of CVD (EQ-5D
= 0.870) compared with those with a history of CVD (EQ-5D = 0.650), and in those who reported an
event within the previous 12 month period (EQ-5D = 0.589) compared with those who experienced an
event prior to this (EQ-5D = 0.716; p <0.001). There is a trend in the data (Figure 2) suggesting CVD
has a larger detriment on HSUVs for younger aged cohorts when compared to individuals with no
history of CVD, particularly for individuals who reported an event within the previous 12 months.
INSERT Table 1: Mean EQ-5D scores sub-grouped by type and number of CV conditions
There is a significant difference in the mean HSUV for individuals with a history of one CV condition
(N = 1,121; EQ-5D = 0.691) compared with those with a history of more than one CV condition (N =
478; EQ-5D = 0.604, p <0.001). The mean HSUVs for individuals with a history of just angina (n =
517), just heart attack (n = 237) or just stroke (n = 367) are 0.692, 0.740 and 0.660 respectively. For
individuals with a history of more than one condition, the mean HSUVs for individuals with angina (n
= 446), heart attack (n = 415) and stroke (n = 155) are 0.609, 0.605 and 0.562 respectively.
When sub-grouping according to time since the last CV event, there is a significant difference in the
HSUVs for individuals who report at least one CV event in the previous 12 months (n = 643, mean
EQ-5D = 0.590) compared to those who report a CV event prior to this (n=956, mean EQ-EQ-5D = 0.716; p
<0.001). For individuals who reported just one event in the previous 12 months (N=610; EQ-5D =
0.597), there is a significant difference in the mean HSUVs for individuals with a history of just one
CV condition (N = 378; EQ-5D = 0.626) compared with those with a history of more than one CV
INSERT Figure 2: Mean HSUVs sub-grouped by time since CV event
Exploring the relationship between HSUVs and clinical events
The results of the OLS multivariate regression between the EQ-5D preference-based index, history of
CVD (either angina, heart attack or stroke given a history of just one CV condition; and either angina,
heart attack or stroke given a history of more than one CV condition) and time since the most recent
event (either within the previous 12 months or prior to the previous 12 months) is provided in Table 2.
INSERT Table 2: Results of the OLS multivariate regression showing the relationship
between the EQ-5D preference-based index, patient characteristics, type and time of reported CV
events
With regard to the effect of the clinical events, the coefficients are significant and negative for all
events reported during the previous 12 months, illustrating the large detrimental effect on QoL during
the first 12 months after an event. All coefficients for the health states describing no event reported
within the previous 12 months are also significant and negative, showing there is a long term
detrimental effect beyond the initial period after an event. The coefficients for the health states for
individuals with greater than one CV condition are also larger in magnitude than the corresponding
data for individuals with a history of just one CV condition demonstrating the additional detriment
associated with a history of more than one CV condition. For individuals with a history of just one CV
condition, angina has the largest detrimental effect during the first 12 months (-0.173), heart attack has
the smallest effect (-0.018), and for individuals with a history of more than one CV condition, angina
has the largest detriment on QoL (-0.308).
Looking at the predicted HSUVs for the full dataset, the scores (Table 2) range from 0.035 to 0.962
and RMSE of 0.215, just 31% of values are predicted within the MID. However, as the results are to
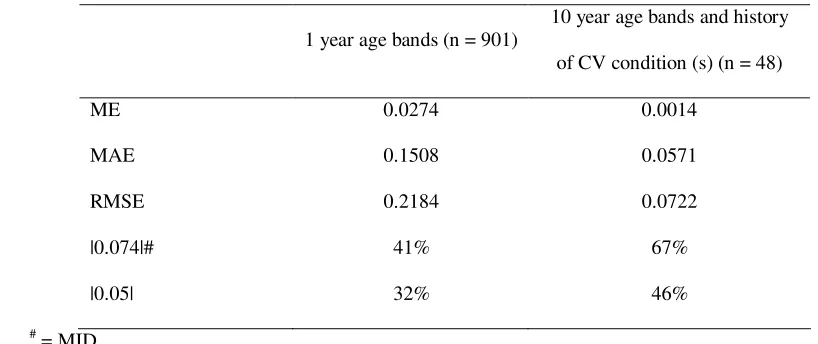
be used to populate a cohort level model, we are more interested in the model’s ability to predict mean
health state values accurately. When sub-grouping by one year age bands (n = 901) and by 10 year age
bands (Table 3) taking into account history of CVD disease (n = 48), the predicted values have a ME
(MAE, RMSE) of 0.037 (0.151, 0.218) and 0.001 (0.057, 0.072) respectively with 41% and 67% of
values correct to within the MID (|0.074|). Similarly, when predicting the mean EQ-5D scores for the
sub-groups split by health condition and time since event (Table 4), the model predicts 12/13) of mean
values within the MID.[10]
INSERT: Table 3: Observed and predicted mean EQ-5D scores for the 13 health states defined
by type of CV history and time since event
INSERT: Table 4: Errors in predicted values for sub-groups of data
DISCUSSION
This study is the first to use a single data source (N = 26,679) in the UK to obtain HSUVs for health
states most frequently used in CVD economic models, taking into account both the time since the most
recent event and history of CV condition(s). Our results show there is a significant difference (p
<0.05) in the EQ-5D scores according to age, sex, CV history, time since CV event, and both the type
and number of CV condition(s). The regression model will enable analysts to populate health states in
economic models assessing primary prevention interventions using a baseline quality of life adjusted
for age and sex from individuals with no history of CVD, and health states in economic models
assessing secondary prevention interventions where individuals enter the model with a reduction in
quality of life associated with the long term effects of CVD. We provide additional information to
There are, however, limitations with the dataset which may have implications with regard to the
generalisability of the results. We use the self-reported responses to a doctor’s diagnosis of CV
disease, time of event (i.e. within the previous 12 months or prior to this), and the number and type of
CV condition. This will inevitably introduce a degree of uncertainty in the results generated. In
addition, HSE samples exclude individuals in nursing homes or hospitals. This may introduce a bias as
individuals in private households are likely to be more independent, and the time since the last event is
likely to be longer when compared to counterparts in residential homes or hospitals.
Our data show HSUVs for individuals with a history of angina or heart attack range from 0.56 to 0.77
or 0.53 to 0.74 respectively depending on the time since previous event and the history of other CV
conditions. These data are comparable with values reported in the literature: EQ-5D = 0.50 for patients
(n = 188) with refractory angina,[11] EQ-5D = 0.67 at baseline and 0.74 at 12 months for unstable
angina/non ST-segment elevation myocardial infarction,[12] and EQ-5D = 0.683 and 0.718
respectively at six weeks and one year after discharge from hospital in patients experiencing a heart
attack.[13] The existing evidence describing HSUVs for stroke are more diverse. One study reports
values ranging from EQ-5D = 0.33 for patients (n=43) on discharge to a care home to EQ-5D = 0.60
for patients (n = 50) 12 months after discharge to their own home.[14] A second study reports mean
values ranging from EQ-5D = 0.5907 at 6 weeks after stroke to EQ-5D = 0.6510 at 12 months after
discharge (n = 153) for patients randomised to a stroke unit (n = 52), a stroke team (n = 152) or
domiciliary care (n = 153).[15] However, as observed in our data (EQ-5D range: 0.417 (CI: 0.567,
0.715) to 0.668 (CI: 0.632, 0.704), there was a large variation (sd > 0.30) in the HSUVs in both studies.
The data were sub-grouped according to history of different CV conditions: just angina, just heart
attack, just stroke, or a combination of these (Figure 2). While heart attacks and strokes are distinct
time constrained medical events, angina is an ongoing condition characterised by periods of pain in the
chest area. The condition encompasses a wide spectrum and severity ranges from mild discomfort on
exercising to severe pain requiring urgent medical attention. As the majority of CV models do not
define different health states to differentiate between the different classes of angina, for the purpose of
this exercise, we identified individuals with a history of angina by using the positive response to a
by severity prevalence in the general population, this does introduce some ambiguity by what is meant
by “experienced angina within the previous 12 months”.
It is common for EQ-5D index scores to exhibit a ceiling effect, with a significant number of
respondents rating themselves as being in full health, i.e. responses of 11111 on the original
questionnaire give a preference-based tariff score of 1. To account for the non-linear distribution of the
data, we explored Tobit and censored least absolute deviation (CLAD) models with upper censoring at
1.0 (results not shown). However, we found the OLS model we report was more accurate in predicting
HSUVs than either the Tobit or CLAD models obtained.
CONCLUSION
While there are limitations with the sample used in the current study, the results show HSUVs differ by
age, sex, type of CV condition, time since CV event and the number of concurrent CV conditions. The
results of the regressions will enable analysts to populate the most frequently defined health states in
ACKNOWLEDGEMENT
We are grateful to Health Survey for England for allowing us access to the data used in this study. The
research was based on the Health Survey for England, 2003 and the Health Survey for England 2006,
produced by the Joint Health Surveys Unit of Social and Community Planning and University College
London, sponsored by the Department of Health, and supplied by the UK Data Archive. The data are
REFERENCES
1. Ara R, Pandor A, Stevens J, Rees A, Rafia R. Early high-dose lipid-lowering therapy to avoid
cardiac events: a systematic review and economic evaluation. Health Technol Assess. 2009
Jul;13(34):1-118.
2. Ara R, Pandor A, Tumur I, Paisley S, Duenas A, Williams R, Rees A, Wilkinson A,
Durrington P, Chilcott J. Cost effectiveness of ezetimibe in patients with cardiovascular disease and
statin intolerance or contraindications: a Markov model. Am J Cardiovasc Drugs. 2008;8(6):419-27.
3. Ward S, Lloyd Jones M, Pandor A, Holmes M, Ara R, Ryan A, Yeo W, Payne N. A
systematic review and economic evaluation of statins for the prevention of coronary events. Health
Technol Assess. 2007 Apr;11(14):1-160, iii-iv. Review.
4. National Institute of Health and Clinical Excellence. Guide to the methods of Technology
Appraisal. 2008.
5. Sullivan PW, Ghushchyan V. Preference-based EQ-5D index scores for chronic conditions in
the United States. Med Decis Making 2005;26:410-420.
6. Joint Health Surveys Unit of Social and Community Planning Research and University
College London, Health Survey for England, 2003 [computer file]. 3rd Edition. Colchester, Essex: UK
Data Archive [distributor], 2005. SN: 5098.
7. Joint Health Surveys Unit of Social and Community Planning Research and University
College London, Health Survey for England, 2006 [computer file]. 3rd Edition. Colchester, Essex: UK
Data Archive [distributor], 2008. SN: 5809.
8. EuroQol Group. EuroQol-a new facility for the measurement of health-related quality of life.
Health Policy. 1990;16:199–208.
9. Dolan P, Gudex C, Kind P, Williams A. The time trade-off method: results from a general
population study. Health Econ. 1996;5(2):141–54.
10. Walters SJ, Brazier JE. Comparison of the minimally important difference for two health state
utility measures: EQ-5D and SF-6D Quality of Life Research (2005) 14:1523–1532.
11. Campbell HE, Tait S, Buxton MJ, Sharples LD, Cain N, Schofield PM, Wallwork J. A UK
trial-based cost-utility analysis of transmyocardial laser revascularization compared to continued
medical therapy for treatment of refractory angina pectoris European Journal of Cardio-thoracic
12. Kim J, Henderson RA, Pocock SJ, Clayton T, Sculpher MJ, Fox KAA and RITA-3 Trial
Investigators. Health-related quality of life after interventional or conservative strategy in patients with
unstable angina or non–ST-segment elevation myocardial infarction: One-year results of the third
randomized intervention trial of unstable angina (RITA-3) J. Am. Coll. Cardiol. 2005;45;221-228.
13. Lacey EA, Walters SJ. Continuing inequality: gender and social class influences on self
perceived health after a heart attack J. Epidemiol. Community Health 2003;57;622-627.
14. Leeds L, Meara J, Hobson P. The impact of discharge to a care home on longer term stroke
outcomes. Clinical Rehabilitation 2004; 18: 924-928.
15. Patel A, Knapp M, Perez I, Evans A, Kalra L, Alternative Strategies for Stroke Care
Cost-Effectiveness and Cost-Utility Analyses From a Prospective Randomized Controlled Trial Stroke.
Figure 1: Number of respondents with a doctor’s diagnosis of CVD (N = 1,599) sub-grouped
by history of condition and time since last event
Heart Attack N=645 N=66 Angina N=517 n1=271
n2=246
Heart Attack N=237
n1=31
n2=206
Stroke N=367 n1=76
n2=291
N=63 n1=34
n2=29
N=32 n1=3
n2=29
N=323 n1=187
n2=136
N=60 n1=41
n2=19
Heart Attack N=652
n1=67
n2=585
Stroke N=522 n1=94
n2=428
N = number of individuals with a doctors diagnosis of the condition at any time n1 = number of individuals experiencing an event in the previous 12 months
n2 = number of individuals not experiencing an event in the previous 12 months
Angina N=963 n1=516
Figure 2a: Mean EQ-5D scores sub-grouped by history of CVD and time since CV 0 0.2 0.4 0.6 0.8 1
50 55 60 65 70 75 80 85 90
Age (years) M ea n E Q -5 D s co re
No CVD CV Event (t < 1 year) CV Event (t >1 year)
Figure 2b: Mean EQ-5D scores sub-grouped by history of CVD and number of CV conditions
0 0.2 0.4 0.6 0.8 1
50 55 60 65 70 75 80 85 90
Age (years) M ea n E Q -5 D s co re
[image:21.595.90.504.399.630.2]Table 1: Mean EQ-5D scores sub-grouped by type and number of CV conditions
1
Sub-group
EQ-5D
N mean LCI UCI
p-value
Male 11,837 0.8720 0.8680 0.8759 <0.001
Female 14,842 0.8496 0.8459 0.8534
No history of CVD 25,080 0.8719 0.8692 0.8746 <0.001
History of any CVD (t = ever) 1,599 0.6653 0.6499 0.6806
History of CVD and CV event < 12 months 640 0.5894 0.5641 0.6147 <0.001
History of CVD and no CV event < 12 months 956 0.7161 0.6975 0.7346
Sub-grouped by the number of CV conditions and time since event
History of just one CV condition 1,121 0.6909 0.6734 0.7083 <0.001
History of > one CV condition 478 0.6040 0.5737 0.6255
History of just one CV condition, and a CV event < 12 months 378 0.6258 0.5941 0.6576 <0.005
History of > one CV condition, and a CV event < 12 months 232 0.5500 0.5081 0.5920
Individuals with a history of just one CV condition, sub-grouped by condition
(as defined by health states in a primary prevention model)
History of just angina, angina < 12 months 271 0.6148 0.5770 0.6526 <0.001
History of just angina, no angina < 12 months 246 0.7748 0.7451 0.8046
History of just heart attack, heart attack < 12 months 31 0.7213 0.6303 0.8123 0.700
History of just heart attack, no heart attack < 12 months 206 0.7418 0.7033 0.7803
History of just stroke, stroke < 12 months 76 0.6262 0.5515 0.7010 0.301
History of just stroke, no stroke < 12 months 291 0.6684 0.6323 0.7044
Individuals with a history of more than one CV condition, sub-grouped by condition
(as defined by health states in a secondary prevention model)
History of angina + other CV condition(s), angina < 12 months 213 0.5563 0.5127 0.5999 <0.001
History of angina + other condition(s), angina < 12 months, no
event < 12 months
History of heart attack + other condition(s), heart attack < 12
months
11 0.5250 0.3038 0.7462 0.113
History of heart attack + other condition(s), no event < 12
months
184 0.6847 0.6378 0.7316
History of stroke + other condition(s), stroke < 12 months 8 0.4170 0.5668 0.7146 0.072
History of stroke + other condition(s), no event < 12 months 77 0.6407 0.1032 0.7308
Comparing the effect on HSUVs for events within the last 12 months, sub-grouped by history of number of CV
conditions
History of just angina, angina < 12 months 213 0.5563 0.5127 0.5999 <0.05
History of angina + other CV condition(s), angina < 12 months 271 0.6148 0.5770 0.6526
History just heart attack, heart attack < 12 months 11 0.5250 0.3038 0.7462 <0.005
History heart attack + other CV condition(s), heart attack < 12
months
237 0.7391 0.7038 0.7744
History just stroke, stroke < 12 months 76 0.6262 0.5515 0.7010 0.170
History stroke + other CV condition(s), stroke < 12 months 155 0.5618 0.5082 0.6155
2
3
4
5
Table 2: Results of the models exploring the relationship between the EQ-5D preference-based index,
7
patient characteristics, type and time of reported CV events
8
OLS
Beta se Sig
Male
0.0246479 0.0027 **
Age
-0.0008459 0.0004 *
Age2
-0.0000224 0.0000 **
Age*CVD
-0.0001961 0.0003 a History of just angina, angina < 12 months
-0.1726541 0.0268 **
History of just angina, no angina < 12 months
-0.0184099 0.0271 b History of just heart attack, heart attack < 12 months
-0.0864901 0.0446 *
History of just heart attack, no heart attack < 12 months
-0.0595563 0.0274 *
History of just stroke, stroke < 12 months
-0.1609510 0.0336 **
History of just stroke, no stroke < 12 months
-0.1255921 0.0262 **
History of angina + other CV condition(s), angina < 12 months
-0.2370623 0.0278 **
History of angina + other condition(s), no event < 12 months
-0.0801248 0.0300 **
History of heart attack + other condition(s), heart attack < 12 months
-0.2560437 0.0689 **
History of heart attack + other condition(s), no event < 12 months~
History of stroke + other condition(s), stroke < 12 months
-0.3324484 0.0805 **
History of stroke + other condition(s), no event < 12 months
-0.0634942 0.0306 *
Constant
0.9569784 0.0089 **
min 0.0353
mean 0.8727
max 0.9624
Adj. R2 0.2138
Errors in predicted values for individual level patient (n = 26,679) responses
ME 0.0131
MAE 0.1446
RMSE 0.2151
|0.05| 15%
Significance: * p <0.05; ** p<0.01, a p = 0.574, b p = 0.497, cp = 0.639; # = MID, ~ as history of angina
9
+ other condition(s), no event < 12 months. See Appendix 1 for variance covariance matrix.
10
Table 3: Errors in predicted values for sub-groups of data
14
1 year age bands (n = 901)
10 year age bands and history
of CV condition (s) (n = 48)
ME 0.0274 0.0014
MAE 0.1508 0.0571
RMSE 0.2184 0.0722
|0.074|# 41% 67%
|0.05| 32% 46%
#
= MID
15
16
17
Table 4: Observed and predicted mean EQ-5D scores for the 13 health states defined by type of CV history and
19
time since event
20
n Observed Predicted Error
No history of CVD 25,080 0.872 0.878 0.007
history of just angina, angina < 12 months 271 0.615 0.621 0.006
history of just angina, no angina < 12 months 246 0.775 0.778 0.003
history of just heart attack, heart attack < 12 months 31 0.721 0.724 0.003
history of just heart attack, no heart attack < 12 months 206 0.742 0.745 0.004
history of just stroke, stroke < 12 months 76 0.626 0.632 0.006
history of just stroke, no stroke < 12 months 291 0.668 0.673 0.005
history of angina + other CV condition(s), angina < 12 months 213 0.556 0.559 0.003
history of angina + other condition(s), angina < 12 months, no event < 12 months 184 0.715 0.714 -0.001
history of heart attack + other condition(s), heart attack < 12 months 11 0.525 0.529 0.004
history of heart attack + other condition(s), no event < 12 months 184 0.685 0.715 0.031
history of stroke + other condition(s), stroke < 12 months 8 0.417 0.419 0.002
history of stroke + other condition(s), no event < 12 months 77 0.641 0.723 0.082
MAE 0.012
RMSE 0.025
<|0.074| 12/13 92%
<|0.05| 12/13 92%
#
= MID
21
22
23
24
Appendix: Var-Covar Matrix used for generating samples from the regression
26
sex age age2 agecv rjang nrjang rjhrt nrjhrt rjstr nrjstr rmang cnrmamh
Sex 0.0000070
Age 0.0000000 0.0000002
Age^2 0.0000000 0.0000000 0.0000000
Age*CVD 0.0000000 0.0000000 0.0000000 0.0000001 The next six rows relate to health states with a history of just one CV condition rjang 0.0000001 -0.0000014 0.0000000 -0.0000081 0.0007190
nrjang -0.0000008 -0.0000014 0.0000000 -0.0000081 0.0005480 0.0007340
rjhrt -0.0000018 -0.0000014 0.0000000 -0.0000078 0.0005290 0.0005280 0.0019920
nrjhrt -0.0000017 -0.0000014 0.0000000 -0.0000080 0.0005390 0.0005380 0.0005190 0.0007520
rjstr 0.0000003 -0.0000012 0.0000000 -0.0000080 0.0005370 0.0005360 0.0005170 0.0005270 0.0011300
nrjstr 0.0000001 -0.0000013 0.0000000 -0.0000080 0.0005380 0.0005370 0.0005180 0.0005280 0.0005260 0.0006850 The next five rows relate to health states with a history of > one CV condition
rmang -0.0000012 -0.0000014 0.0000000 -0.0000082 0.0005520 0.0005510 0.0005320 0.0005420 0.0005400 0.0005410 0.0007700
nrmang -0.0000021 -0.0000014 0.0000000 -0.0000082 0.0005550 0.0005540 0.0005340 0.0005440 0.0005420 0.0005430 0.0005570 0.0008980 rmhrt 0.0000006 -0.0000013 0.0000000 -0.0000083 0.0005600 0.0005590 0.0005390 0.0005490 0.0005480 0.0005490 0.0005630 0.0005650 rmstr -0.0000023 -0.0000010 0.0000000 -0.0000093 0.0006330 0.0006310 0.0006090 0.0006210 0.0006190 0.0006200 0.0006360 0.0006390 nrmstr 0.0000012 0.0000000 0.0000000 -0.0000002 0.0000130 0.0000120 0.0000120 0.0000120 0.0000120 0.0000120 0.0000120 -0.0003260 Constant -0.0000025 -0.0000032 0.0000000 -0.0000004 0.0000240 0.0000240 0.0000260 0.0000250 0.0000200 0.0000230 0.0000250 0.0000260
History of just one CV condition: Rjang = history of just angina, angina < 12 months, nrjang = history of just
27
angina, no angina < 12 months, rjhrt = history of just heart attack, heart attack < 12 months, nrjhrt = history of
28
just heart attack, no heart attack < 12 months, rjstr = history of just stroke, stroke < 12 months, nrjstr = history
29
of just stroke, no stroke < 12 months
30
History of > one CV condition: rmang = history of angina + other CV condition(s), angina < 12 months,
31
nrmang = history of angina + other condition(s), angina < 12 months, no event < 12 months, rmhrt = history of
32
heart attack + other condition(s), heart attack < 12 months, rmstr = history of stroke + other condition(s), stroke
33
< 12 months, nrmstr = history of stroke + other condition(s), no event < 12 months