University of Southern Queensland
Faculty of Engineering and Surveying
USB Camera Pedestrian Counting
A dissertation submitted by
Jeremy Bruce Duncan
in fulfilment of the requirements of
Courses ENG4111 and 4112 Research Project
towards the degree of
Bachelor of Engineering (Elec)
2
University of Southern Queensland
Faculty of Engineering and Surveying
ENG4111 & ENG4112 Research Project
LIMITATIONS OF USE
The Council of the University of Southern Queensland, its Faculty of Engineering and Surveying, and the staff of the University of Southern Queensland, do not accept any responsibility for the truth, accuracy or completeness of material contained within or associated with this dissertation.
Persons using all or any part of this material do so at their own risk, and not at the risk of the Council of the University of Southern Queensland, its Faculty of Engineering and Surveying or the staff of the University of Southern Queensland.
This dissertation reports an educational exercise and has no purpose or validity beyond this exercise. The sole purpose of the course pair entitled "Research Project" is to contribute to the overall education within the student’s chosen degree program. This document, the associated hardware, software, drawings, and other material set out in the associated appendices should not be used for any other purpose: if they are so used, it is entirely at the risk of the user.
Prof Frank Bullen
Dean
3
Certification
I certify that the ideas, designs and experimental work, results, analyses and conclusions set out in this dissertation are entirely my own effort, except where otherwise indicated and acknowledged.
I further certify that the work is original and has not been previously submitted for assessment in any other course or institution, except where specifically stated.
Jeremy Duncan
Student Number: 0050012967
___________________________________
signature
___________________________________
4
Table of Contents
1 ABSTRACT ... 8
2 ACKNOWLEDGEMENTS ... 9
3 LIST OF FIGURES ... 10
4 INTRODUCTION ... 12
5 PROJECT OBJECTIVES ... 13
6 BACKGROUND ... 14
6.1 Literature Review ... 14
6.1.1 Aim ... 14
6.1.2 Reviews ... 14
6.2 Summary of People Tracking Methods ... 23
6.2.1 People Tracking Algorithms ... 23
6.2.2 A Linear Prediction Tracker... 23
6.2.3 Head Detectors ... 24
6.2.4 The Leeds People Tracker ... 24
6.2.5 The Reading People Tracker ... 25
6.3 Motion Detection ... 27
6.3.1 Frame Difference Method ... 27
6.3.2 Average Filter Method ... 27
6.3.3 Median Filter Method ... 28
5
6.3.5 Kalman Filter ... 29
6.3.6 Other Filters ... 29
6.4 Tracking Methods ... 30
6.4.1 Active Shape Tracking ... 30
6.4.2 Region Tracking ... 30
6.4.3 Mean Shift Tracking ... 31
6.4.4 Feature Tracking ... 31
6.5 Research Summary ... 33
6.6 Initial System Design ... 35
6.7 Programming Language Selection ... 38
6.8 Project Resources ... 42
6.9 Basic Terminology ... 42
7 DESIGN AND BUILD ... 43
7.1 Section Overview ... 43
7.2 Design and Build Method ... 44
7.3 Image Acquisition ... 44
7.4 Greyscale Conversion ... 48
7.5 The Background Image ... 50
7.5.1 The Ghost Filter Variable... 53
7.6 The Difference Image ... 53
6
7.7.1 Pixelator Code ... 60
7.8 Software Engineering ... 62
7.8.1 Multithreading Trials ... 62
7.8.2 Structured Programming ... 63
7.9 Object Growing ... 63
7.9.1 Region Growing by Seeding ... 65
7.9.2 Line by Line Region Growing ... 68
7.9.3 Line Blob Formation ... 69
7.9.4 Blob Merging ... 71
7.9.5 Region Formation ... 72
7.9.6 Region Growing Results ... 78
7.10 Basic Object Tracking ... 82
7.11 Final Code ... 88
7.12 Practical Deployment ... 128
7.13 Linux Deployment ... 130
7.14 Other Applications ... 131
8 CONCLUSIONS ... 132
8.1 Result Project Achievements ... 132
8.2 Recommendations For Future Work ... 137
8.2.1 Difference Image Improvements... 137
7
8.2.3 Occlusion Handling Routines ... 139
8.2.4 Camera Control ... 139
8.2.5 Additional Tracking Modules ... 140
8.2.6 Software Improvements ... 140
8.2.7 Future Research Topics ... 142
8.2.8 Implement The Reading People Tracker... 142
9 LIST OF REFERENCES ... 143
10 APPENDIX A – PROJECT SPECIFICATION ... 149
11 APPENDIX B – POWER POINT PRESENTATION ... 150
8
1
ABSTRACT
The aim of this project was to implement a pedestrian counting system using a PC and USB Camera as the primary hardware. The software developed will not be ready for complete deployment due to time limitations and requires further development before it is reliable and accurate enough to be used for pedestrian counting. However, the object motion detector has been fully developed and is ready to be incorporated into future projects and currently runs at 26 frames per second.
The current program captures frames in real time from a USB camera. A motion image is created using an approximate median filter. A motion image is then generated using differencing. Moving objects are clustered using a region growing algorithm. These motion objects are then displayed on screen. Tracking at this stage consists of simple size and position matching combined with aging of the objects to increment a pedestrian counter.
9
2
ACKNOWLEDGEMENTS
Many thanks go to John Billingsley of the University of Southern Queensland who has assisted with the project and acted as the author’s supervisor.
10
3
LIST OF FIGURES
FIGURE 1 - READING TRACKER MODULE DESCRIPTION 25
FIGURE 2 - READING PEOPLE TRACKER ALGORITHM 26
FIGURE 3 - ALGORITHM OVERVIEW 35
FIGURE 4 - APPROXIMATE MEDIAN FILTER 35
FIGURE 5 – INITIAL FEATURE TRACKER DESIGN 37
FIGURE 6 –OSNEWS LANGUAGE PERFORMANCE COMPARISON 40
FIGURE 7- PIXEL TO ARRAY LAYOUT 46
FIGURE 8 - 1ST WEBCAM CAPTURE 47
FIGURE 9 - DIFFERENCE IMAGE EXAMPLE 1 54
FIGURE 10 - DIFFERENCE IMAGE EXAMPLE 2 55
FIGURE 11 - DIFFERENCE IMAGE EXAMPLE 3 56
FIGURE 12 - SEGREGATION IN THE DIFFERENCE IMAGE 57
FIGURE 13 - PIXELATOR RESULTS 58
FIGURE 14 - GROWING OBJECTS FROM A DIFFERENCE IMAGE 64
FIGURE 15 - GROSS REGION SEEDING 65
FIGURE 16 - COMPREHENSIVE SEED GROWING 66
FIGURE 17 - PROPOSED SEEDING ALGORITHM 66
FIGURE 18 - ADVANCED REGION GROWING ALGORITHM 68
FIGURE 19 - SIMPLIFIED METHOD FOR GROWING REGIONS 69
FIGURE 20 - LINE BLOBS EXAMPLE 70
FIGURE 21 - ROW SCANNER ALGORITHM 71
FIGURE 22- LINE BLOB COLLISION DETECT 71
FIGURE 23 - LINE BLOB COLLISION LOGIC 72
FIGURE 24 - REGION GROWTH LOGIC TESTS 74
FIGURE 25 - REGION OVERLAP 75
11
FIGURE 27 - REGION GROWTH WITH NO OBJECT OVERLAP 77
FIGURE 28 - REGION GROWTH WITH OBJECT EXPANSION 78
FIGURE 29 - OBJECTS EXAMPLE 1 79
FIGURE 30 - OBJECTS EXAMPLE 2 79
FIGURE 31 - OBJECTS EXAMPLE 3 SHADOW ISSUES 80
FIGURE 32 - OBJECTS EXAMPLE LOWER RESOLUTION 81
FIGURE 33 – INDOOR TRACKING EXAMPLE 1 83
FIGURE 34 - INDOOR TRACKING EXAMPLE 2 84
FIGURE 35 - TRACKING OUTDOORS ISSUES 1 85
FIGURE 36 - TRACKING OUTDOOR ISSUES 2 86
FIGURE 37 - TRACKING OUTDOORS GOOD RESULTS 87
FIGURE 38 - TRACKING OUTDOORS OCCLUSION 87
FIGURE 39 - WINDOWS FORM DESIGN 89
FIGURE 40 - FIELD DEPLOYMENT 129
12
4
INTRODUCTION
The research project’s primary aim is to create a working pedestrian counter which uses a USB camera as its primary input sensing device. A camera would be mounted overlooking the pedestrian pathways and basic statistics such as quantity and frequency of pedestrians would be recorded.
People counting is currently performed manually, or using recorded video which is later played back and once again manually counted, and also by simple sensors(light curtains or pressure pads) which trigger when crossed or are pressed. The original intention was to produce a product for the Toowoomba City Council. The counting of pedestrians was to be used to evaluate if a pathway was to be added or to be upgraded.
13
5
PROJECT OBJECTIVES
The following objectives for the project have been set.
1. Research and identify the most appropriate programming language for the project and develop a working knowledge of the chosen language.
2. Research current theories and algorithms used in the field of vision systems, shape and pattern recognition and object tracking.
3. Design and write the software.
4. Test the software and record the results.
5. If the written program is successful in a basic test environment, trial the system in more difficult conditions, identify flaws, and improve the program resiliency to changes in camera perspective and lighting.
As time permits:
6. Discuss system costs in terms of computer hardware and mounting enclosure required for practical installations.
7. Consider developing the system for linux to lower costs using a cross platform language.
8. Consider using the software for vehicular traffic and the changes to the software required.
14
6
BACKGROUND
6.1
Literature Review
6.1.1 Aim
The aim of this literature review is to identify methods which can be easily implemented within the given timeframe and which will deliver a working person tracker.
6.1.2 Reviews
“Design and Implementation of People Tracking Algorithms for Visual Surveillance Applications” (Siebel, 2000)
Relevance: High – Software and Required Algorithms Referenced and Code Available
Key Terms: Active Shape Model, Region/Blob Based Tracking, Principle Component Analysis, Motion Detector, Active Shape Tracker, Head Detector, Haritaoglu’s W4 System, Background Image, Pixel Difference.
15 resiliency of the software. The main modules are a Motion Detector, a Region Tracker, a Head Detector and an Active Shape Tracker and these modules exchange their results to improve the reliability. Low to medium intensity algorithms are used which is preferable to keep the system real-time. Source code is also available in C++. The tracker is said to be reliable in the presence of occlusion and low image quality. The “Reading People Tracker” developed is an extension of the “Leeds People Tracker”.
“Background Subtraction and Shadow Detection in Grayscale Video Sequences” (Jacques et al, 2005)
Relevance: Medium – algorithms employed are well documented and usable.
Key Terms: Medium Filter, Background Image, Shadow Removal
16 “A Neural Network for Image Background Detection” (Avent & Neal, 1995)
Relevance: Low
Article Summary: This article describes a method for background detection which relies on being to select the colour of the background hence the processing time dedicated to background detection can be significantly reduced. This method is not adaptive and hence is unsuitable for the project.
“A Moving Objects Detection Algorithm Based on Improved Background Subtraction”
Relevance: Medium
Article Summary: This article identifies some of the current methods of motion detection, namely the optical flow method, Consecutive Frame Subtraction and Background Subtraction. It identifies background subtraction as the most effective. Unfortunately due to the poor translation, the article is difficult to understand when it becomes more technical. This article will be explored more fully only if other motion detectors cannot be found. (Niu & Jiang, 2008)
“The Algorithm of Moving Human Body Detection Based On Region Background Modeling” (Fan & Li, 2009)
Relevance: High
17 concern due to the time which will be required to implement it plus its high processing cost which results from this complexity. The steps in the algorithm are clear and show all formulas required. This article also describes some of the current methods of background detection and the relative strengths and weaknesses.
“Universal Serial Bus Device Class Definition for Video Devices Revision 1.1” (Intel Corp et al)
Relevance: Low
Article Summary: This article defines the USB Video Device standard and is primarily directed towards developers. This article was explored to determine what would be required in order to communicate with the USB camera and retrieve images. Further research into Visual Basic shows that the AviCap32.dll will meet the needs of this project.
“Teach Your Old Web Cam New Tricks: Use Video Captures in Your .NET Applications” (Wei Meng)
Relevance: Medium
18 image was successfully captured and saved as a BMP. Further research needs to be performed on how to take this BMP and store it in a matrix for manipulation.
“Tracking People” (Kim & Ranganath, 2002)
Relevance: Low-Medium
Article Summary: Colour based tracking is used in this system. Variable bin widths are used for storing the object histograms. Heuristics are used for issues such as occlusion and a person re-entering a scene. Details are few however and it would be difficult to extract any usable modules from the system.
“Automatic Counting Of Interacting People By Using A Single Uncalibrated Camera” (Velipasalar et al, 2006)
Relevance: Medium Low
19 “Tracking Multiple People for Video Surveillance” (Ali, Indupalli & Boufame)
Relevance: Medium
Article Summary: This system uses Background Subtraction and a Correlation based feature tracking object tracker. It categorises motion detectors as Frame Differencing Techniques, Background Subtraction and Optimal Flow. It categorises object detectors as Region-based tracking, Active-contour-based tracking, Feature-based tracking and Model-Feature-based tracking. To generate blobs, a seeding algorithm is implemented after a motion image has been generated. Exhaustive blob matching is used whereby a blob is checked against all existing blobs and a match is found. It opts for a feature based tracking system and tracks the features by using the Blob Histogram, Motion and Size. It then performs a correlation calculation between all blobs past and present with matches being made based on the highest correlation coefficient.
“Real-Time Tracking of Multiple People Using Continuous Detection” (Beymer & Konlige, 2000)
Relevance: Low
20 “Robust techniques for background subtraction in Urban Traffic Video” (Cheung & Kamath)
Relevance: High
Article Summary: This article compares several background subtraction techniques. In summarises by saying that the Gaussian Mixture method offers the best results, however the Median filter offers similar results and is significantly simpler in construction. The memory consumption of the Median filter is of concern.
“A Kalman Filter Based Background Updating Algorithm Robust To Sharp Illumination Changes” (Segata et al)
Relevance: Medium
Article Summary: This algorithm uses a Kalman filter and tries to address the Kalmans filters inability to deal with global and sharp illumination changes. Methods to measure noise variance are discussed to deal with the issue of pixel saturation.
“Pfinder: Real-Time Tracking Of The Human Body” (Wren et al, 1996)
Relevance: Low-Medium
21 areas are filled with cloth like colouring. The system can only cope with one person in the scene and does not adapt to variation in lighting.
“Tracking Of Pedestrians - Finding And Following Moving Pedestrians In A Video Sequence” (Siken, 2009)
Relevance: Medium
Article Summary: Contains some simple methods for object tracking such as geometric rules and colour tracking. These methods would be unsuitable for tracking multiple objects.
“A Mean-Shift Tracker: Implementations In C++ And Hume” (Wallace, 2005)
Relevance: Medium High
22 “Mean-Shift” (Wikipedia, 2010)
Relevance: Medium-Low
Article Summary: This gives a brief introduction to the mean shift tracking algorithm.
“Accurate Real-Time Object Tracking With Linear Prediction Method” (Yeoh & Abu-Bakar, 2003)
Relevance: Medium-High
Article Summary: This describes a system capable of tracking a single object. It uses edge detection followed by a 2nd order linear predictor-corrector method. It claims to be more accurate than a Kalman type predictor however the tests appear limited.
“Rapid And Robust Human Detection And Tracking Based On Omega-Shape Features” (Li et al, 2009)
Relevance: Medium
23 occlusion and crowded areas and shows a low computation time per detection and track. Details are sparse however regarding implementation.
6.2
Summary of People Tracking Methods
6.2.1 People Tracking Algorithms
Some of the available complete algorithms will now be explained to give an overview of how people tracking has been achieved by various researchers. This listing is far from exhaustive and is only presented to demonstrate some of the more common approaches encountered. It is possible that a hybrid algorithm may be developed from within the modules identified.
6.2.2 A Linear Prediction Tracker
24
6.2.3 Head Detectors
Some trackers focus on the upper part of the body to minimise issues with occlusion. Due to the omega like shape of the head and shoulders, and its nature to be generally at the top of a person like region it can be more easily described. These types of systems are sometimes referred to as Omega detectors. One system encountered using multiple head and shoulder detectors to increase initial detection within an entrance zone followed by a particle filter tracker (Li, 2009).
6.2.4 The Leeds People Tracker
25
6.2.5 The Reading People Tracker
[image:25.595.131.461.260.397.2]This system consists of a motion detector which feeds a region tracker and head detector. Information from both the region tracker and the head detector are passed to an active shape tracker. Two images follow which broadly describes the operation of the Reading people tracker. (Siebel, 2000)
26
27
6.3
Motion Detection
The motion detector section of the software is used to determine where movement is occurring in an image. Various filters can be applied and tradeoffs exist between effectiveness of the algorithm and the computational time required for the filter to run. This section will briefly examine the various motion detectors encountered during the literature research with the aim of selecting the most effective combination of filters to provide an adaptive yet real-time and preferably high frame rate system.
6.3.1 Frame Difference Method
This method looks at the difference between this frame and the next in terms of pixel intensity. This method is sensitive to moving background objects such as trees, camera jitter and is sensitive to the threshold chosen.
|(Pixel of Frame)now – (Pixel of Frame)previous| > Threshold
6.3.2 Average Filter Method
28
6.3.3 Median Filter Method
Each pixel is the median of the last n pixel values.
Pixeln = Median(Pixeln-1,Pixeln-2,...,Pixeln-l)
l = the length of the median filter.
Absolute differencing then follows between the new background and the new frame and in the event the difference is higher than a threshold, a pixel will be classified as moving. A minor improvement to this method could be the removal of pixels identified as moving from within the median filter buffer. These removed pixels could then be replaced by the last valid background pixel. This method will be sensitive to the threshold value and the length of the buffer. The approximate median filter method obtains a similar quality of result, but is reportedly far more efficient (Velipasalar et al,2009).
6.3.4 Running Average Method
Foregroundi-Backgroundi > Threshold
Backgroundi+ 1= α* Foregroundi+ (1 -α) * Backgroundi
The next background image is equal to a constant (α) multiplied by the current image
29 The older backgrounds have less weight. This method requires low levels of memory as it only stores 2 images for its output. (Velipasalar et al, 2009)
6.3.5 Kalman Filter
A Kalman filter method is used to estimate the background. A Kalman filter predicts the future state of a system and corrects that prediction based on the current measurement. It attempts to identify Gaussian noise with a zero mean and remove it. The optimal state of the process is given by “minimizing the variance of the estimation error and constraining the average of the estimated outputs and the average of the measures to be the same”13. The Kalman filter has issues with illumination changes, but low memory requirements and moderate computational complexity (Segata).
6.3.6 Other Filters
30
6.4
Tracking Methods
6.4.1 Active Shape Tracking
Once a moving region is detected, it’s size and shape are assessed. If it falls within a range of acceptable values, a pedestrian model generated using Principle Component Analysis is scaled and fit to the region. Model fitting is achieved by applying a local edge detector between the difference image of the background and the current image. Estimates are made to find the contour of the person within the region. If the shape matches the model within a given tolerance, the object is said to be a person. A second order motion model is used to predict speed and position in the current frame. Repeated measurements made along the Mahalanobis optimal search direction made at the control points of the B-spline are used to predict future positions.
This method has the advantages of speed and medium robustness. Disadvantages are the inability to detect sitting people, issues with groups of people where individual’s outlines are not clear, edge contrast issues, and tracking initialisation errors.(Siebel, 2000)
6.4.2 Region Tracking
31 region. A cost function is used to compare the prediction to the current region. (Siebel, 2000)
6.4.3 Mean Shift Tracking
A simplified explanation of mean shift involves determining a histogram for a region of interest. For each frame, around the region of interest, a zone which shows the closest match is then identified as the new position of the tracked object (Wikipedia, 2010).
6.4.4 Feature Tracking
Tracking features of blobs within a motion image and correlating the past and present blobs can provide basic tracking.
33
6.5
Research Summary
Two issues became immediately apparent to the author during the research phase of the project.
The main issue was the high level of prior knowledge assumed with the majority of the systems developed. While most papers were read with interest, much of the theory had not been previously encountered. The most successful trackers were those aimed towards a more educated audience in terms of software engineering and computer vision systems.
The second issue, which also relates to the first was that of time. While many of the more advanced systems would provide better results, the limited time available for the research project means that selecting methods should be done by identifying well documented and simpler methods, although it is acknowledged that the performance of the system may be inferior.
With these considerations in mind the following options were proposed:
34 encountered during the research contained much content not encountered before within the Bachelor of Electrical Engineering.
2. Attempt to compile and modify the Reading People Tracker. This would involve once again acquiring a working knowledge of C++.
3. Use a motion image followed by a feature based tracker which attempts to match the previous regions to the current regions. Use image histograms, size and position as features. Some limited success has been achieved with this approach, but issues such as occlusion will arise (Ali et al, 2010).
35
6.6
Initial System Design
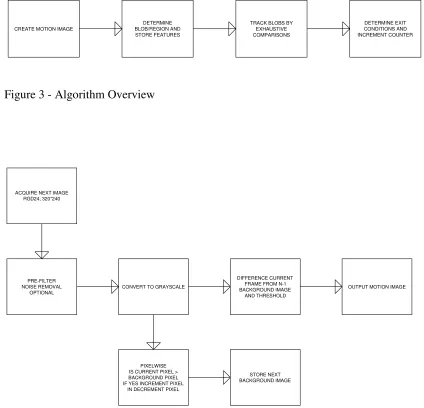
[image:35.595.109.533.214.622.2]An algorithm is proposed and shown below.
Figure 3 - Algorithm Overview
Figure 4 - Approximate Median Filter
CREATE MOTION IMAGE
DETERMINE BLOB/REGION AND STORE FEATURES
TRACK BLOBS BY EXHAUSTIVE COMPARISONS DETERMINE EXIT CONDITIONS AND INCREMENT COUNTER PRE-FILTER NOISE REMOVAL OPTIONAL ACQUIRE NEXT IMAGE
RGD24, 320*240
CONVERT TO GRAYSCALE
DIFFERENCE CURRENT FRAME FROM N-1 BACKGROUND IMAGE
AND THRESHOLD
PIXELWISE IS CURRENT PIXEL > BACKGROUND PIXEL IF YES INCREMENT PIXEL
IN DECREMENT PIXEL
STORE NEXT BACKGROUND IMAGE
36 It assumed that the quality of the motion image will be acceptable. Some experimentation with post and/or pre-filtering may be required to improve the quality of the motion image. A bounding box will be applied to the blob and a region will be extracted. Some fusing/splitting of adjacent blobs may be performed based on characteristics such as width height ratios and proximity.
It is expected that the feature tracker will be computationally more expensive than the motion image section of the program. For this reason a low resolution grayscale image should be used for feature storage, even though higher resolutions are available. Depending on the processing time, the frame size may be increased. Refer to figure 5 on the following page for the algorithm proposed.
Figure 5 – Initial Feature Tracker Design MOTION IMAGE INPUT
REGION BOUND BY ZEROS, DETERMINE HEIGHT AND WIDTH OF
REGION, ASSUME MINIMUM NUMBER OF PIXELS, ID ALL REGIONS
REGION N -GIVE REGION IDENTIFIER,
STORE NO.OFPIXELS, CURRENT X,Y CENTRE,
AND REGION ITSELF
COMPARE WITH ALL PREVIOUSLY STORED REGIONS AND MATCH,
HISTOGRAM CORRELATION, POSITION
CLOSE, SIZE CLOSE
NO MATCH FOUND? MARK AS EXIT, BUT CONTINUE TO STORE FOR N FRAMES
MATCH FOUND?, UPDATE REGION PROFILE
CONTINUE TO NEXT REGION
EXIT CONDITIONS, STORED REGION HAS NO
The authors programming experience was limited to Matlab and programmable logic controllers. Careful selection of a language was needed to ensure that a working product was developed.
A comprehensive review was not performed. Most notably, Java was not trialed. 2 products were primarily investigated to determine the most suitable programming platform. These were Visual Studio 2008 and Matlab Version 7. A free version of Visual Studio 2008 professional was obtained via the Microsoft Dreamspark initiative.
Visual C++ was briefly investigated. There may be a need to call C++ code when speed becomes important. It will be avoided as the learning curve appears steeper. Visual Basic and Matlab provides more managed code, thereby lowering development time.
39 Matlab 7 with the Image Acquisition toolbox was also investigated. Images were acquired, however the frame rate was <10fps. When a frame differencing method was implemented the frame rate dropped to <2fps. It was determined that Matlab would be unsuitable due to its low speed, but could be a good environment for testing Algorithms due to its relative ease of use.
40
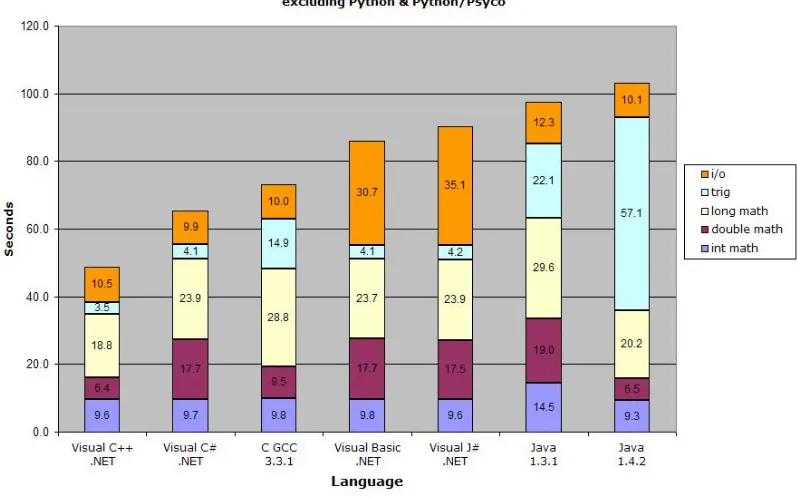
FIGURE 6 –OSNEWS LANGUAGE PERFORMANCE COMPARISON – SOURCE: (OSNEWS,
2009)
Some basic code was written in C++, Basic and Matlab to test each platforms time to completions for a simple for loop which incremented a 32-bit integer. The loop length is 10^8. The Windows system clock was used to estimate time to completion.
Matlab Speed Test Code:
a = 0 d = 0
length = 100000000 for a = 0:length d = d+1; end
[image:40.595.119.518.90.339.2]41 Visual C++ Speed Test Code
int i;
int b;
for ( i = 0 ; i < 100000000 ; i++ ) b = b+1;
Language Time To Completion
MATLAB 40 seconds
VBasic.Net <1 second
VC++ <1 second
It should be noted that compiler options were set as standard, and that Matlab is significantly faster when it uses intrinsic operations as compared to the extrinsic operations shown in the code snippet, however, intrinsic operations would be rare for the pedestrian tracking application.
42 Visual Studio 2008, Visual Basic.Net was selected due to its lower learning curve and sufficient speed. Visual Basic is also used within Citect Scada, Allen Bradley PLCs and Excel which are applications currently used by the author.
6.8
Project Resources
Computer Hardware: Quad Core 2.67GHz, i5 750 Processor, 4Gb Ram, Windows 7 64-bit, 9800GT Video Card with 1Gb Ram.
USB Camera: Logitech
Compiler: Microsoft Visual Studio Professional 2008
6.9
Basic Terminology
Pixel – A single square on a screen which is addressable.
Blobs – A contiguous collection of pixels.
Regions – A collection of blobs.
43
7
DESIGN AND BUILD
7.1
Section Overview
This section will detail the steps taken to arrive at the final version of the pedestrian tracking software. The section headings reflect the path taken during the design and build phase of the project and the issues encountered.
Limited code is included here to show the details of how each stage was accomplished and where that code is not part of the final version of the program. All Visual Basic code is commented to allow those less familiar with the language to grasp the program flow. For each section, program flow diagrams and a written description of the sections purpose is provided.
44
7.2
Design and Build Method
An initial basic design was undertaken by the author during the research phase of the project. During development of the software, the lack of required details shortly became apparent. The approach of the author was to follow the general outline given by the initial design and to grow the missing details. This may be referred to as a top-down approach.
7.3
Image Acquisition
Acquiring an image from the webcam was achieved by using an online tutorial available from http://www.devx.com/dotnet/Article/30375 (Wei Meng, 2010). A windows user form was created, and then the methods outlined in the tutorial were implemented. Some minor modifications occurred as the author did not wish to save video, and only required a single frame captures which are then processed.
45 Microsoft software developers kit for the .net version 4 framework and from the MSDN website. Other methods would be Direct Show and WIA.
The initial image was captured at 640 by 480 pixels in a 24 bits per pixel RGB format. Frame rate was 30 frames per second. Once the image was acquired the lockbits method (Powell, 2003) was used to place the image data in an array which is included with the drawing.dll. This array had the format of 1 row and 640*480*3 columns and hence 921 600 entries. Indexing for the image throughout the project was difficult due to the 1 dimensional nature of the array. The array represents the pixels values which span from the top left of the screen to the top right, row after row. The table below shows how the data is unwrapped.
TABLE 1 - PIXEL TO ARRAY MAPPING
0 1 2 3 4 5 6 7 8 ...
46
FIGURE 7- PIXEL TO ARRAY LAYOUT
A formula was developed for finding a particular pixel within the image array in terms of its x,y coordinates. Each pixel has three values.
Pixel(x,y) = x*3-3 + (y-1)*640*3, x*3-2 + (y-1)*640*3, x*3-1 + (y-1)*640*3
If we wish to find pixel (1,1) then the required indices for the image array are...
(0), (1), (2).
If we wish to locate pixel (640, 2) then the required indices for the image array are...
Some experimentation
image unwrapping. These are functions from the API library. The advantage here is the use of a
specify the position of the pixel within the current bitmap. Unfortunately early tests with these functions showed them to be extremely slow and this approach was abandoned.
Once a single image was captured, this proce
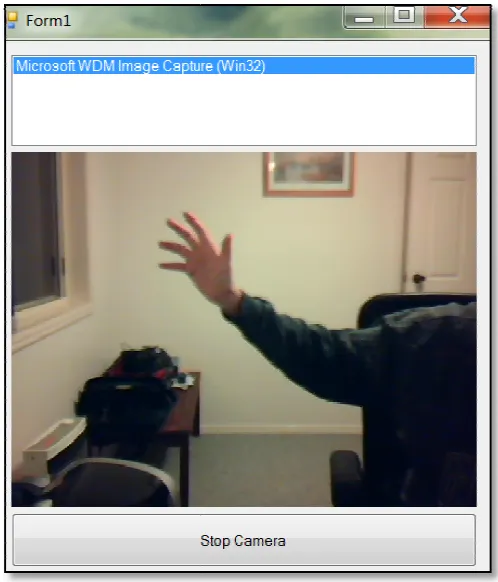
[image:47.595.115.364.414.705.2]run continuously. This later caused issues with form responsiveness devoted to checking the windows form for user activity
FIGURE 8 - 1ST WEBCAM CAPTURE
Some experimentation occurred with the getpixel and setpixel methods . These are functions from the graphics device interface ( library. The advantage here is the use of a traditional 2D coordinate system to specify the position of the pixel within the current bitmap. Unfortunately early tests with these functions showed them to be extremely slow and this approach was
Once a single image was captured, this process was placed within a while loop and run continuously. This later caused issues with form responsiveness
devoted to checking the windows form for user activity.
1ST WEBCAM CAPTURE
47 and setpixel methods to achieve graphics device interface (GDI) traditional 2D coordinate system to specify the position of the pixel within the current bitmap. Unfortunately early tests with these functions showed them to be extremely slow and this approach was
48
7.4
Greyscale Conversion
Some trials with greyscale conversion were performed to assess the speed improvements and later program motion detection performance.
A typical RGB to grayscale mapping of 0.333*Red + 0.59*Green + 0.11*Blue was used. For the interested reader the code is shown below and provides a simple implementation of the required transformation in the VBasic 2010 language.
LockBitmap(newbitmap)
'(0.3333*r+0.59*g+0.11*b) pix = 0
For Y = 0 To newbitmap.Height - 1 For X = 0 To newbitmap.Width - 1 Red = 0.33 * g_PixBytes(pix) pix += 1
Green = 0.59 * g_PixBytes(pix) pix += 1
Blue = 0.11 * g_PixBytes(pix) pix += 1
GrayValue = Math.Floor(Red + Green + Blue) If GrayValue > 255 Then
GrayValue = 255 End If
g_PixBytes(pix - 2) = GrayValue g_PixBytes(pix - 1) = GrayValue g_PixBytes(pix) = GrayValue Next X
Next Y UnlockBitmap(newbitmap)
50
7.5
The Background Image
A background image is used by the differencing routine. The idea is that by comparing an empty scene with the current scene, any high level differences are new and moving objects. Some early systems used a static image for the background. This image was acquired while the scene was empty of people. A better approach to creating a background image is by updating the background continuously but omit any moving objects from it. The highly efficient and simple to implement approximate median filter was used.
This approximates the following formula.
Pixel(i,n) = median(Pixel(i,n),Pixel(i,n-1),...,Pixel(i,n-l))
n = the current pixel at TimeNow
n-a = the current pixel at Time-a
l = the length of the medium filtered data
51 decremented by 1. Similarly, if the background pixel is less than the value of the current image pixel, then the background pixel is incremented by 1. The background image converges towards the values which are the most frequently encountered in the background image. Moving objects cause a temporary disturbance which changes the value of the background image.
The advantage of using this type of filter is that the system can cope with the slow lighting changes which are typical throughout the day. The background image slowly incorporates the new brightness information.
52 TABLE 2 - BACKGROUND IMAGE EXAMPLE
Stage 1 – The filter is started, the
background image is initialised as the
current image.
Stage 2 – The person moves and the
background image remains unchanged
due to the high rate of movement.
Stage 3 – The person stops moving
the hand, and the hand slowly
becomes part of the new background.
Stage 4 – Once again, the person has
53
7.5.1 The Ghost Filter Variable
The background image update rate affects the entire system. If the frames per second of the system are high and the motion objects moves very slowly through the field of vision, then ghosting occurs. This is a trailing echoed image of the moving object which trails behind the moving object. It is necessary therefore to change the speed at which the background image is updated. To achieve this, the background image is only updated every nth frame. This is referred to as the ghost filter variable within the user application and this variable can be modified while the program is running.
7.6
The Difference Image
The difference image is the difference between the current image and the background image. The current image is subtracted from the background image, the absolute value is found and then a threshold is applied. If pixels in the difference image are above the threshold they are assigned the value of white. If pixels in the difference image are below the threshold value then they are assigned the value of black. White indicates motion, black indicates non-motion.
Pixel(n) = Pixel(ncurrent) – Pixel(nbackground)
n = the array index
n = the array index for the current image
54
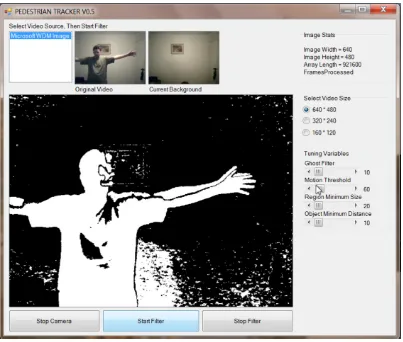
FIGURE 9 - DIFFERENCE IMAGE EXAMPLE 1
55
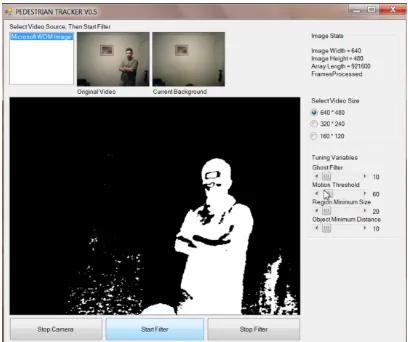
FIGURE 10 - DIFFERENCE IMAGE EXAMPLE 2
56
FIGURE 11 - DIFFERENCE IMAGE EXAMPLE 3
In the above image, figure 11 you can see in the bottom right hand corner of the difference image the effects of shadows.
57
7.7
The Pixelator
[image:57.595.113.401.370.593.2]After developing the difference image a concern arose that forming regions from the noisy and sometimes separated regions would be difficult. An example below shows this noise and body part segregation occurring. The hands are clearly distinct from the forearms. The crown of the head has been separated from the face. As it was expected that region growing was to be performed solely by linking those pixels which are white and connected, a method needed to be developed to ensure that pixels of a motion object were joined. A pixelator was written to achieve this.
FIGURE 12 - SEGREGATION IN THE DIFFERENCE IMAGE
blocks. If a given number of pixels in that block were motion pixels, then the entire block was filled with motion pixels. This same method was then applied in the vertical direction. Speed for this method was very high and the results were promising.
In the image below you
difference image is shown in the top right window. You can see that the hand is separate from the arm and that the arm has two distinct parts, each of them separate from the hand and shoulder. In the pix
[image:58.595.116.375.413.695.2]continuous object.
FIGURE 13 - PIXELATOR RESULTS
umber of pixels in that block were motion pixels, then the entire block was filled with motion pixels. This same method was then applied in the vertical direction. Speed for this method was very high and the results were
In the image below you can see the pixelated image in the main window. The difference image is shown in the top right window. You can see that the hand is separate from the arm and that the arm has two distinct parts, each of them separate from the hand and shoulder. In the pixelated image, the difference image is now one
PIXELATOR RESULTS
58 umber of pixels in that block were motion pixels, then the entire block was filled with motion pixels. This same method was then applied in the vertical direction. Speed for this method was very high and the results were
60
7.7.1 Pixelator Code
'a horizontal pixelate blur is run first
pix = 0
For Y = 0 To bmap.Height - 1
For X = 0 To ((bmap.Width * 3 / BlockSize) - 1)
For k = 0 To (BlockSize - 1)
SummedPixels = g_PixBytes(pix) + SummedPixels pix += 1
Next k
If SummedPixels > BlurThreshold Then
'set all to motion (255)
For k = 0 To (BlockSize - 1)
g_PixBytes(pix - k - 1) = 255
Next k
Else
'set all to non motion (0)
For k = 0 To (BlockSize - 1)
g_PixBytes(pix - k - 1) = 0
Next k
End If
SummedPixels = 0 Next X
Next Y
'a vertical pixelate blur is done next
Dim NumberOfColumns As Integer = bmap.Width * 3
Dim NumberOfRows As Integer = bmap.Height
Dim VertArrayIndex As Integer = 0
Dim NumberOfBlocksPerColumn As Integer = NumberOfRows / BlockSize
61 ReDim VertArray(NumberOfRows)
'now setup a column array which lists all the pixel indexes of that column
For X = 0 To (NumberOfColumns - 1)
VertArray(0) = X
For k = 1 To NumberOfRows - 1
VertArray(k) = VertArray(k - 1) + NumberOfColumns
Next
pix = 0 'this will count from row number 0 to final row
'now process the columns
For Y = 0 To (NumberOfBlocksPerColumn - 1)
'now process the blocks in that column
For W = 0 To (BlockSize - 1)
VertArrayIndex = VertArray(pix)
SummedPixels = g_PixBytes(VertArrayIndex) + SummedPixels pix += 1
Next
If SummedPixels > BlurThreshold Then
For Z = 0 To (BlockSize - 1)
VertArrayIndex = VertArray(pix - 1 - Z) g_PixBytes(VertArrayIndex) = 255
Next
End If
SummedPixels = 0
Next
62
7.8
Software Engineering
7.8.1 Multithreading Trials
At this stage the windows form was unresponsive due to the simple for loop which ran the main filter. No time was made for the windows form itself to check if new data was being entered. Multithreading was investigated as this could also lead to significant performance gains.
When checking the windows performance only 27% of the CPU was being used while the program was running. 25% of the CPUs were being used for the running pedestrian tracker application and 2% was being used for the Windows system.
A simple experiment with multi-threading involved placing the form on one thread and the main application on another. This would solve the form’s lack of responsiveness issues and allow the user to click buttons or change variables as required. Multiple issues occurred and these were solved by turning off cross thread call checks and using single thread apartments. Unfortunately a Null Argument Exception continued to occur and this was unable to be debugged. During the period when the program ran successfully the form was immediately responsive.
The final solution to make the form usable was to place a check for
63 not ideal as the form sometimes requires 2 clicks before it will start responding to user input.
7.8.2 Structured Programming
As the project grew it became apparent that the author’s software engineering skills were lacking. The program is essentially several filters running serially. Future versions of the project should ensure that each unique section has been modularized with clearly defined inputs and outputs to allow for easier program development.
7.9
Object Growing
In figure 14, how would the pixels be grouped? When a person looks at the image it seems obvious which pixel
pixels? A square has been drawn over the image where the person is.
[image:64.595.114.463.218.572.2]figure 14 again, one can see that there are blobs which have been separated from the main body in the head and left a
FIGURE 14 - GROWING OBJECTS FROM
The 1st approach investigated was an exhaustive blob growing method which look for motion pixels in adjacent squares
In figure 14, how would the pixels be grouped? When a person looks at the image it seems obvious which pixels are a part of the person. How can a program
A square has been drawn over the image where the person is.
figure 14 again, one can see that there are blobs which have been separated from the main body in the head and left arm regions.
GROWING OBJECTS FROM A DIFFERENCE IMAGE
approach investigated was an exhaustive blob growing method which look for motion pixels in adjacent squares and then grouped them. The 2
64 In figure 14, how would the pixels be grouped? When a person looks at the image it part of the person. How can a program group these A square has been drawn over the image where the person is. Referring to figure 14 again, one can see that there are blobs which have been separated from the
65 based on an advanced region growing method as used by a traffic analysis research project.
7.9.1 Region Growing by Seeding
The image could be seeded, and then if the initial seed falls on a motion pixel, then the region search begins.
FIGURE 15 - GROSS REGION SEEDING
66
FIGURE 16 - COMPREHENSIVE SEED GROWING
The above image shows a better method. The image is seeded. If a motion image intersects a seed point as with S2, then a region search begins and any adjacent motion pixels are grouped in that region. S3 to S5 will not initiate any region searches. For S6, a region search is initiated. However, this seed is already part of a region. Before starting the region mapping, S6 is checked to see if it already belongs to a region. If it does, then no region mapping occurs and the program moves onto S7.
The following diagram shows the proposed initial algorithm design.
67 Another method would be to sweep from left to right through the pixel matrix. When a motion pixel (255) is encountered, start the region map. Once a pixel is added to a region map and the next pixels to be searched are readied, then the pixel is deleted from the original image. The region mapping continues until it can find no more valid motion pixels. Starting at the 1st motion pixel encountered, the sweep continues. This may be faster than the original method and also covers every pixel.
68
7.9.2 Line by Line Region Growing
Further research lead to a paper entitled “Traffic Image Processing Systems” in which an advanced region growing algorithm was proposed and showed promising speed (Surgailis et al, 2009). The algorithm in this paper is shown below.
FIGURE 18 - ADVANCED REGION GROWING ALGORITHM – SOURCE: (SURGAILIS, 2009)
This algorithm inspired the approach taken by the author. In essence the following stages occurred in the code developed:
1. Each line was scanned and line blobs were formed.
2. Once the next line had been scanned, both lines were compared.
69 The next line was scanned and the process continued.
FIGURE 19 - SIMPLIFIED METHOD FOR GROWING REGIONS
This approach differs from the Advanced Region Growing technique in the fact that a large array is not generated as all lines are not scanned before the blob merging occurs. This method works line by line.
The three stages of line blob formation, line merging and overlapping region growth will now be discussed.
7.9.3 Line Blob Formation
70 and 255 for white, much of the stored information is now redundant. To achieve this a new array is formed which only uses every third element from the original array.
Scanning from left to right the program groups any blocks of pixels which are in motion (white/255) and adjacent to each other (see figure 19). When a blob is found, its coordinates are saved to a Line Blob array with column headings of Xstart, Xend, Ystart and Yend. Xstart is where the first motion pixel occurs for the line blob. Xend is where the motion pixel of the current blob transitions from motion to non motion. Ystart and Yend are found by checking which row the program is currently on.
FIGURE 20 - LINE BLOBS EXAMPLE
71
FIGURE 21 - ROW SCANNER ALGORITHM
7.9.4 Blob Merging
Next blobs of the current line and the previous line are compared and checked if they overlap. A simplified overlap explanation is shown to assist with the conceptual understanding of what operation is being performed in figure 22. If two blobs collide, then they are merged into 1 blob with updated x and y coordinates.
FIGURE 22- LINE BLOB COLLISION DETECT
72
FIGURE 23 - LINE BLOB COLLISION LOGIC
Once a line has been scanned, and the merge has occurred, some merged blobs are redundant as they occur within a greater line blob. Hence the current Line blobs are scanned and any redundant blobs are removed from the Line blob array.
7.9.5 Region Formation
75 Once basic regions had been formed, the regions were then checked to see if they overlapped in a rectangular sense. For example, in the following example, the 2 regions should be combined as they overlap one another. The boxes surrounding each line show the existing coordinates.
FIGURE 25 - REGION OVERLAP
76 Another piece of logic added to the region growth routine is a check on the size of the region. If the region is too small it is considered to be noise and is deleted from the regions array.
FIGURE 26 - REGION COLLISION LOGIC
77 During this development process a self contained program was written to assist with debugging. Figure 27 shows the program and the generated arrays when object growth is set to zero, and hence no object expansion and collision detection occurs. Figure 28 shows the results when the objects are expanded and then the collision detection occurs. It is obvious there are some deficiencies with this method as in figure 28 some objects are combined which it would be preferable not to combine. The selection of an appropriate region minimum distance value is needed.
78
FIGURE 28 - REGION GROWTH WITH OBJECT EXPANSION
7.9.6 Region Growing Results
79
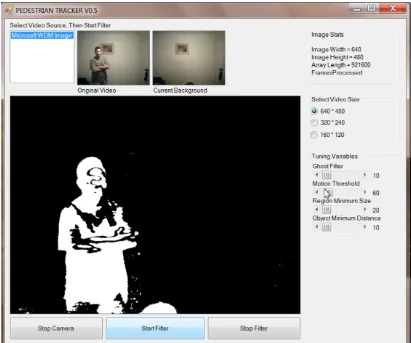
FIGURE 29 - OBJECTS EXAMPLE 1
[image:79.595.113.435.391.661.2]80
FIGURE 31 - OBJECTS EXAMPLE 3 SHADOW ISSUES
Figure 31 shows that issues were being caused by shadows. A shadow occurs on the left of the subject on the near wall. These shadows lead to a significantly larger object being drawn than was actually occurring. This problem became more apparent when outdoor tests were performed as demonstrated in the section on tracking. In order to remove these shadows, a suitable environment would need to be chosen, or shadow removal techniques would have to be developed.
81 with frame rates of 29 fps. Compare this to the normal program speed of approximately 28 fps. This is due to the time required for the resize calculation itself. This could be improved however if the software had the ability to control the camera driver directly and set the camera image format at the required resolution.
82
7.10
Basic Object Tracking
Unfortunately due to time constraints this section needed to be simplified in order to provide some results which could be tested. As such, the tracking techniques were insufficient for any complex situation where multiples objects appear.
Object tracking used 3 basic premises.
1. Objects which have a similar size could be related.
2. Objects which have a similar position could be related.
3. Use the age of the matched objects to gain or lose a track.
83 The result was promising in a simple environment where there was only one primary object. It was expected that the outdoor results would not be as successful.
84
FIGURE 34 - INDOOR TRACKING EXAMPLE 2
85
FIGURE 35 - TRACKING OUTDOORS ISSUES 1
86
FIGURE 36 - TRACKING OUTDOOR ISSUES 2
87
FIGURE 37 - TRACKING OUTDOORS GOOD RESULTS
[image:87.595.113.418.386.641.2]88
7.11
Final Code
While the code for a research project is typically included as an appendix, the author’s efforts have been primarily directed towards producing a working software application. This project has been primarily a work in software engineering and vision systems. As such, the final version of the software is given here in its entirety and it is hoped that this may be used by future students or researchers. This code provides a practical realisation of the vision systems theory. Visual Basic project files, of which there are multiple versions, are also available from [email protected] upon request.
89
90 Imports System.Runtime.InteropServices
Imports System.Drawing
Imports System.Drawing.Graphics Imports System.Threading
Public Class Form1
'these are constants used for image capture
Const WM_CAP_START = &H400S
Const WS_CHILD = &H40000000 'creates a child window
Const WS_VISIBLE = &H10000000 'creates a window that is initially visible
Const WM_CAP_DRIVER_CONNECT = WM_CAP_START + 10 'connects a capture window to a capture driver.
Const WM_CAP_DRIVER_DISCONNECT = WM_CAP_START + 11 'disconnects a capture driver from a capture window
Const WM_CAP_EDIT_COPY = WM_CAP_START + 30 'copies video frame buffer to the clipboard
Const WM_CAP_SEQUENCE = WM_CAP_START + 62 'initiates streaming capture to a file
Const WM_CAP_FILE_SAVEAS = WM_CAP_START + 23 'copies the contents of the capture file to another file
Const WM_CAP_SET_SCALE = WM_CAP_START + 53 'enables or disables scaling of the preview video images
Const WM_CAP_SET_PREVIEWRATE = WM_CAP_START + 52 'sets the frame display rate in preview mode
Const WM_CAP_SET_PREVIEW = WM_CAP_START + 50 'enables or disables preview mode.
Const SWP_NOMOVE = &H2S 'changes the size, position, and Z order of a child, pop-up, or top-level window
Const SWP_NOSIZE = 1 'retains the current size (ignores the cx and cy parameters).
Const SWP_NOZORDER = &H4S 'retains the current Z order (ignores the hWndInsertAfter parameter).
Const HWND_BOTTOM = 1 'places the window at the bottom of the Z order. If the hWnd parameter identifies a topmost window, the window loses its topmost status and is placed at the bottom of all other windows.
'these are constants used by the imageprocessing subroutine
91
Dim FRAME_RATE_COUNTER As Long
Dim Red, Green, Blue As Integer
Dim ChangeThreshold As Integer
Dim Image_Size As Integer = 1
'these are constants used by the object building section of code
Dim Length As Integer = 300 'the length of the following arrays - too small and the program
will crash
Dim LineA(4, Length) As Integer 'the previous line blob array (Xstart,Xend,Ystart,Yend)
Dim LineB(4, Length) As Integer 'the current line blob array (Xstart,Xend,Ystart,Yend,)
Dim LineTemp(4, Length) As Integer 'a temp storage line blob array (Xstart,Xend,Ystart,Yend) - these
are the new LineA values
Dim Regions(4, Length) As Integer 'the stored regions array (Xstart,Xend,Ystart,Yend)
Dim Xstart As Integer = 0 'the start pixel of the current blob/region
Dim Xend As Integer = 0 'the last pixel of the current blob/region
Dim Ystart As Integer = 0 'the start row of the current region/region
Dim Yend As Integer = 0 'the end row of the current region/region
Dim CurrentRow As Integer = 0 'the current row number
Dim CurrentColumn As Integer = 0 'the current column number
Dim RowStartPixel As Integer = 0 'the start pixel number of the current row
Dim RowEndPixel As Integer = 0 'the end pixel number of the current row
Dim Pixel As Integer = 0 'the current pixel number
Dim PixelsPerRow As Integer = 0 'number of pixels per row
Dim NumberOfPixels As Integer = 0 'the accumulated number of pixels for the current line blob
Dim NumberOfRows As Integer = 0 'the number of rows in the current image
Dim NumberOfColumns As Integer = 0 'the number of rows in the current image
Dim NewRow As Integer = 0 'do we need to start a new row?
Dim LastPixel As Integer = 0 'was the last pixel checked a motion pixel
Dim Objects(4, Length) As Integer 'the stored objects array (Xstart,Xend,Ystart,Yend)
Dim NewRegions(4, Length) As Integer 'the new stored regions array (Xstart,Xend,Ystart,Yend)
Dim BlobNumber As Integer = 0 'the current blob Number - used as a pointer the LineB array
Dim RegionMinSize As Integer = 10 'the minimum size of a region - note total pixles not
calculated, only total height + length
Dim RegionMinimumDistance As Integer = 5 'this is used to determine if 2 regions overlap
Dim BlobNumberB As Integer = 0 'the total number of blobs in LineB, starts at zero
Dim BlobNumberA As Integer = 0 'the total number of blobs in LineA, starts at zero
92
Dim RegionsNumber As Integer 'the region array pointer
Dim BlobB As Integer = 0 'a blob B pointer
Dim BlobA As Integer = 0 'a blob A pointer
Dim BlobTemp As Integer = 0 'a blob temp pointer
Dim BlobMerge As Integer = 0 'continue merging for this current blob?
Dim MatchFound As Integer = 0 'this creates a region with the current LineA Blob
Dim BlobPointer As Integer = 0 'add the BlobB pointer to the BlobMerge pointer
Dim AllRegionsChecked As Integer = 0 'used to merge the regions array
Dim BorderPixelsThree As Integer = 0 '3 time multiply
Dim RowNumber As Integer = 0 'the current row number
Dim RowNumberStart As Integer = 0 'the start row number
Dim RowNumberEnd As Integer = 0 'the end row number
Dim RegionLength As Integer = 0 'the length of the current region
Dim RegionHeight As Integer = 0 'the height of the current region
Dim RegionSize As Integer = 0 'the total of the height and length of a region
Dim NewRegionsPointer As Integer = 0 'a pointer for the new regions array
Dim NewRegionsNumber As Integer = 0 'the number of new entries in the newregions array
Dim RegionMatchFound As Integer = 0 'indicates a match has been found between 2 regions
Dim RegionsMatchPointer As Integer = 0 'a region match pointer
Dim ObjectsNumber As Integer = 0 'The total number of objects in the objects array
Dim PossibleObjects(7, Length) As Integer 'size, xcentre, ycentre, number of matches, match found
this iteration, delete this entry, ID
Dim PossibleObjectsTemp(7, Length) As Integer 'size, xcentre, ycentre, number of matches, match found
this iteration, delete this entry, ID
Dim PossibleObjectsNumber As Integer 'the number of current possible objects
Dim ObjectID As Integer = 0 'the Object ID
Dim ObjectsMatchStatus(1, Length) As Integer
Dim NumberOfPedestrians As Integer = 0 'the number of pedestrians which have crossed since
program start
'these constants are using for the drawing
Dim Pen As New Pen(Color.FromArgb(255, 0, 255, 0), 3)
Dim drawFont As New Font("Arial", 40)
'ghost filter constant
93 'try setting label near start to ensure it displays on form load
'--The capGetDriverDescription function retrieves the version ' description of the capture driver--
Declare Function capGetDriverDescriptionA Lib "avicap32.dll" _
(ByVal wDriverIndex As Short, _
ByVal lpszName As String, ByVal cbName As Integer, _
ByVal lpszVer As String, _
ByVal cbVer As Integer) As Boolean
'--The capCreateCaptureWindow function creates a capture window--
Declare Function capCreateCaptureWindowA Lib "avicap32.dll" _
(ByVal lpszWindowName As String, ByVal dwStyle As Integer, _
ByVal x As Integer, ByVal y As Integer, ByVal nWidth As Integer, _
ByVal nHeight As Short, ByVal hWnd As Integer, _
ByVal nID As Integer) As Integer
'--This function sends the specified message to a window or windows--
Declare Function SendMessage Lib "user32" Alias "SendMessageA" _ (ByVal hwnd As Integer, ByVal Msg As Integer, _
ByVal wParam As Integer, _
<MarshalAs(UnmanagedType.AsAny)> ByVal lParam As Object) As Integer
'--Sets the position of the window relative to the screen buffer--
Declare Function SetWindowPos Lib "user32" Alias "SetWindowPos" _
(ByVal hwnd As Integer, _
ByVal hWndInsertAfter As Integer, ByVal x As Integer, _
ByVal y As Integer, _
ByVal cx As Integer, ByVal cy As Integer, _ ByVal wFlags As Integer) As Integer
'--This function destroys the specified
Declare Function DestroyWindow Lib "user32" _ (ByVal hndw As Integer) As Boolean
'---used to identify the video source---
94 '---used as a window handle---
Dim hWnd As Integer
'---preview the selected video source---
Private Sub PreviewVideo(ByVal pbCtrl As PictureBox) hWnd = capCreateCaptureWindowA(VideoSource, _
WS_VISIBLE Or WS_CHILD, 0, 0, 0, _
0, pbCtrl.Handle.ToInt32, 0)
If SendMessage( _
hWnd, WM_CAP_DRIVER_CONNECT, _
VideoSource, 0) Then
'---set the preview scale---
SendMessage(hWnd, WM_CAP_SET_SCALE, True, 0)
'---set the preview rate (ms)---
SendMessage(hWnd, WM_CAP_SET_PREVIEWRATE, 10, 0)
'---start previewing the image---
SendMessage(hWnd, WM_CAP_SET_PREVIEW, True, 0)
'---resize window to fit in PictureBox control---
SetWindowPos(hWnd, HWND_BOTTOM, 0, 0, _ pbCtrl.Width, pbCtrl.Height, _
SWP_NOMOVE Or SWP_NOZORDER)
Else
'--error connecting to video source---
DestroyWindow(hWnd)
End If
End Sub
'---stop the preview window---
Private Sub btnStopCamera_Click( _
ByVal sender As System.Object, _
ByVal e As System.EventArgs) _
Handles btnStop.Click
StopPreviewWindow() End Sub
'--disconnect from video source---
95 SendMessage(hWnd, WM_CAP_DRIVER_DISCONNECT, VideoSource, 0)
DestroyWindow(hWnd) End Sub
Private Sub Form1_Load( _
ByVal sender As System.Object, _
ByVal e As System.EventArgs) Handles MyBase.Load
'---list all the video sources---
ListVideoSources() End Sub
'---list all the various video sources---
Private Sub ListVideoSources()
Dim DriverName As String = Space(80)