Evidence Report 67
October 2012
Transportation and
Sector Skills Assessment:
Transportation and Storage Sector
Authors: Gwenn Winters, Faye Chua and Maciej Bugala
Author organisations: Skills for Logistics and People 1
stOctober 2012
Foreword
The UK Commission for Employment and Skills is a social partnership, led by Commissioners from large and small employers, trade unions and the voluntary sector. Our ambition is to transform the UK’s approach to investing in the skills of people as an intrinsic part of securing jobs and growth. Our strategic objectives are to:
Maximise the impact of employment and skills policies and employer behaviour to
support jobs and growth and secure an internationally competitive skills base;
Work with businesses to develop the best market solutions which leverage greater
investment in skills;
Provide outstanding labour market intelligence which helps businesses and people
make the best choices for them.
The third objective, relating to intelligence, reflects an increasing outward focus to the UK Commission’s research activities, as it seeks to facilitate a better informed labour market, in which decisions about careers and skills are based on sound and accessible evidence. Related, impartial research evidence is used to underpin compelling messages that promote a call to action to increase employers’ investment in the skills of their people.
Intelligence is also integral to the two other strategic objectives. In seeking to lever greater investment in skills, the intelligence function serves to identify opportunities where our investments can bring the greatest leverage and economic return. The UK Commission’s third strategic objective, to maximise the impact of policy and employer behaviour to achieve an internationally competitive skills base, is supported by the development of an evidence base on best practice: “what works?” in a policy context.
Sector Skills Assessments (SSAs) are key sources of authoritative and focused sectoral labour market intelligence (LMI), designed to inform the development of skills policy across the UK. They combine “top-down” analysis of official data with bottom-up intelligence to provide a consistent, comparable and rich understanding of the skills priorities within different sectors of the economy, across the four UK nations.
The two Sector Skills Councils (SSC) who authored this report are Skills for Logistics and People 1st. Skills for Logistics is the SSC for the freight logistics and wholesaling sectors and People 1st is the SSC for hospitality, passenger transport, travel and tourism sectors.
Sharing the findings of our research and engaging with our audience is important to further develop the evidence on which we base our work. Evidence Reports are our chief means of reporting our detailed analytical work. All of our outputs can be accessed on the UK Commission’s website at www.ukces.org.uk
But these outputs are only the beginning of the process and we are engaged in other mechanisms to share our findings, debate the issues they raise and extend their reach and impact. These mechanisms include our Changing Behaviour in Skills Investment seminar series and the use of a range of online media to communicate key research results.
We hope you find this report useful and informative. If you would like to provide any feedback or comments, or have any queries please e-mail info@ukces.org.uk, quoting the report title or series number.
Lesley Giles
Deputy Director
Table of Contents
Executive Summary ... viii
1
Introduction ... 1
1.1 Purpose of report ... 1
1.2 Defining the sector ... 2
1.3 Sector Skills Councils ... 3
1.4 Summary of methodology ... 4
2
Current performance of sector ... 6
Chapter Summary ... 6
2.1 Economic performance... 7
2.2 Employer profile ... 15
2.3 Business start-ups and closures ... 21
2.4 Employment ... 22
3
The workforce ... 26
Chapter Summary ... 26
3.1 The jobs people do ... 27
3.2 Working patterns ... 31
3.3 Workforce characteristics ... 38
4
Demand for, and value of, skills ... 49
Chapter Summary ... 49
4.1 Nature of skills used ... 50
4.2 Value of skills ... 58
4.3 HPW ... 59
4.4 Provision of training / investment ... 68
4.5 Skills and sectoral performance ... 79
5
Extent of skills mismatch ... 82
Chapter Summary ... 82
5.1 Extent and nature of vacancies ... 83
5.2 Hard-to-fill vacancies and skill-shortage vacancies ... 88
5.3 Recruitment channels ... 92
5.5 Extent and nature of skills issues ... 94
5.6 Extent of under-employment ... 101
5.7 Impact of mismatches ... 103
5.8 Skills of the unemployed ... 105
5.9 Skills deficiencies hampering growth ... 106
6
Drivers of change and their skills implications ... 109
Chapter Summary ... 109
6.1 Drivers of change ... 110
6.2 Regulation and governance ... 111
6.3 Demographic change ... 114
6.4 Environmental change ... 115
6.5 Economics and globalisation ... 118
6.6 Technological change ... 119
6.7 Values and identities ... 120
6.8 Consumer demand ... 121
6.9 Tourism... 122
6.10 Scale of drivers ... 123
6.11 Differences in drivers across the four nations ... 128
7
Future skills needs ... 132
Chapter Summary ... 132
7.1 Future trends ... 133
7.2 Drivers ... 133
7.3 Impact on employment and skills ... 142
7.4 Future occupational profile ... 143
7.5 Future skill needs ... 145
8
Priority areas for action ... 147
Chapter Summary ... 147
8.1 Priority areas ... 148
8.2 Attracting new recruits ... 153
8.3 Promoting clearer development pathways ... 154
Table of Graphs and Charts
Table 2.1 GVA by nation (£m in current basic prices) (2008) ... 9
Table 2.2 GVA by English region (£m in current basic prices) (2008) ... 9
Table 2.3 UK GVA (£m in current basic prices) (1999-2008) ... 10
Figure 2.1 Total factor productivity growth for the transportation and storage sector ... 13
Table 2.5 Number of establishments by sector and nation (2010) ... 16
Table 2.6 Number of establishments by sector and English region (2010) ... 17
Table 2.7 Number of establishments by sector 2006-2010 (UK) ... 18
Table 2.8 Size of establishments by sector (UK) (2010) ... 19
Table 2.9 Size of establishments by nation (2010) ... 20
Table 2.10 Size of establishments within sector by nation (2010) ... 20
Table 2.11 Size of establishments within sub-sectors (2010) ... 20
Table 2.12 Business (enterprise) start-ups and closures 2009 (UK) ... 22
Table 2.13 Business (enterprise) start-ups and closures by sub-sector 2009 (UK) ... 22
Table 2.14 Total employment by sector and nation (2010)('000s) ... 23
Table 2.15 Total employment by sector and English region, % share within region (2010)24 Table 2.16 Total employment by sector 2002-2010 (UK)('000s) ... 25
Table 3.1 Employment by occupation and nation, 2010 (UK) ... 27
Table 3.2 Largest occupational groups, UK (2010) ... 28
Table 3.3 Employment by occupation and sector, 2010 (UK) ... 28
Table 3.4 Largest occupational groups within sector, UK (2010) ... 30
Table 3.5 Employment by occupation and sub-sector, 2010 (UK) (%) ... 30
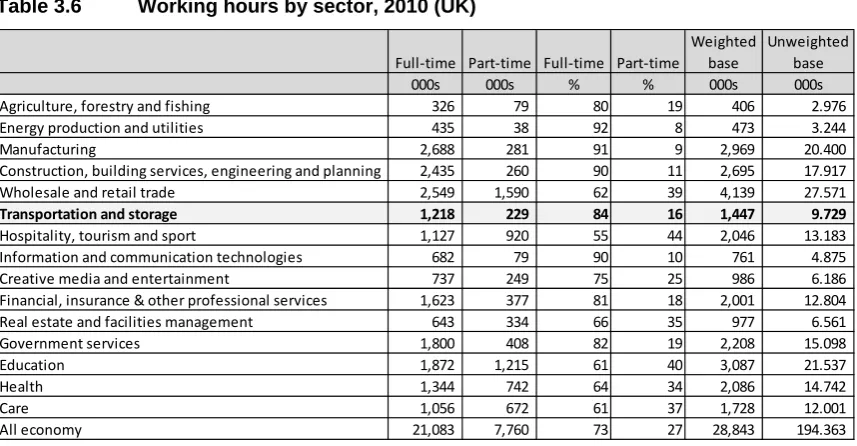
Table 3.6 Working hours by sector, 2010 (UK) ... 32
Table 3.7 Working hours by sector and nation, 2010 (%) ... 33
Table 3.8 Employment status by sector, UK, 2010 ('000s) ... 35
Table 3.9 Employment status by sector and nation, 2010 (%) ... 36
Table 3.10 Permanent and temporary employees by sector, UK, 2010 ('000s and %) ... 37
Table 3.11 Employment by gender and nation (2010) ... 38
Table 3.12 Employment within sector by gender and nation (2010) ... 39
Table 3.13 Gender profile by broad occupational group, 2010 (UK) ... 41
Table 3.14 Age profile of workforce by nation (2010)... 41
Table 3.15 Age profile of workforce 2002-2010 (UK) ... 42
Table 3.16 Age profile of sector workforce (by nation) ... 42
Table 3.17 Age profile of sector workforce 2002-2010 (UK) ... 43
Table 3.18 Age profile of sub-sector workforce 2010 (UK) ... 43
Table 3.19 Ethnicity of workforce across whole economy, four nations (2010) ... 45
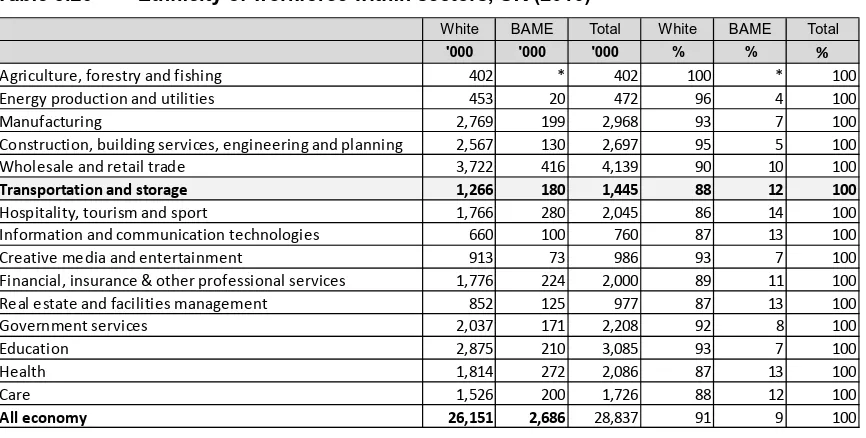
Table 3.20 Ethnicity of workforce within sectors, UK (2010) ... 45
Table 3.21 Employment by country of birth and nation, 2010 ... 46
Table 3.23 Employment by country of birth, by sub-sector, 2010 ... 47
Table 4.1 Nature of skills used in the sector ... 51
Table 4.2 Qualification profile of workforces within sectors, UK (2010) ... 52
Table 4.3 Qualification levels by nation (2010) ... 53
Table 4.4 Qualification levels, UK (2002-2010) ... 53
Table 4.8 Managers and professionals without Level 4 or higher qualifications (% of all managers and professionals) ... 57
Table 4.9 Managers and professionals without Level 4 or higher qualifications 2002-2010 (UK) ... 57
Table 4.10 Managers and professionals without Level 4 or higher qualifications, within sector 2002-2010 (UK) ... 58
Table 4.11 Whether establishment has formal processes in place to identify 'high potential' or talented individuals ... 61
Table 4.12 Extent to which employees have variety in their work ... 63
Table 4.13 Extent to which employees have discretion over how they do their work ... 65
Table 4.14 Extent to which employees at establishment have access to flexible working67 Table 4.15 Employers providing training by sector ... 69
Table 4.16 Employees receiving training by sector ... 70
Table 4.17 Employers providing training to employees by occupational group ... 71
Table 4.18 Employees receiving training by occupational group ... 72
Table 4.19 % of employees receiving training in last 4 weeks, 2010 (all nations) ... 73
Table 4.20 % of employees receiving training in last 4 weeks, 2002-2010 (UK) ... 74
Table 4.21 % of employees receiving training in last 13 weeks, 2010 (all nations) ... 74
Table 4.22 % of employees receiving training in last 13 weeks, 2002-2010 (UK) ... 75
Table 4.23 % of employees receiving training by sub-sector, 2010 ... 75
Table 4.24 Type of training funded or arranged for employees ... 76
Table 4.25 Barriers to training within sector ... 78
Table 5.1 Employers with vacancies, hard-to-fill vacancies and skills shortage vacancies ... 84
Table 5.2 Profile of vacancies by sector ... 85
Table 5.3 Profile of vacancies by sector and nation ... 86
Table 5.4 Profile of vacancies by occupation within sector ... 87
Table 5.5 Impact of having hard-to-fill vacancies within sector ... 89
Table 5.6 Measures taken by sector employers to overcome hard-to-fill vacancies ... 90
Table 5.7 Skills lacking in Skills Shortage Vacancies, whole economy... 90
Table 5.8 Skills lacking in Skills Shortage Vacancies within sector ... 91
Table 5.9 Employers recruiting one or more young person over the last 3 years ... 92
Table 5.10 Employers with retention problems by sector and nation ... 93
Table 5.11 Employers and employees with skills gaps by sector ... 95
Table 5.12 Employers and employees with skills gaps within sector, by nation ... 95
Table 5.13 Skills gaps by occupation within sector ... 96
Table 5.15 Steps employers have taken to overcome skills gaps, whole economy ... 99
Table 5.16 Steps employers within sector have taken to overcome skills gaps ... 100
Table 5.17 Extent to which workforce is 'over qualified' and 'over skilled' by sector .... 102
Table 5.18 Average hourly wage by sector (£) (UK) ... 104
Table 5.19 Vacancies and claimant count for key transport occupations (November 2011) ... 106
Figure 6.1 The key drivers of change ... 110
Table 6.1 Scale of drivers ... 124
Table 7.1 Workplace job growth by occupation within Whole Economy, UK ... 143
Table 7.2 Workplace job growth by occupation within Transportation and storage,UK144 Table 7.3 Workplace job growth and replacement demand by occupation within Transportation and storage, UK ... 145
Executive Summary
The Transportation and storage sector is an essential part of the UK economy. Our economy and way of life are highly dependent upon effective transport. The sector employs 1.45m people, equal to five per cent of total UK employment.
The sector contributes £134bn towards the UK’s turnover. The value is slightly lower than 2008 (£137bn), reflecting the economic climate in that period, but its contribution to the economy each year has remained stable at four per cent.
Total UK gross value added (GVA) of £91bn, places the sector sixth out of 15 sectors in economic terms. Current GVA per employee job at £50,000 is above the all economy average of £46,000. Increases in efficiency and effectiveness are understood to have contributed to recent improvements in productivity. But the differing levels across the nations and sub-sectors indicate that it is not performing to its full potential.
Furthermore, while the sector performs well within the UK economy, when comparing its Total Factor Productivity to international competitor nations, it is revealed that the sector is not as productive as in France and Germany.
As freight and passenger transport are driven by the needs of people and businesses, establishments and employment is found in every nation and region. Greatest employment is found in the South East, London and the North West – areas with major transport hubs.
Employment roles are concentrated in the lower occupational groups of machine operatives and elementary workers (60 per cent), with managers accounting for a further 11 per cent. 69 per cent of the workforce work in just 15 job roles, whilst four of the top six roles are driving occupations.
This lack of diversity is a consequence of several factors. The vast majority of establishments in the sector employ fewer than 10 people and smaller firms, particularly in road haulage, use informal recruitment methods, such as word-of-mouth. This may have implications for the recruitment of non-typical workers, while the negative perceptions of the sector and a lack of awareness of opportunities available mean that young people do not consider the sector as a career of choice. This is further reflected in the data that shows the sector is one of the least likely to take on an individual in their first job on leaving school, college or university.
The working patterns of the sector are dominated by full-time workers, who are employees of businesses. Working hours though, tend to be non-standard – evenings, early mornings and weekends.
The sector offers opportunities for employment for those with level 1, basic and employability skills, such as warehouse operatives and cleaners, right through to level 4 and higher qualifications. But the sector is relatively low skilled.
The qualification profile reveals that the sector is one of the most poorly qualified of all, with 37 per cent of the sector workforce not qualified to a level 2, and only 16 per cent having a level 4 or higher qualification (compared to 23 per cent and 37 per cent across the whole economy). Furthermore three in five managers do not have a level 4 or higher qualification.
A number of factors affect the skills levels of the workforce. Firstly a large number of the roles are at a level 2 grade, but key qualifications, such as vocational licences, considered to be level 2, are not included in formal accreditation frameworks. Furthermore, the ageing profile of employees, especially those that have worked in the sector all their working lives, means they see little tangible benefit from gaining higher qualifications.
One in nine employers report having at least one vacancy. Employers reveal that most vacancies are at machine operative level. Drivers fall within this and historically there has been a shortage of good Large Goods Vehicle (LGV) drivers. However, the economic slowdown and an influx of European workers, has mitigated this situation to some degree, but concerns remain for future recruitment.
Although significant number of individuals are seeking a role in the sector, a lack of applicants with the required skills mean that nearly a fifth of vacancies are classified as hard-to-fill. The skills most frequently reported as being considered to be lacking are job specific; in addition, a lack of customer handling skills is more prevalent compared to the all economy average.
The skills identified as lacking in applicants are similar to those found to be lacking in the current workforce. 55,000 sector workers have skills gaps, with machine operatives and elementary workers most likely to be highlighted as lacking full proficiency. The impact on businesses includes increased operating costs and the loss of business or orders to competitors.
The majority of employers undertake activities to overcome these skills gaps, such as increasing training or expanding the trainee programme. However, the failure of employers to provide appropriate training is reported to contribute to over a quarter of skills gaps.
The skills needs considered to be most threatening to sector performance are job-related technical skills and customer service abilities. These skills are a consequence of a number of drivers influencing the sector.
The ageing population and workforce impacts both the supply and demand for skills. As an employer, the sector will see a growing trend for older workers who will need to keep abreast of new technologies and ways of working. At the same time, attracting younger workers to a sector already not perceived as one of choice, will become a greater challenge. The demographics will also impact on how the sector operates as a service provider – an ageing population will have different customer service requirements, which the sector must be able to respond to.
The continuing need to reduce CO2 emissions, to diversify energy sources and to build a ‘lower carbon’ greener economy will see the transportation and storage sector implement new ways of working – either through new technologies and/or behavioural changes like eco-driving, vehicle utilisation and modal shift. The sector will need to be resourceful to be able to deal with the implications of extreme weather and plan for alternatives in emergencies.
Transport of freight and people has been both a contributor to and beneficiary of globalisation, with advances in technology ensuring that this has become ever more efficient. However, businesses continue to look for products and services that meet changing consumer demands, taking into account determining factors such as quality, price and individuals’ values and identities.
Finally technological changes have and will continue to impact the transportation and storage sector. The desire to improve competitiveness and meet customer requirements means employers will continue to look towards technologies to gain greater efficiencies. These include vehicle development changes, e-services and ICT technologies all of which impact the skills of users.
All of these drivers will impact the sector in the future, through new employment opportunities and skills development. Total jobs in the sector are projected to grow by 95,000 between 2010 and 2020, with replacement demand of 553,000. This means that 647,000 job openings are expected in the period, across all occupational groups. This raises issues for skills needs. To fully maximise economic performance there is an immediate need to ensure that we supply the ‘right skills’ which effectively meet the changing needs and requirements of the sector labour market.
Attract new recruits
Promote clearer development pathways
Professionalise the workforce and increase businesses’ investment in skills
development.
Additionally, in the case of passenger transport, achieving economic growth by improving customer service experience will be crucial.
1 Introduction
1.1
Purpose of report
The aim of this report is to provide authoritative labour market intelligence (LMI) for the transportation and storage sector to inform the strategic decision making of national governments in the development of employment and skills policy. It is one of 15 UK Sector Skills Assessment (SSA) reports produced by Sector Skills Councils1 and the UK Commission for Employment and Skills.
SSAs combine top-down data from official sources with bottom-up sectoral intelligence to provide a consistent, comparable and rich understanding of the skills priorities within sectors across the four UK nations. The reports have been produced to a common specification (developed by the UK Commission in consultation with the four UK governments) and follow a consistent structure.
Reports have been produced for the following sectors of the economy:
Agriculture, forestry and fishing
Energy production and utilities
Manufacturing
Construction building services, engineering and planning
Wholesale and retail trade
Transportation and storage
Hospitality, tourism and sport
Information and communication technologies
Creative media and entertainment
Financial, insurance & other professional services
Real estate and facilities management
Government
Education
Health
1
Care.
The reports contain intelligence on sectors and sub-sectors of particular interest to the four UK governments. As each nation has different ‘key sectors’, that are defined in different ways, it hasn’t been possible to define the SSA sectors in a way that matches precisely the key sectors identified by each nation government. Therefore, as far as possible, data has been reported in such a way that it can be aggregated to produce an overall picture for key sectors of interest. In some cases this will involve gathering information from more than one SSA report.
The reports are designed to provide sectoral intelligence at a relatively broad level for strategic decision making purposes. Whilst they do contain some sub-sectoral and occupational intelligence, further intelligence at a more granular level may be available from individual Sector Skills Councils.
In addition to the main UK reports, executive summaries have been produced for Scotland, Wales and Northern Ireland. The UK reports contain information on key regional variations between the four UK nations and within England where appropriate (for example if sectoral employment is focused in a particular geographic area). However, the reports are not designed to provide a comprehensive assessment of sectoral skills issues beyond the national level.
1.2
Defining the sector
The transportation and storage sector is defined by the following five sub-sectors, based upon SIC 2007 codes 49 to 53:
49: Land transport and transport via pipelines
50: Water transport
51: Air transport
52: Warehousing and support activities for transportation
53: Postal and courier activities
One of the intrinsic properties of the logistics market is that it is a service market, where consumption cannot be decoupled from production and delivery activities. The sector operates 24 hours a day, 7 days a week and 365 days of the year. Logistics operates on a global scale, underpinning all other sectors of the economy.
Similar to logistics, passenger transport serves all other sectors by facilitating movement of people who work for all industries of the economy. Additionally, it directly underpins the tourism industry and plays a key role in enabling social inclusions by making travel possible.
1.3
Sector Skills Councils
The two Sector Skills Councils (SSC) who authored the report are: Skills for Logistics and People 1st.
1.3.1 Skills for Logistics
Skills for Logistics (SfL) is the Sector Skills Council for the UK’s freight logistics and wholesaling sectors (http://www.skillsforlogistics.org/). SfL works alongside companies in the UK that are involved in the moving, handling, storing and wholesaling of goods.
SfL’s ambition is to “open doors so that logistics skills potential can be unleashed enabling people and organisations to do amazing things”. This drives their vision “to deliver the best skilled logistics workforce in the world”.
1.3.2 People
1st
People 1st is the Sector Skills Council for hospitality, passenger transport, travel and tourism sectors (http://www.people1st.co.uk/).
1.4 Summary
of
methodology
This report combines top-down data with bottom-up intelligence to provide a rich assessment of sectoral skills priorities that is consistent and comparable with assessments produced for other sectors of the economy.
Three main types of information have been drawn on in the preparation of this report:
Economy-wide quantitative data from core labour market information sources (such as
the Labour Force Survey and the UK Employer Skills Survey)
Sectoral, sub-sectoral and occupational specific quantitative data generated by SSCs /
sector bodies and others (including Government departments and agencies, academics and professional associations)
Qualitative information collected by SSCs / sector bodies and other organisations
To ensure consistency and comparability across all 15 SSA reports, data from core labour market information sources was centrally collected, processed and formatted. It was then distributed by the UK Commission to Sector Skills Councils / sector bodies for inclusion within the reports. This data was quality assured by contractors, the UK Commission and by Sector Skills Councils.
To meet consistency requirements, sub-sector analysis of data from core sources has primarily been undertaken at a 2-digit Standard Industrial Classification (SIC) code level (or by combining 2-digit SIC codes where appropriate).
Data from core sources has been supplemented within the report with data from sector specific sources.
The report also draws on qualitative research that has been undertaken to explore sectoral skills issues in more detail. Qualitative research with small samples of employers (and others), most commonly through interviews and focus groups, seeks to provide rich and detailed understanding and insight, rather than measurement. Samples tend to be designed to be broadly representative of the wider population, to gather a range of views. In terms of skills research with employers, size and sector tend to be key drivers of demand and therefore these are usually the main characteristics that are taken into account when designing samples.
The report synthesises and contextualises information from the sources identified above and, by undertaking a rigorous analysis of it, turns the information into intelligence.
Further information
2
Current performance of sector
Chapter Summary
The economy and daily lives of individuals are highly dependent upon effective transport
The sector contributes four per cent of the UK economy’s turnover
Gross value added (GVA) of £91bn (seven per cent of UK total) places the sector in the
top six out of 15 SSA sectors
Sector GVA per employee job is estimated to be £50,000. This is greater than the all
economy average of £46,000
1.45m individuals work within the sector, accounting for five per cent of total UK
employment
The majority (86 per cent) of the workforce work within England, eight per cent in
Scotland, three per cent in Wales and two per cent in Northern Ireland
Land transport is the largest sub-sector, employing half of the workforce
Employment levels have declined by 69,000 since 2008, most likely as a consequence of
This chapter looks at the economic performance and competitive position of the transportation and storage sector within the UK economy. The employer profile in terms of establishment size and national distribution, as well as how the numbers have changed in recent years are also analysed.
The chapter then explores the current employment profile and its distribution in a spatial and sub-sectoral context, and demonstrates how employment levels have altered in recent times.
2.1 Economic
performance
The following section looks at the economic and competitive performance of the transportation and storage sector in terms of turnover, Gross Value Added (GVA) and Total Factor Productivity (TFP). The employer profile, in respect of establishments is then described.
2.1.1 Current and recent UK economic performance
The transportation and storage sector is an essential part of the UK economy. Our economy and way of life are highly dependent upon effective transport and in particular freight activity. A report by Professor A. McKinnon (2004) demonstrates this dependency. It found that without lorries to carry freight, current standards of living could be maintained for only a few days and for the economy as a whole, the loss of road transport for a week would be devastating. For example during a week in September 2000, the fuel crisis was estimated to have cost firms £1bn (The Guardian 2000).
Danny Leipziger, the World Bank vice-president for poverty reduction and economic management has commented that, “Being able to connect to global markets is fast becoming a key aspect of a country’s capacity to compete, grow, attract investment, create jobs and reduce poverty” (Logistics Manager 2010). Similarly, Uri Dadush, World Bank trade director has remarked, “As a main driver of competitiveness, logistics can make you or break you as a country in today’s globalised world” (Europa 2010).
Land transport - £45bn
Water transport - £8bn
Air transport - £19bn
Warehousing and support activities - £44bn
Postal and courier activities - £18bn
Land transport contributes the greatest turnover. This is the largest sub-sector in terms of employment and with regards to freight transport, the mode through which the greatest proportion of goods are moved (DfT 2011d). This reflects the fact that the road system in the UK and Europe provides a link between nearly all establishments, thus providing door-to-door carriage via a single mode of transport. Another reason for road’s high freight market share is the relatively short distances that much freight travels. Analysis of the origins and destinations of goods lifted shows that, on average, around 70 per cent of road freight has its origin and destination within the same region of the UK. Only five per cent of goods lifted are carried more than 300 kilometres (DfT 2011d).
Between 2008 and 2010, certain industries within the sub-sectors did report growth. For example, passenger rail grew by 46 per cent, air freight by 29 per cent and postal and courier activities by 28 per cent. While passenger air transport reported a decline in turnover of 21 per cent and road freight by 20 per cent (ONS 2011a). The rapid turnover growth of passenger rail services resulted from two main socio-economic factors. Firstly, it was an outcome of large numbers of people across the UK moving towards more cost efficient transport solutions during times of national austerity. Secondly, more people decided to spend their holiday in the UK (colloquially referred to as “staycation”), instead of going abroad. This added significant numbers of users of the domestic land transport, with domestic tourism trips in July 2011 in Great Britain exceeding the level from July 2010 by 11 per cent (VisitEngland 2011).
Table 2.1 GVA by nation (£m in current basic prices) (2008)
Source: Regional Accounts, ONS, 2010
Of the £80bn (in terms of GVA) contribution the transportation and storage sector in England makes, 42 per cent is accounted for by London and the South East (Table 2.2). The first reason for this is the high population density, where London and South East account for 12 and 14 per cent respectively of the total UK population. Secondly, London has direct links with all nations and regions and – which mainly impacts on the air transport sub-sector – is most often used as a distribution point and central communication hub of the transportation and storage companies.
Table 2.2 GVA by English region (£m in current basic prices) (2008)
Source: Regional Accounts, ONS, 2010
Table 2.3 demonstrates how the transport, storage and communication GVA figures have changed since 1999. The sector has seen its GVA increase 41 per cent between 1999 and 2008. This is slightly lower than the UK economy GVA increase of 56 per cent over the same period (Table 2.3).
UK England Scotland Wales
Northern
Ireland
£m £m £m £m £m
Agriculture, hunting, forestry & fishing 9715 7982 1180 145 407 Mining and quarrying of energy producing materials 2661 1298 1277 60 27
Other mining and quarrying 2365 1777 282 134 173
Manufacturing 150298 124860 13555 7734 4149
Electricity, gas and water supply 21342 17414 2653 729 545
Construction 80756 68247 7328 2924 2256
Wholesale and retail trade (including motor trade) 147158 127900 10441 5166 3651
Hotels and restaurants 36428 30938 3297 1424 770
Transport, storage and communication 91347 80262 7065 2529 1491
Financial intermediation 116801 104574 8501 2305 1422
Real estate, renting and business activities 303179 268770 20829 8380 5200 Public administration and defence 63281 51275 6148 3275 2583
Education 76493 64478 6322 3502 2191
Health and social work 93775 76336 9851 4788 2800
Other services 65563 57177 4804 2420 1162
All sectors 1261162 1083288 103533 45515 28827
North East North West
Yorkshire and
The Humber East Midlands West
Midlands East London South East South West
£m £m £m £m £m £m £m £m £m
Agriculture, hunting, forestry & fishing 303 777 966 996 915 1387 86 1168 1383 Mining and quarrying of energy producing materials 81 90 140 130 82 164 280 270 61
Other mining and quarrying 178 142 156 379 84 132 60 202 442
Manufacturing 6706 19336 14332 13299 13974 13518 13651 18084 11961
Electricity, gas and water supply 979 1622 1511 1952 1920 1948 1823 3061 2598
Construction 2990 8236 6266 5835 6588 8946 10262 12482 6643
Wholesale and retail trade (including motor trade) 4424 14906 11348 10850 12313 15933 22016 24588 11522
Hotels and restaurants 1123 3527 2383 2012 2905 3041 7717 5063 3166
Transport, storage and communication 2668 8846 6518 5866 6596 9871 17509 16218 6170
Financial intermediation 2195 8356 6641 3702 5260 9352 48190 13828 7050
Real estate, renting and business activities 7842 26072 17146 16325 20405 29769 74039 55440 21733
Public administration and defence 2623 5843 4753 3919 4376 5634 7642 10218 6267
Education 3156 8008 6302 4877 6541 6725 11972 10861 6036
Health and social work 4004 10080 7552 5894 7215 8201 13719 11975 7696
Other services 1715 5174 3459 3314 4583 5577 18190 10551 4615
Table 2.3 UK GVA (£m in current basic prices) (1999-2008)
Source: Regional Accounts, ONS, 2010
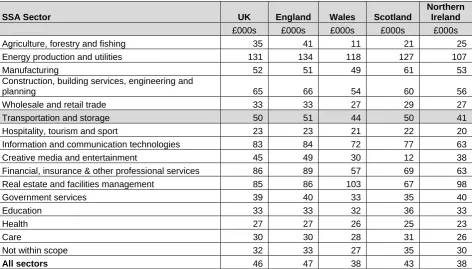
Sectors differ in the level of ‘added value’ generated per employee job. Table 2.4 highlights these differences and it also shows the variation across the nations within sectors.
Estimated gross value added (GVA) per employee job in the transportation and storage sector is greater than the all economy average for the UK and for each of the four nations. At a UK level the sector’s GVA is approximately £50,000, but this decreases to £41,000 for Northern Ireland, £44,000 within Wales, with England and Scotland both close to the UK average.
1999 2000 2001 2002 2003 2004 2005 2006 2007 2008
£m £m £m £m £m £m £m £m £m £m
Agriculture, hunting, forestry & fishing 9022 8532 8333 9007 9807 10670 7530 7792 8632 9715 Mining and quarrying of energy producing materials 2059 1998 1874 1661 1456 1643 2055 2297 1861 2661
Other mining and quarrying 1700 1784 1750 1469 1519 1848 2115 2145 2291 2365
Manufacturing 151157 150009 149223 146308 144845 145689 148110 151455 154726 150298
Electricity, gas and water supply 15703 15798 15660 16052 16405 16106 16685 20279 21884 21342
Construction 42236 45626 50526 54684 59522 66029 69868 74619 80675 80756
Wholesale and retail trade (including motor trade) 99509 103410 110249 113777 120520 127367 129810 135366 141735 147158
Hotels and restaurants 24146 25605 26928 28639 30120 31870 32902 34594 35962 36428
Transport, storage and communication 64961 69201 70502 73064 76587 79020 80889 83655 88280 91347
Financial intermediation 48545 44989 48202 63367 71530 75117 79553 90807 103731 116801
Real estate, renting and business activities 173329 188361 204041 214849 232204 248677 260116 276108 296955 303179 Public administration and defence 39891 41645 43855 46212 49768 53779 58229 60385 61503 63281
Education 44914 48111 51675 55099 58328 61934 65739 68926 72766 76493
Health and social work 51577 55282 59549 64492 70593 75154 79965 85965 89381 93775
Other services 39821 42085 44560 48311 51804 54947 57961 60166 62824 65563
Table 2.4 Estimated workplace gross value added (GVA) per employee job at current basic prices, 2009
SSA Sector UK England Wales Scotland
Northern Ireland
£000s £000s £000s £000s £000s
Agriculture, forestry and fishing 35 41 11 21 25
Energy production and utilities 131 134 118 127 107
Manufacturing 52 51 49 61 53
Construction, building services, engineering and
planning 65 66 54 60 56
Wholesale and retail trade 33 33 27 29 27
Transportation and storage 50 51 44 50 41
Hospitality, tourism and sport 23 23 21 22 20
Information and communication technologies 83 84 72 77 63
Creative media and entertainment 45 49 30 12 38
Financial, insurance & other professional services 86 89 57 69 63
Real estate and facilities management 85 86 103 67 98
Government services 39 40 33 35 40
Education 33 33 32 36 33
Health 27 27 26 25 23
Care 30 30 28 31 26
Not within scope 32 33 27 35 30
All sectors 46 47 38 43 38
Source: UK Commission estimates based on Regional Accounts; Annual Business Survey; Business Register and Employment Survey (BRES). See technical appendix for basis for estimates.
Notes: Figures for Real estate and facilities management sector include contribution from owner-occupier imputed rental. All figures exclude Extra-Regio element. Estimates will tend to overstate the level of GVA per job in those sectors with high levels of self-employment.
The Working Futures model (Wilson and Homenidou, 2011) provides historic estimates of productivity (output per job) by sector on a constant price (chained volume measure) basis. This analysis indicates an average rate of productivity growth for the UK transportation and storage sector for the first half of the last decade (2000-2005) of 0.5 per cent per annum. This is much lower than the average rate for the wider UK economy of 1.4 per cent. Moreover, productivity is believed to have fallen in the second half of the decade as the recession hit. However, Working Futures does forecast future rates of productivity growth for the sector that are similar to the average for the wider economy as the recovery takes hold.
Looking closer at sub-sector level there is a wide variation in the ‘added value’ per job2:
2
Land transport – £42,140
Water transport - £180,560 (England & Scotland only)
Air transport - £67,180
Warehousing and support activities - £68,500
Postal and courier activities - £29,260.
The postal and courier activities sub-sector is the least productive while water transport is the most. The reason for the latter having the highest GVA per employee is the result of sea and coastal freight generating significantly larger revenues. For that reason, the strong productivity figure for water transport does not reflect the slowdown faced by other industries, which reported a 41 per cent decrease in economic output between 2008 and 2010, while its staff wages are the lowest within the sector.
Anecdotal evidence showed that in passenger transport this is caused mainly by the rising price of fuel and the economic slowdown, which decreased the regular flow of users. The impact of the rising fuel prices is greater in the case of waterways, as – unlike the air transport sub-sector – it is not protected by fuel hedges and hence more volatile and exposed to the price fluctuations.
Of the sub-sectors with the majority made up of passenger services, air transport has the largest GVA per job. This stems from the character of the sub-sector, which covers long distances and is on average much more costly operationally than any other mode of transportation.
2.1.2 Productivity and competitive nature of the sector
A further key variable in the assessment of the economic performance of a sector is productivity. Total Factor Productivity (TFP) growth is one productivity measure. Gains in TFP are not the result of any physical investment but rather associated with broad-based technical change and business process reorganisation (McGuckin et al. 2005).
Figure 2.1 Total factor productivity growth for the transportation and storage sector
Source: EU KLEMS Growth & Productivity Accounts: November 2009 Release
The competitive position of the logistics sector is determined by a number of demands. These include the price, characteristics and features of the product, the location of customers, the time requirements of the customers, and the variability in demand. It also relates to the relative importance of each of these attributes and the extent to which these attributes are changing or stable over time. The economic and technological trends which shape the global marketplace and the capabilities of managers can also influence the competitive position of companies.
The operational cost of distribution facilities is an important factor that influences regional competitiveness in logistics. High warehouse costs usually reflect high economic activity and overcrowding, while low warehouse costs usually reflect economic stagnation and poor infrastructure. However, low warehouse cost alone will not attract logistics companies. Being close to where the economic activity takes place is more important. Nevertheless, some shift is likely. As companies in the UK, have sought to make economies of scale in warehousing and storage, there has been a strategic move by businesses towards the East and West Midlands. Regional Distribution Centres (RDCs) have been set up in strategic locations to take advantage of lower land prices away from the South East, which in turn helps to justify investments in complex automated handling systems.
Therefore, the competitive advantage of a logistics company will depend upon their logistics capabilities, such as transportation, warehousing and management techniques, relative to other firms in the industry. Many of the larger operators undertake several logistics roles, having extended their reach beyond their original core business to other sub-sectors. Major players like Royal Mail, Wincanton, DHL, Tesco Distribution Ltd, TNT and Kuehne & Nagel dominate the UK market and tend to offer the most sophisticated and innovative services. It is noteworthy that a large number of small and medium sized companies service niche markets.
As far as passenger transport is concerned, it is the passenger air services that are directly exposed to international competition. Airport Council International (ACI, 2011) classifies London Heathrow airport as the fourth busiest passenger hub in the world, with Atlanta, Beijing and Chicago serving larger numbers of air passengers. The 2010 Skytrax survey ranks Heathrow as 21st of 163 airports worldwide for the quality of its infrastructure. Gatwick is ranked as 64th and Stansted as 99th. At the same time, British Airways is classified as a 4-star airline (Skytrax, 2012). However, the global competition arises in areas of the world previously not considered to be a threat to the British air transport. Dubai’s Emirates has recently grown to be the world’s largest airline in terms of scheduled international passenger kilometres flown, while Dubai airport is already the 13th largest in terms of passenger numbers (ACI, 2011). At the same time, Qatar’s Doha is preparing to unveil their newest hub, targeting specifically transfer passengers from Northern America and Europe – the main consumer base of the British passenger air transport.
Once compared with their international equivalent, UK’s other passenger transport sub-sectors face significant comparisons with newly built networks within some of the emerging market economies. As George Osborne stated in the 2011 Autumn Statement, “See what countries like China and Brazil are building and you’ll see why we risk falling behind the rest of the world”. This refers directly to the UK’s rail system, which – despite being the 18th longest rail network in the world – is also one of the oldest, slowest and most overloaded (International Union of Railways 2009). The railways are carrying more passengers than at any time in the last six decades, and yet many passengers find them too expensive for what they offer and not connected well enough to other modes of public transport (Passenger Focus 2011). This is perhaps the main driver behind the government’s recently announced investment under the National Infrastructure Plan and the plans for High Speed 2 network, connecting London, Birmingham, Manchester and Leeds. This will impact directly the skills requirements for the sector’s workforce. Train drivers will need to be trained to be able to operate the new trains. Engineers will have to be familiar with the peculiarity of the new permanent way (rail tracks). Finally, exploiting the potential of the new infrastructure and the new rolling stock (trains) will require good management and leadership skills.
2.1.3 Employer
profile
2.1.3.1 Establishments
The number of establishments across the UK economy comprises approximately 2.57m. 85 per cent of these are located in England, eight per cent in Scotland, four per cent in Wales and Northern Ireland has three per cent of all establishments (Table 2.5).
The transportation and storage sector has a total of 83,825 establishments and accounts for three per cent of all establishments in each nation. The sector has a similar distribution across the nations as per the whole economy, with the majority based in England.
Table 2.5 Number of establishments by sector and nation (2010)
Source: Inter-departmental Business Register (IDBR), ONS
The number of establishments in the English regions varies considerably for both the sector and economy (Table 2.6). In the sector, the South East has the highest number with nearly 11,600 establishments, followed by the East of England and London, with 9,300 and 9,200 respectively. The North East has the smallest number. Freight and passenger transport are driven by the needs of people and businesses and are therefore situated where industries are based, where goods are sourced and where people live.
Number % Number % Number % Number % Number %
Agriculture, forestry and fishing 144895 6% 96770 4% 17625 9% 14210 13% 16290 19%
Energy production and utilities 13290 1% 10365 0% 1495 1% 865 1% 565 1%
Manufacturing 144115 6% 124235 6% 9395 5% 6040 5% 4445 5%
Construction, building services, engineering and planning 358455 14% 303300 14% 27845 14% 14280 13% 13030 15%
Wholesale and retail trade 509215 20% 431330 20% 38165 20% 23000 20% 16720 20%
Transportation and storage 83825 3% 70685 3% 6370 3% 3925 3% 2845 3%
Hospitality, tourism and sport 223370 9% 185390 8% 20515 11% 11580 10% 5885 7%
Information and communication technologies 131065 5% 120095 5% 6610 3% 3130 3% 1230 1%
Creative media and entertainment 134115 5% 121900 6% 6830 4% 3640 3% 1745 2%
Financial, insurance & other professional services 255000 10% 228725 10% 14770 8% 7160 6% 4345 5% Real estate and facilities management 149325 6% 129340 6% 10610 5% 5730 5% 3645 4%
Government services 52210 2% 40870 2% 5625 3% 2985 3% 2730 3%
Education 67125 3% 55020 3% 5535 3% 3250 3% 3320 4%
Health 55135 2% 46925 2% 3895 2% 2515 2% 1800 2%
Care 85935 3% 70460 3% 7810 4% 4710 4% 2955 4%
All economy 2574230 100% 2183845 100% 193305 100% 112810 100% 84270 100%
Northern Ireland
Table 2.6 Number of establishments by sector and English region (2010)
Source: Inter-departmental Business Register (IDBR), ONS
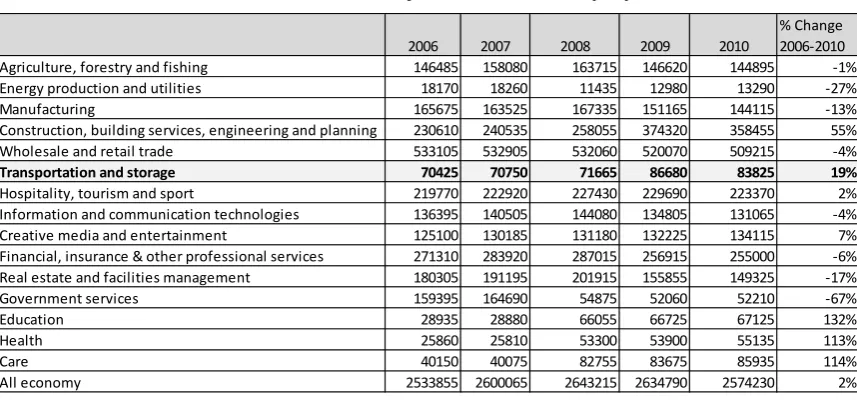
Overtime the number of establishments across the economy and sector has altered. Since 2006, the number of sector establishments has increased from 70,425 to 83,825. This is a change of 19 per cent, greater than the two per cent growth seen across the economy and is just one of seven sectors to see a positive change (Table 2.7). Generally these growth sectors are closely interlinked to the transport sector. For example, the goods needed for construction need to be transported to the sites. At the same time, the passenger transport side of the sector is strongly linked to another growing sector, the hospitality, tourism and sport, which also grew by two per cent in the four years to 2010.
The number of establishments across the sector in 2010 was slightly lower than that in 2009, reflecting the overall decrease across the economy of two per cent. This can likely be attributed to the poor economic situation the UK and other countries have been experiencing since 2008. In addition a number of mergers and acquisitions have occurred. Even larger operators have been affected, for example, British Airways merged with Iberia in order to strengthen their market position.
The overall increase in transportation and storage establishments between 2006 and 2010 has not been uniform across the four nations. The sector saw a 19 per cent increase across England, a 22 per cent increase in Scotland, 16 per cent in Wales and 14 per cent in Northern Ireland.
North East North West
Yorkshire and The Humber
East Midlands
West
Midlands East London South East South West Agriculture, forestry and fishing 3870 11305 11205 10770 11880 12170 935 11785 22850 Energy production and utilities 475 1460 1155 1025 1065 1320 950 1605 1310
Manufacturing 4650 15950 13100 12915 15930 15235 13350 20025 13080
Construction, building services, engineering and planning 10845 35520 26035 24975 28750 41485 42520 58785 34385 Wholesale and retail trade 16630 55955 41975 36895 45695 48635 67620 71850 46075
Transportation and storage 2610 8775 7270 6830 7930 9305 9190 11570 7205
Hospitality, tourism and sport 8395 23095 17600 14030 16700 19290 32470 31885 21925 Information and communication technologies 2325 10885 6685 6900 9260 14735 29655 28805 10845 Creative media and entertainment 2660 10035 6735 6215 7425 12210 43255 22760 10605 Financial, insurance & other professional services 5440 23475 14900 14950 18300 23850 61915 45495 20400 Real estate and facilities management 4185 14800 10225 9390 11925 15045 27475 22980 13315
Government services 1815 4810 4260 4270 4040 4215 6495 6340 4625
Education 2495 6890 4965 4810 5465 6330 8215 9925 5925
Health 2010 6255 4265 3830 4570 4850 8045 8280 4820
Care 3575 9340 6950 6110 6940 7210 10725 11700 7910
Table 2.7 Number of establishments by sector 2006-2010 (UK)
Source: Inter-departmental Business Register (IDBR), ONS
Note: Data for 2006-2008 is based on SIC 2003 whereas data beyond this use SIC 2007.Some of the data for 2006-2008 is based on estimates .For full details please see technical appendix.
The distribution of establishments by sub-sectors varies substantially:
Land transport – 57 per cent (47,690)
Water transport – two per cent (1,545)
Air transport – two per cent (1,410)
Warehousing and support activities – 19 per cent (16,140)
Postal and courier activities – 20 per cent (17,040)
However this is reflective of the sector’s nature, whereby land transport is the primary nature of movement for both freight and passengers.
2.1.3.2
Size of establishments
Understanding the size of establishments is important as this has implications on skills development. Larger businesses, employing more than 100 employees, are more likely to offer formal training through their own in-house training or via private training providers. Small businesses struggle with providing training on a number of levels. Firstly, assessing the necessary information is often an obstacle. Secondly, small operators avoid releasing employees for training. This is partially determined by the fear of poaching but also difficulties in finding tailored training and the lack of economy of scale, which means costs are higher (Stone 2010).
2006 2007 2008 2009 2010
% Change
2006‐2010
Agriculture, forestry and fishing 146485 158080 163715 146620 144895 ‐1%
Energy production and utilities 18170 18260 11435 12980 13290 ‐27%
Manufacturing 165675 163525 167335 151165 144115 ‐13%
Construction, building services, engineering and planning 230610 240535 258055 374320 358455 55%
Wholesale and retail trade 533105 532905 532060 520070 509215 ‐4%
Transportation and storage 70425 70750 71665 86680 83825 19%
Hospitality, tourism and sport 219770 222920 227430 229690 223370 2%
Information and communication technologies 136395 140505 144080 134805 131065 ‐4%
Creative media and entertainment 125100 130185 131180 132225 134115 7%
Financial, insurance & other professional services 271310 283920 287015 256915 255000 ‐6%
Real estate and facilities management 180305 191195 201915 155855 149325 ‐17%
Government services 159395 164690 54875 52060 52210 ‐67%
Education 28935 28880 66055 66725 67125 132%
Health 25860 25810 53300 53900 55135 113%
Care 40150 40075 82755 83675 85935 114%
The employer landscape is dominated by small establishments. There are 31,205 sole traders within the sector. Many of these are accounted for by taxi and private hire drivers, who largely consist of self-employed individuals.
Even when sole traders are excluded nearly half (48 per cent) of establishments in the sector are very small, employing between two to four people (Table 2.8). A further 36 per cent have between five and 24 staff, meaning that more than four in five establishments employ fewer than 25 people. By contrast, only one per cent of the establishments employ 250 or more staff.
Some sub-sectors show an even larger dependency on small businesses. For example, freight transport by road, and taxi and private hire operators are dominated by companies that employ less than five people (76 and 74 per cent respectively) (IDBR 2010). This stems mainly from the character of the industries, where drivers often own their vehicles, obtain licences and register as transport operators, managing the businesses on their own.
Table 2.8 Size of establishments by sector (UK) (2010)
Source: Inter-departmental Business Register (IDBR), ONS
Table 2.9 details this breakdown for the UK economy and Table 2.10 highlights the data for the transportation and storage sector, across the nations.
2‐4 5‐9 10‐24 25‐49 50‐250 251+ All
% % % % % % Number
Agriculture, forestry and fishing 80 14 5 1 0 0 97,910 Energy production and utilities 36 22 20 10 10 2 10,265
Manufacturing 43 22 18 8 8 1 108,050
Construction 67 18 10 3 2 0 211,710
Wholesale and retail trade 49 27 16 4 3 1 385,760
Transportation and storage 48 20 16 7 8 1 52,620
Hospitality, tourism and sport 42 30 19 6 3 0 198,630 Information and communication technologies 68 15 10 4 3 1 56,710 Creative media and entertainment 66 17 10 4 3 0 62,305 Financial, insurance & other professional services 57 21 14 4 3 1 134,900 Real estate and facilities management 62 21 11 3 3 1 95,270
Government services 34 21 20 10 12 4 41,505
Education 20 14 20 23 21 2 56,740
Health 31 24 25 10 7 2 47,570
Care 26 24 28 13 8 0 75,725
All economy 52 22 15 6 4 1 1,742,370
Table 2.9 Size of establishments by nation (2010)
Source: Inter-departmental Business Register (IDBR), ONS
The sector mirrors the overall economy in terms of distribution by size across the nations (Table 2.9 and Table 2.10).
Table 2.10 Size of establishments within sector by nation (2010)
Source: Inter-departmental Business Register (IDBR), ONS
Within the sub-sectors there are variations in the size distributions of establishments (Table 2.11). All are dominated by companies employing less than 25 employees, ranging from 71 per cent in the air transport sub-sector to 89 per cent for water transport sub-sector.
15 per cent of water transport companies employ over 100 individuals, but this falls to six per cent in postal and courier activities, five per cent in warehousing and support activities and three per cent each for land and air transport.
Table 2.11 Size of establishments within sub-sectors (2010)
Source: Inter-departmental Business Register (IDBR), ONS
Number % Number % Number % Number % 2‐4 767,415 52 66,560 48 44,675 54 30,175 52 5‐9 323,815 22 33,775 24 18,005 22 13,395 23 10‐24 215,295 15 23,090 17 11,910 14 9,175 16 25‐49 82,055 6 8,330 6 4,170 5 3,265 6 50‐250 63,865 4 6,405 5 3,130 4 2,145 4 251+ 9,915 1 1,030 1 505 1 270 0 Total 1,462,360 100 139,190 100 82,395 100 58,425 100 England Scotland Wales Northern Ireland
Number % Number % Number % Number %
2‐4 20,940 48 1,985 44 1,355 52 935 50
5‐9 8,645 20 945 21 525 20 445 24
10‐24 6,895 16 835 18 405 15 255 14
25‐49 3,095 7 385 9 165 6 105 6
50‐250 3,385 8 325 7 155 6 130 7
251+ 640 1 50 1 10 0 10 1
Total 43,600 100 4,525 100 2,615 100 1,880 100
England Scotland Wales Northern Ireland
Number % Number % Number % Number % Number %
2‐4 15,195 52 530 53 280 36 5,390 43 3,820 42
5‐9 5,955 20 200 20 140 18 2,620 21 1,645 18
10‐24 4,535 16 160 16 125 16 2,250 18 1,320 14
25‐49 1,570 5 55 5 50 6 1,080 9 995 11
50‐250 1,535 5 55 5 125 16 1,065 8 1,215 13
251+ 290 1 5 0 50 6 195 2 170 2
Total 29,080 100 1,005 100 770 100 12,600 100 9,165 100
Land Transport Water transport Air Transport
Warehousing and Support Activities
The land transport sub-sector plays a significant role in bringing down the average size of establishments within the sector, mainly due to its fragmented nature. Despite some large players like Eddie Stobart, Wincanton, NYK, National Express, Arriva, Addison Lee and Virgin Trains, the sub-sector encompasses family-owned businesses, especially in the case of coach and freight transport by road.
2.1.3.3 Business
start-ups and closures
The continual entry and exit of businesses is crucial to the growth of an economy. It is thought to impact productivity through increased competition leading to greater cost efficiency. Innovative firms enter the market, introducing new, improved products and technologies and processes that replace old ones.
Overall the UK economy experienced more closures than openings during 2009 (Table 2.12), with construction, and wholesale and retail experiencing the greatest differences. The poor economic conditions and lower consumer spending are likely to be a factor. It is therefore not surprising that the transportation and storage sector also saw more closures than openings, because some of the activities within this sector, such as freight transport, underpin these other sectors.
Table 2.12 Business (enterprise) start-ups and closures 2009 (UK)
Source: Business Demography - Enterprise Births, Deaths and Survivals 2009 (ONS)
Large variations in start-ups can be seen across the sub-sectors (Table 2.13). The start-ups to closures ratio within the sub-sectors often depends on the business profile of the operator and its customers. For example, budget airlines are less likely to fail than business-class only operators, like Eos Airlines’ bankruptcy (The Telegraph 2008). Land transport closure to start-up ratio depends mainly on the size of establishment, as the diversity here is very large, ranging from micro businesses to large companies. As previously mentioned, this can be linked to business closures and mergers.
Table 2.13 Business (enterprise) start-ups and closures by sub-sector 2009 (UK)
Sub‐sector
Start‐ups Closures
Number % Number % %
Land transport
4025 58 6765 63 57
Water transport
200 3 225 2 2
Air transport
210 3 160 1 2
Warehousing and support activities
770 11 1255 12 19
Postal and courier
1775 25 2400 22 20
Source: Business Demography - Enterprise Births, Deaths and Survivals 2009 (ONS)
2.2 Employment
This section provides analysis of the employment levels at a UK and sector level. The historical trends will be highlighted as well as the key occupational roles.
Sector Start‐ups Closures
Number Number
Agriculture, forestry and fishing (SIC 75 only) 285 190
Energy production and utilities 1270 408
Manufacturing 10570 15445
Construction, building services, engineering and planning 35835 51040
Wholesale and retail trade 38760 47090
Transportation and storage 6980 10805
Hospitality, tourism and sport 23345 28030
Information and communication technologies 16120 19935
Creative media and entertainment 24290 20805
Financial, insurance & other professional services 25640 25765
Real estate and facilities management 12805 16275
Government services (SIC 94 only) 1010 1260
Education 3485 3160
Health 4135 3110
Care 2745 2165
Other sectors 28750 32135
Nearly 29m people are in employment in the UK. Of these nearly 1.45m people work within the UK transport and storage sector, accounting for five per cent of UK’s total employment. The sector’s employment split across the four nations can be seen in Table 2.14.
Table 2.14 Total employment by sector and nation (2010)('000s)
Source: Labour Force Survey 2010, ONS
The sector accounts for slightly varying shares of the nations’ and regions’ employment. Within England and Scotland the sector’s share of employment accounts for five per cent, but this falls to four per cent within Northern Ireland and stands at only three per cent in Wales.
Across the English regions, the employment share reaches six per cent in the East Midlands, four per cent in both the South West and North East, while the remaining regions each have a five per cent share (Table 2.15). The East Midlands share is largely a consequence of the numerous logistical companies based in the region such as the distribution centres at DIRFT near Daventry and Magna Park in Lutterworth.
000s % 000s % 000s % 000s % 000s %
Agriculture, forestry and fishing 406 100 296 73 51 13 31 8 27 7 Energy production and utilities 473 100 346 73 88 19 25 5 14 3 Manufacturing 2,970 100 2,542 86 199 7 138 5 91 3 Construction, building services, engineering and planning 2,697 100 2,270 84 244 9 113 4 71 3 Wholesale and retail trade 4,140 100 3,471 84 353 9 205 5 112 3 Transportation and storage 1,448 100 1,252 86 117 8 46 3 33 2 Hospitality, tourism and sport 2,046 100 1,704 83 198 10 100 5 44 2 Information and communication technologies 761 100 675 89 56 7 18 2 13 2 Creative media and entertainment 987 100 876 89 65 7 32 3 14 1 Financial, insurance & other professional services 2,001 100 1,768 88 138 7 53 3 41 2 Real estate and facilities management 978 100 848 87 75 8 38 4 18 2 Government services 2,209 100 1,835 83 173 8 111 5 89 4 Education 3,088 100 2,625 85 235 8 154 5 75 2 Health 2,087 100 1,713 82 199 10 111 5 64 3 Care 1,729 100 1,409 81 183 11 97 6 40 2 Whole Economy 28,855 100 24,331 84 2,446 8 1,312 5 766 3
Unweighted bases 194.448 100 161.501 83 17.022 9 8.693 4 7.232 4
Table 2.15 Total employment by sector and English region, % share within region (2010)
Source: Labour Force Survey 2010, ONS
* Sample size too small for reliable estimate.
In absolute terms, the South East employs the greatest number of individuals in the sector (222,000), followed by London (193,000), the North West (165,000) and the East of England (149,000). This reflects the major transport hubs. For example the South East, London and the East of England have a number of international gateways, with Dover, the channel tunnel, Southampton, Heathrow, Gatwick, Stansted, the Port of Tilbury and Felixstowe, while the North West has the Port of Liverpool and Manchester airport.
Employment in the UK transportation and storage sector, peaked in 2008 with nearly 1.52m workers but since then it has decreased by 69,000 people, most likely as a consequence of the economic climate. Employment in 2010 stands three per cent below the 2002 employment level (Table 2.16) and is one of only five sectors which has seen a contraction in its labour force since 2002. The growing popularity of large scale economies contributes to this trend, as businesses within the sector cut the numbers of staff, but increase their GVA.
The number of business closures across the nations reveals varying employment fortunes between 2002 and 2010. Northern Ireland experienced a positive increase in labour demand of 17 per cent – much greater than the all economy growth of seven per cent. While England, Scotland and Wales all saw a decline in labour of three, four and six per cent respectively.
London South East East of England South West West Midlands East Midlands Yorkshire and the Humber
North
West North East
Agriculture, forestry and fishing * 1 1 3 2 2 1 1 1
Energy production and utilities 1 2 1 2 2 2 1 2 2
Manufacturing 4 9 11 11 14 15 12 12 11
Construction, building services, engineering and planning 9 10 10 9 9 9 9 9 9
Wholesale and retail trade 12 14 14 14 14 16 16 16 15
Transportation and storage 5 5 5 4 5 6 5 5 4
Hospitality, tourism and sport 8 7 6 7 7 7 7 7 7
Information and communication technologies 3 4 3 3 2 2 2 2 2
Creative media and entertainment 8 4 3 3 2 2 2 2 2
Financial, insurance & other professional services 13 8 8 6 6 5 6 6 4
Real estate and facilities management 5 4 3 4 3 3 3 4 3
Government services 8 8 7 7 7 7 8 8 9
Education 10 11 11 11 11 11 11 10 11
Health 6 7 6 7 7 7 8 8 8
Care 5 5 5 6 6 5 6 6 8
Whole Economy 100 100 100 100 100 100 100 100 100
Weighted base 3,726 4,147 2,779 2,515 2,413 2,099 2,382 3,126 1,145
Table 2.16 Total employment by sector 2002-2010 (UK)('000s)
Source: Labour Force Survey 2010, ONS
Within the sub-sectors of the transport sector, employment is distributed as follows:
Land transport – 50 per cent of sector employment
Water transport – three