University of Southern Queensland
Faculty of Engineering and Surveying
Sealing Works Performance Study
A dissertation submitted by
Andrew Jonathan Armstrong
In fulfilment of the requirements of
Course ENG4111 and 4112 Research Project
Towards the degree of
Batchelor of Engineering (civil)
Abstract
Bitumen sprayed seals are an effective and economical road surfacing technique utilised widely across the world. The premature failure of road surfacing can be detrimental to road user safety with some surfacing failures causing a reduction in skid resistance, large profile irregularity and loose stone on the road surface.
This research project was commissioned by the Department of Transport and Main Roads, Queensland. The objective of this dissertation is to develop and implement an evaluation system to ensure effective investigation, design, application and evaluation of bitumen seals. The objectives are focused on roads in the Far North region of Queensland, Australia.
Premature flushing of sprayed seals has been identified as the failure mode of greatest consequence. Flushing causes a reduction in skid resistance and the increased propensity for road crashes. The New Zealand TNZ P17 Performance specification predicts the premature flushing based on texture depth measurements one (1) year after the seal is constructed. The specification has been successfully implemented in New Zealand and America.
The TNZ P17 specification has been adapted to the Far North region road network. However, due to inaccurate data used to modify the specification models the predictions may not reflect the actual seal behaviour in the Far North region. Further data collection and refinement is required.
University of Southern Queensland
Faculty of Engineering and Surveying
ENG4111 & ENG4112
Research Project
Limitations of Use
The Council of the University of Southern Queensland, its Faculty of Engineering and Surveying, and the staff of the University of Southern Queensland, do not accept any responsibility for the truth, accuracy or completeness of material contained within or associated with this dissertation.
Persons using all or any part of this material do so at their own risk, and not at the risk of the Council of the University of Southern Queensland, its faculty of Engineering and Surveying or the staff of the University of Southern Queensland.
Certification
I certify that the ideas, designs and experimental work, results, analyses and conclusions set out in this dissertation are entirely my own effort, except where otherwise indicated and acknowledged.
I further certify that the work is original and has not been previously submitted for assessment in any other course or institution, except where specifically stated.
Andrew Jonathan Armstrong Student Number: 0050085671
___________________________ Signature
Acknowledgments
The author would like to thank: Associate Professor Ron Ayers for his help and guidance; Don Wallace and Christine Stevenson of the Department of Transport and Main Roads, Far North Region, their valuable time and assistance; and my wife, Joanne for her support and understanding during the preparation of this project.
Table of Contents
Abstract...i
Limitations of Use ...ii
Certification ...iii
Acknowledgments ... iv
Table of Contents ... v
List of Figures ...viii
List of Tables...viii
Glossary... ix
1 Introduction... 1
1.1 Background ... 2
1.2 Aims & Objectives ... 3
1.3 Specific Objectives... 3
1.4 Dissertation Overview ... 6
2 Literature Review... 7
2.1 Introduction... 7
2.2 Sprayed sealing ... 7
2.2.1 Types of sprayed seals ... 9
2.2.2 Priming... 9
2.2.3 Primersealing... 9
2.2.4 Surface enrichment ... 10
2.2.5 Seal coats ... 10
2.2.5 Retreatment ... 11
2.3 Materials ... 11
2.3.1 Bitumen... 12
2.3.2 Aggregate ... 13
2.4 Seal Design ... 14
2.4.1 Design Philosophy... 15
2.5 Performance ... 17
2.5.1 Seal life ... 17
2.7 Performance models ... 21
2.7.1 New Zealand performance specification ... 21
2.7.2 Austroads Reseal intervention model ... 23
2.8 Flushing ... 25
2.8.1 Possible mechanisms ... 25
2.8.2 Surface texture... 27
2.9 Evaluation systems ... 28
2.10 Summary... 29
3 Methodology ... 31
3.1 Introduction... 31
3.2 Background information... 31
3.3 Seal properties... 31
3.4 Study area selection... 32
3.4.1 Bruce Highway 10N and 10P... 33
3.4.2 Captain Cook Highway 20A ... 33
3.4.3 Palmerston Highway 21A ... 33
3.4.4 Kennedy Highway 32A and 32B... 34
3.4.5 Gulf Developmental Road 92B ... 34
3.5 Data collection ... 36
3.6 Data Manipulation... 37
3.61 Layer Dataset ... 37
3.6.2 Texture Depth Dataset ... 38
3.7 Validation of Deterioration Model ... 39
3.8 Development of the Far North Region Seal Life Model ... 39
4 Results & Analysis... 41
4.1 Introduction... 41
4.2 Validation of Model ... 41
4.2.1 Seal Life ... 41
4.2.2 Texture depth deterioration... 45
4.3 Far North Region Seal Life Model... 48
Appendices ... 57
Appendix A Project Specification ... 57
Appendix B TNZ P17 Specification ... 59
Appendix C ARMIS layer data sample... 77
Appendix D ARMIS yearly texture depth data sample ... 79
Appendix E Matlab program script... 82
Appendix F yearly texture depth charts ... 91
List of Figures
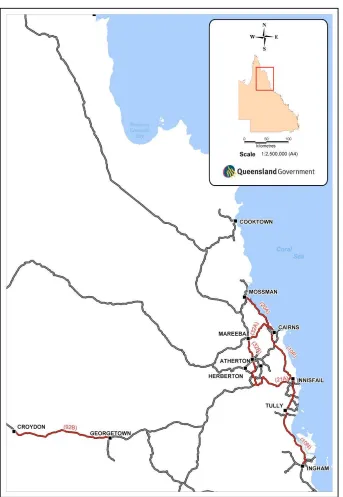
Figure 1-1Far North Region Map ... 3
Figure 2-1 Aggregate particle... 13
Figure 2-2 Seal design process schematic... 16
Figure 2-3 Survey of mean seal life in Australia and New Zealand... 18
Figure 2-4 Precision of the Austroads model... 24
Figure 3-1 Map of the study area... 35
Figure 4-1 7mm seal age in far north region ... 42
Figure 4-2 10mm seal age in far north region ... 43
Figure 4-3 14mm seal age in far north region ... 44
[image:9.612.131.481.97.472.2]Figure 4-4 16mm seal age in far north region ... 45
Figure 4-5 Texture depth deterioration of a 10mm seal on 21A in Far North Region ... 46
Figure 4-6 Yearly texture depth of a 10mm seal on 21A in Far North Region ... 47
Figure 4-7 Maximum seal life as a function of ALD ... 49
Figure 4-8 Rate of deterioration of seal life as a function of ALD ... 50
Figure 4-9 Far North Region seal life prediction ... 51
Figure 4-10 TNZ seal life prediction ... 51
List of Tables
Table 2-1 Mean life of seals for specific aggregate sizes ... 17Table 2-2 Austroads model Variable Range ... 24
Glossary
AADT Annual Average Daily Traffic, typical number of vehicles using a section of road in one day
AAPA Australian Asphalt Pavement Association, AAPA represents Australia’s manufacturers and practitioners of asphalt and other bitumen products
ALD Average Least Dimension of an aggregate particle
ARMIS A Road Management Information System
ARRB Australian Road Research Board
Austroads Austroads is the association of Australian and New Zealand road transport and traffic authorities and aims to promote improved road transport outcomes
C170 grade of bitumen, where the viscosity at 60oC is 170 Pa.s
Chainage measurement along the length of a road from a reference point
DTMR Department of Transport and Main Roads, Queensland state road authority, formally know as the department of Main Roads
elv equivalent light vehicles, assumes a heavy vehicle is the equivalent of 10 light vehicle
MATLAB A high-level language program that enables you to perform computationally intensive tasks
MPD Mean Profile Depth, unit of texture depth measurement by a mobile sensor
OH&S Occupational Health and Safety
SPTD Sand Patch Texture Depth
SRA State Road Authority
TNZ Transit New Zealand, road authority of New Zealand
1
Introduction
Bitumen sprayed seals are an effective and economical road surfacing technique utilised widely across the world. Countries such as Australia, New Zealand and South Africa are considered the world leaders in the delivery of high quality bitumen sprayed seals. This expertise is necessitated by the widely separated population centres and limited funding available.
In Australia, the mean seal life on State controlled roads is 10.3 years. In some situations the design life of seals are not being met, with anecdotal evidence suggesting that the number of seals failing prematurely is increasing. The premature failure of road surfacing can be detrimental to road user safety with some surfacing failures causing a reduction in skid resistance, large profile irregularity and loose stone on the road surface. The re-treatment of failed seals is costly, in some circumstances costing more than the initial seal treatment.
The Queensland Department of Main Roads, Far North region, has commissioned this project to develop and implement an evaluation system to ensure effective investigation, design, application and evaluation of bitumen seals.
The premature failure of bitumen sprayed seals is a world-wide problem. While this research project will only consider the small study area of the Far North Queensland region, this research is intended to have relevance across the globe.
1.1 Background
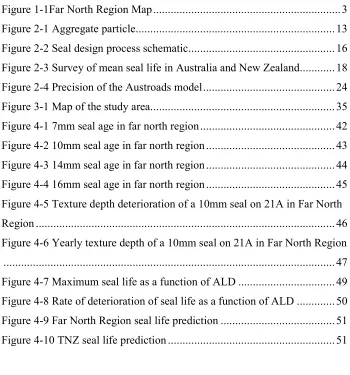
The department of Main Roads, Queensland, is the State Road authority managing 33,500km of state-controlled road network as part of an integrated transport system. State controlled roads account for approximately 20% of the state’s total road network and carry approximately 80% of the state’s traffic. The state is divided into 12 regions, with each responsible for the state-controlled road network in the region.
Mid 2009 saw the amalgamation of the Department of Main Roads and Queensland Transport. The new organisation is now the Department of Transport and Main Roads, however for this project will be referred to as the Department of Main Roads.
Figure 1-1Far North Region Map
1.2 Aims & Objectives
The project aims to develop and implement an evaluation system to ensure effective investigation, design, application and evaluation of bitumen seals for the Far North region of the Department of Main Roads.
1.3 Specific Objectives
The specific objectives for this project have been taken from the project specification. This section will explain each of the objectives.
The first point of this project is to research information to better understand what is required and how a solution may be met. To understand how a seal will fail, it is important to research the seal defects, associated mechanisms and how they affect the performance of the seal. To avoid re-inventing an evaluation system, any existing systems are researched to assess the relevance to the failure modes.
2. Decide which seal properties to evaluate eg. Skid Resistance, Texture depth etc.
Based on the research, the seal properties to be evaluated are chosen based on a number of factors pertaining to the failure mode and its implication.
3. Develop and document a system that will evaluate as-constructed sealed works properties against the properties predicted by design.
Having selected a seal property, or properties, a system is developed to assess how the seal property performs. The system may already exist, for which it will need to be assessed for suitability in the study area.
4. Select a suitable geographical area in which to implement a trial of the evaluation procedure.
The study area is selected as to reduce the number of variables that may affect the evaluation system.
Data is collected within the study area to assess the evaluation system with respect to the data. The Department of Main Roads holds a large collection of current and historical road asset data.
6. After analysing the results of the trial study, carry out any necessary modifications to the proposed evaluation system.
Depending on the suitability of the evaluation system, modification of the models used in the system may require modification to better reflect the seal property behaviour in the study area.
7. Report on the results of the project in the required oral and written formats.
The process used to develop the seal performance evaluation system will be documented. This will ensure that the model developed specifically for the study area may modified for use outside the study area.
If time permits:
8. Develop a testing plan to be used on future sealed works.
A testing program would be used to ensure that seal data relevant to the seal evaluation system is collected to further develop and refine the system. The program should detail the seal properties to be assessed, testing location and a testing schedule to ensure that the data is collected at the correct seal life.
9. Assess other sealed works for further modelling.
1.4 Dissertation Overview
Chapter 1 covers the introduction, background and a brief summary on the specific objectives of this project.
Chapter 2 encompasses the literature review with an introduction and summary of elements of sprayed seal performance. The review covers terminology and definitions, existing performance evaluation systems and seal design.
Chapter 3 describes the methodology and procedures employed to deliver this project.
Chapter 4 analyses and discusses the results of the projects. The discussion covers the evaluation system models, the model development and data collection.
2
Literature Review
2.1 Introduction
The literature review is a major component of the research project. The review is used to collate information relevant to the project objectives. The focus of this literature review is on sprayed sealing and associated design, performance and defects. An investigation into the existing seal evaluation systems and performance models was also performed.
2.2 Sprayed sealing
Sprayed seal works is an important component in the performance of road pavements in Australia. According to Austroads (2009), currently there is no surfacing other than a sprayed seal that can be considered as an alternative, given the distance involved and the limited funding available. A widely separated population necessitates development of outstanding skills in low-cost roadmaking techniques of which the use of sprayed sealing treatments is a key element. Thus such countries as Australia, New Zealand and South Africa are more highly developed than most other countries at effectively using sprayed seals as initial treatments and re-treatments.
Austroads (2003a) states that successful sprayed seal work involves:
• Selection of treatments appropriate to site conditions and performance requirements.
• A design process for determination of binder and aggregate application rates.
• Selection of appropriate equipment and suitably trained personnel.
• Control of aggregate and binder supply.
• Stockpile site management and preparation of aggregates.
• Selection of and incorporation of appropriate cutter oil proportions and/or binder additives depending on climate, weather and traffic conditions.
• Spraying of binder at correct temperature and application rate.
• Prompt spreading of aggregate at correct spread rate.
• Effective rolling and aftercare.
• Traffic site management and other OH&S issues.
2.2.1 Types of sprayed seals
The correct choice of sprayed seal treatment is imperative to the success of the treatment. AAPA (2009) details various treatments and their application. Such treatments are:
• Priming
• Primersealing
• Surface enrichment
• Seal coats
• Retreatment
2.2.2 Priming
The application of a suitable primer to a new or reconstructed, prepared pavement as a preliminary treatment. This is to hold the pavement and to assist in achieving a good interfacial bond between the pavement and the seal coat or asphalt.
The function of the primer is to deal with surface dust, seal surface pores in the pavement material, strengthen the pavement near its surface and to waterproof the pavement binding material.
It is recommended to prime all freshly constructed pavements prepared for initial treatments in warmer and drier times of the year. Where traffic exceeds 300 vehicles per lane per day (v/l/d), the alternative of primersealing is recommended to avoid inconvenience to traffic.
2.2.3 Primersealing
Primerseals require a final seal treatment when the bitumen is nearly or fully oxidised. Regular inspection of the primerseal should be carried out to determine when retreatment is required.
2.2.4 Surface enrichment
Surface enrichment is the application of a bituminous material to an existing bituminous surface with the aim to increase the binder content of the surface and extend its life. This is generally done without aggregate but may be done using a light cover of small aggregate to minimise delay to traffic. This treatment is usually most suited to low traffic areas or where traffic may be detoured.
2.2.5 Seal coats
Seal coats are an application of bituminous material covered with a layer of aggregate. These are generally subdivided into 2 groups, initial treatments and re-treatments.
An initial treatment is a seal on a newly constructed or reconstructed road pavement. This may include more than one seal provided it was included in the original treatment design.
The most common forms of initial treatment are:
• A prime and seal
• A primerseal followed by a final seal
• A light seal (prime and seal) followed by a final seal.
A Multiple application (double/double) seal is more than one application of binder with each application covered with aggregate. Generally these seals do not exceed two applications with the second coat of aggregate being half the size of the initial aggregate. Predominantly double/double seals are used to provide a heavy sprayed seal coat in areas of high loading and stress, where a more robust treatment is required than that provided by a single/single seal.
Two aggregate seals (single/double) consist of one coat of binder and two applications of aggregate. The aggregate is usually of two sizes with the second application being half the size of the first. This is usually only used in the case of bleeding seal coats, to provide sufficient surface texture and a running surface to allow the bitumen to set.
2.2.5 Retreatment
This is more commonly referred to as a reseal, and is a periodic maintenance seal over an existing bituminous surface. The need to reseal is influenced by:
• Standards set by the authorities
• Availability of funds
• Criteria assessed
• Maintenance practices
2.3 Materials
Sprayed seals consist mainly of only two (2) resources, a bituminous binder and aggregate.
2.3.1 Bitumen
The bituminous binder used predominantly in sprayed seal surfacing is produced from the refining of crude petroleum oil. Bitumen behaves as a thermoplastic material, meaning that it will soften with the application of heat and returns to its initial state on cooling. AAPA (2009) recognises the properties that make bitumen a desirable binder material for road manufacture are:
• Chemical inertness
• Water resistance
• Natural adhesiveness
• Flexibility and ductility
• Durability
• Non-toxicity
In other countries, such as America, bitumen is referred to as ‘asphalt’ or ‘asphalt cement’. The American term leaded to confusion as in most countries, including Australia, asphalt describes a mixture of bitumen and aggregate which forms a paving material.
The crude oil is distilled by heating, to evaporate the lighter fractions and leave a liquid residue. This residue is processed to produce a soft bitumen. Bitumen hardens by reacting with oxygen in the air. The higher the surface temperature, the faster the oxidation rate.
2.3.2 Aggregate
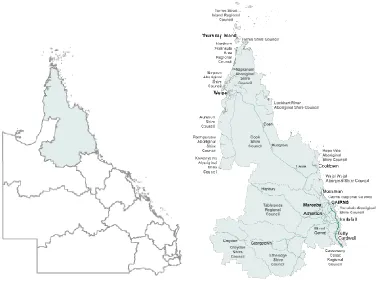
[image:24.612.211.401.259.421.2]Aggregates are classified based on physical properties. Aggregate classification provides for efficient usage of available materials and enables an aggregate of adequate quality to be specified for a particular application. Sprayed seals are commonly characterised by the nominal aggregate size, however it is the Average Least Dimension (ALD) of the aggregate that is an important characteristic for the seal design. The ALD is the smallest dimension of an aggregate particle and is generally vertical when the aggregate is in its most stable orientation. Figure 2-1 displays an aggregate particle with dimension A being the average least dimension.
Figure 2-1 Aggregate particle
Aggregates should be specified in accordance with the traffic loads and expected seal life. AAPA (2009) suggests that where appropriate a lower satisfactory classification could be used on a road with low traffic volume or short design life. The Australian standard AS 2758 reflects the quality of local material as well as a basic minimum standard and performance criteria. The aim of the specification is to obtain aggregates that are:
• Sound and durable
• Well shaped (cubical)
• Clean and uniformly graded
• Resistant to polishing
Aggregate grading is usually specified by the following requirements Specified size – 60-70% should be in range
Tolerance on oversize – 15-20% maximum
Tolerance to undersize – 2% maximum dust content
2.4 Seal Design
Research by Holtrop (2007) found that Australian practice compares favourably against the practices used in New Zealand and South Africa, and the difference is mainly only in the detail.
In 1992, Austroads commissioned a project with the aim of improving reliability of design by measuring existing pavement conditions and their influence on the design process and sprayed seal performance. The provisional ‘Revision 2000’ design method was the outcome of the project (Austroads 2003).
The Austroads ‘The design of Sprayed Seal Surfacing (2006)’ is the design method used currently in Australia. This update is derived from a combination and consolidation of the two earlier guides; ‘Practitioners guide to the design of sprayed seals’ (Austroads 2002) and ‘Austroads Provisional sprayed seal design method’ (Austroads 2001). The document has been extended to include a section on treatment selection. Correct treatment selection is essential, as failure to do so may result in a treatment that cannot provide the appropriate surfacing characteristics and performance.
Several aspects of the seal design method still need to be investigated and require collection of further data. These aspects include matters such as:
• Potential embedment of aggregate.
2.4.1 Design Philosophy
The design philosophy of the current Austroads sprayed seal design guide is based loosely on the concept originally proposed through Austroads 2009, by Hanson (1935) (Austroads 2003b), ‘To achieve a satisfactory sprayed seal, the voids within the sealing aggregate mosaic should be filled to about one-half to two-thirds with binder’. The design philosophy adopted applies principally to the design of the most common type of sprayed seal, the single/single seal using conventional bitumen. Satisfactory performance has been given by other seal types that have been designed using the philosophy based on the single/single seal. Some assumptions used in the design of the single/single seal are:
• Aggregate is single sized and of appropriate quality
• Average least dimension (ALD) of the aggregate must be representative of the aggregate being used
• Design traffic volume is expressed in vehicle/lane/day and based on Average Annual Daily Traffic (AADT)
• Aggregate is spread in a uniform layer of one stone thickness with the least dimension near vertical
• There is no separate allowance made for whip-off of the aggregate
• Aggregate spread rate determines the inter-aggregate void space in the seal layer, and hence the amount of binder required.
• A single layer of aggregate particles settle with typically 40-60% voids after orientation and packing.
• Binder rise should be a minimum of about 35-40% up the height of the aggregate particles after initial rolling and increase to 50-65% about two (2) years after construction
• Aggregate particles may embed into the base
• Reseals interlock with the existing surface
• Binder may be absorbed into the base
• The proportion of voids to be filled with binder may be varied to optimise requirements.
• All application rates determined by this method are expressed in L/m2 of residual binder at the standard reference temperature of 15oC.
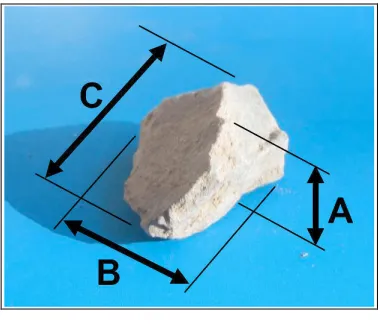
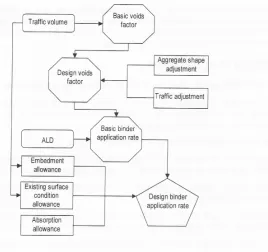
[image:27.612.172.440.184.436.2]The general schematic of the process for determining the binder application for a single/single seal is below.
Figure 2-2 Seal design process schematic Source: Austroads 2009, Section 5, Page 13
Holtrop (2007) has raised some issues with the design method, that are:
• Concerns about the quality of some naturally accruing granular base materials not being able to carry large vehicles without deformation, or seals flushing early in life. The seal design alone can not be expected to compensate for this.
• Concerns with the standard of preparation and timing of maintenance of existing pavement prior to resealing. Complaints are received about seals flushing, but inspections reveal the flushing mainly occurs over fresh maintenance patches.
2.5 Performance
2.5.1 Seal life
In most countries a sprayed seal is regarded as a maintenance treatment with a service life of less than five years. In Australia and New Zealand sprayed seals have had considerable development, resulting in a seal life of approximately 10 years or more under reasonable heavy traffic.
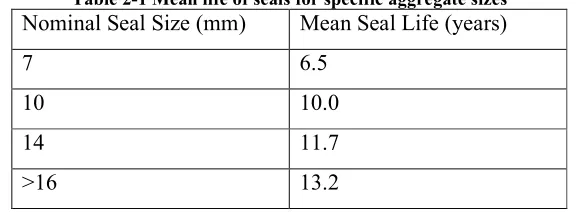
[image:28.612.161.451.412.518.2]Oliver (1999) developed a national questionnaire on seal performance including a question on seal life. The mean lives report by Australian road authorities are given below.
Table 2-1 Mean life of seals for specific aggregate sizes
Nominal Seal Size (mm) Mean Seal Life (years)
7 6.5
10 10.0
14 11.7
>16 13.2
Figure 2-3 Survey of mean seal life in Australia and New Zealand Source: ARRB Transport Research Report ARR326
The seal lives reported by the local governments are greater than that of the State road authorities. Such a difference in life expectancy may be due to a variety of factors including reduced traffic loads or a greater tolerance of defects on the local government’s roads.
2.6 Performance criteria
AAPA (2009) stated, a sprayed seal correctly designed and constructed on a sound pavement, is mainly influenced by the following factors with regards to life expectancy.
• Size and quality of aggregate
• Durability of bituminous binder
• Design of binder application rates
• Climatic conditions
• Traffic volume and composition
In terms of performance criteria it is usual to describe performance measured against failure criteria.
Seal performance criteria have been defined as ‘avoidance of certain failure parameters’ (Robertson et al, c.1990) Milne et al. 2005, p3) and according to Milne et al. (2005), these failures being:
• Permanent deformation (punching, rotation of seal stone reducing voids)
• Early rutting of the supporting base
• Fatigue cracking
• Low temperature cracking
• Moisture damage
• Adhesion failure
Empirical research by Milne et al. (2005) has demonstrated that the life of a seal is dependant on the following performance of the base regarding:
• Permanent base deformation: punching (associated with flushing) and rutting
And dependant on the seal material behavioural components for:
• Permanent deformation or loss of texture: rotation of seal stone, reducing voids, failure of ‘mat’ behaviour allowing punching
• Fatigue cracking
• Low temperature cracking
• Adhesion failure (stripping)
• Aggregate crushing or polishing
Therefore failure parameters applicable to the road surfacing seal will be:
• Deformation and texture loss: rotation and punching of the seal stone
• Cracking: fatigue (ageing of binder and loss of elasticity)
• Low temperature brittleness
• Loss of adhesion (of stone to bitumen, and bitumen to base)
• Aggregate (crushing or polishing)
The majority of these parameters are influenced heavily by the condition of the bitumen and is emphasized by Oliver (1990, p1) ‘The life of sprayed seals is critically dependant on the hardening rate of the binder’.
In addition to the above, Austroads (2003b) has established the following parameters that require assessment for the monitoring of the performance of road surfacings.
• Pavement surface shape
• Skid resistance
• Surface texture
• Noise
• Rutting and shape loss
• Conspicuity of markings
• Appearance
Many of these failure parameters are inter-related; consider skid resistance and surface texture. A study by Roe and Hartshore (1998) (Sicoe, 2005) showed that surfacings with low levels of texture depth show clear trends to yield lower levels of surface friction.
2.7 Performance models
2.7.1 New Zealand performance specification
New Zealand engineers have developed a deterioration model that they use as a performance specification to quantitatively evaluate sprayed seal performance during its first year of design life. The specification can be referenced in appendix B.
Transit New Zealand (TNZ) use the performance specification TNZ P17 to evaluate new sprayed seals over their first 12 months. The philosophy behind the P/17 specification is that the texture depth after 12 months of service is the most accurate indication of the performance of a sprayed seal for its remaining life. The New Zealand specification also states that, ‘the design life of a chip seal is reached when the texture depth drops below 0.9 mm on the road surface area supporting speeds greater than 70 km/h’ (TNZ P17). The specification is founded on the assumption that long-term chip seal service life is determined by the consequence of texture loss due to flushing. The specification relies on two (2) models; the seal design life model and the texture depth deterioration model.
The Seal design life model shows a relationship between design life, ALD and traffic loading in equivalent light vehicles. The model used by the TNZ P17 specification is,
Where Yd = design life of the seal
The texture depth deterioration model shows the relationship between the texture depth, ALD and the total traffic loading to date in equivalent light vehicles. The model is given by,
TD = k – B ALD log (T)
Where TD = texture depth of seal
k = constant dependant on ALD and bitumen spray rate
B = factor describing the rate of change in texture depth with traffic loading. -0.07 has been adopted by TNZ.
T = total traffic loading to date in elv
The seal design life as determined through the seal design life model is used in the texture depth deterioration model to produce the relationship between the texture depth at one year and the seal performance. The relationship is given by,
TD1 = 0.07 ALD log Yd + 0.9
Where TD1 = Texture depth measured one (1) year after construction
Yd = design life as determined by the seal design life model
0.9 = suggested texture depth at the end of the design life
Gransberg (2007) used the New Zealand performance specification to evaluate U.S. chip seal performance. The specification was adapted and used successfully to predict premature failure of the chip seals in the U.S.
2.7.2 Austroads Reseal intervention model
Austroads has developed a reseal intervention model consisting of two parts:
• The first part determines the increase in bitumen viscosity with time based on the temperature and durability of the bitumen used
• The second part estimates the viscosity at which distress will occur based on the mean temperature. Austroads (2005b) found this model was less reliable than the bitumen hardening model and more data is required to improve its accuracy.
The Bitumen hardening model is a simple mathematical model that has been developed to describe the rate at which bitumen will harden. To calculate the bitumen hardening rate at a site, the following data is required:
• Yearly average of the daily maximum air temperature
• Yearly average of the daily minimum air temperature
• The ARRB durability test results for the bitumen
The distress viscosity model is a function of the yearly average of the daily minimum air temperature.
Austroads project AS1061 further developed the reseal intervention model by including a seal size term in the bitumen hardening model. Additionally, another aim of the project was to develop a spreadsheet tool to assist users of the model.
Figure 2-4 Precision of the Austroads model Source: Austroads Research Report: AP-R271/05, page 19
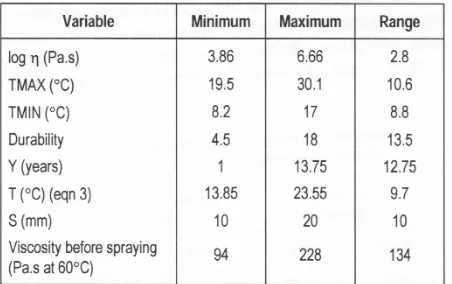
Table 2-2 Austroads model Variable Range Source: Austroads Research Report: AP-R271/05, page 20
Figure 2-4 shows the correlation between the actual bitumen viscosity and the viscosity predicted by the Austroads model. Table 2-2 lists the range of each variable for which the Austroads model will be accurate. Regions and roads of properties that fall outside of the range are outside the scope of the model.
2.8 Flushing
Flushing is perhaps, the most important distress mechanism since it has major safety implications and can necessitate intervention long before the expected life of a seal is reached. A reduction of skid resistance, often substantial, is likely to result with flushing.
Flushing is defined by Austroads as a pavement surface defect in which the binder nears the uppermost surface of aggregate particles and minimal surface texture (texture depth) exists. Bleeding is considered a more severe case of flushing, where the binder covers the aggregate particles completely.
A study performed by Gransberg (2007) on US chip seals found that the most common short term failure mode was loss of aggregate and the most common long-term failure mode was flushing. According to Gransberg (2005), the major reported long-term distress that appears in the American chip sealed roads is flushing.
There is some anecdotal evidence that there has been an increase in the number of bleeding seals observed around Australia in recent years.
2.8.1 Possible mechanisms
Austroads (2008b) gives three possible reasons as to why a seal becomes flushed are:
• Embedment of the sealing aggregate into the underlying substrate
• The aggregates in the seal, pack more tightly together than is assumed in the design process
Embedment
The aggregate punches into the layer below, equivalent to reducing the ALD of the aggregate. Consider aggregate with an ALD of 7mm subject to embedment of 2mm, which results in a reduction of aggregate height of approximately 30%. The seal is designed so that the binder would be 2/3 the height of the ALD and would in fact have binder close to the surface of the aggregate after embedment.
It is less easy to conceive embedment would occur in the case of reseals since the layer underneath is constructed of aggregate held in place by a supposedly harden bitumen film. However, some circumstances may result in the softening of the bitumen, including
• Cutter or binder diffusing into the existing bitumen
• Application of a reseal on an existing seal where the binder had not hardened to the ‘normal’ reseal level.
• Where there is extensive patching
The last point is supported by a study of U.S. chip seals by Gransberg (2007) that found placing a new chip seal over a relatively new seal appeared to exacerbate a poor surface condition rather than fix it.
Tighter packing of the surface aggregate
The Austroads seal design method assumes the aggregate rotates during construction rolling and early trafficking so that the least dimension is vertical. The method is verified by reference to on-road behaviour of seals. In general, the air void volume of the surface aggregate is approximately 25% greater than if every particle was packed closely and lay with its least dimension vertical.
The action of very heavy vehicles may result in the further rearrangement of aggregate resulting in a further reduction of air voids.
Factors that may exacerbate the process include:
• Overspreading of the aggregate
• Crushing of aggregate particles
• Attrition (grinding) of particles to remove asperities
Aggregate wear
Many tests are available to assess the wearing characteristics of aggregate. The application of these tests ensures that sealing aggregates are wear resistant, however, in some regions good quality aggregate is unavailable. The study by Austroads (2008a) showed disintegration of the aggregate resulted in many small particles in the seal that effectively reduced the ALD and displaced the binder.
2.8.2 Surface texture
Surface texture refers to the macrotexture of the pavement surface. Flushing of a seal will alter its surface texture, effectively reducing the texture depth as the flushing severity increases.
volumetric technique for measuring the texture depth of a pavement’s surface. The test method is specified by Austroads in AG:PT/T250.
According to Holtrop (n.d.), requests have been received to develop an alternative to the sand patch method of measuring surface texture, as a result of increased concern for the safety of the tester. A vehicle mounted laser profiler is recommended where operator safety and traffic delays are a concern. A report by Austroads (2008b) has found a correlation between the Mean Profile Depth (MPD) of the laser profiler and the Sand Patch Texture Depth (SPTD). The relationship is
SPTD = 2.5 MPD
At present, a method does not exist that can completely replace the current sand patch test in the seal design practice.
2.9 Evaluation systems
The rating system currently used in Australia is based on visual inspection and assessment using a standard rating for various criteria. The system is subjective and relies on the experience and skill of the observer. Given the nature of the rating it should be a fairly broad, simple, evaluation scale. AAPA (2009) states that a good indication of binder condition and performance of existing seals are provided by considering the following criteria:
• Loss of aggregate
• Amount and severity of cracking
• Amount of maintenance patching
• Binder level up the aggregate particles
• Texture of surface
Rating systems of different complexity have been examined in the past few years. However using a simple rating scheme allows quick decision to be made regarding reseal prioritisation. To give an indication of future funding requirements, a rolling re-seal program could be established.
2.10 Summary
Sprayed sealing works encompass many varying functions, all of which require thorough guidelines and design protocols to ensure the anticipated life is reached. Some sprayed seal applications are considered delicate and have a short design life. Other seals are more robust and are designed for a longer working life with more adverse conditions applied. This project will only consider seals coats, as these are subject to more defects considering the loading and long design life.
Many assumptions are made in the design of the coat seals. Such assumptions need to be made considering all conditions across Australia. In some regions, this leads to seals designed for conditions that are outside those assumed in the design guide.
The New Zealand performance specification requires the condition of the seal some time after its construction to predict the performance (life) of that seal. The New Zealand specification considers a seal to reach the end of its working life when the seal is at a certain texture depth. This model has an advantage over the Australian model as it uses ‘real’ results early in the life of the seal to predict its remaining life.
Currently seal performance is evaluated by visual inspection. Such an evaluation system is subjective and very much dependant on the individual performing the inspection.
3
Methodology
3.1 Introduction
This project methodology will give an overview of the procedure employed to satisfactorily complete the research project in accordance with the project specification. The New Zealand TNZ P17 performance specification was selected to model the deterioration of sprayed seals in the Far North Queensland Region. The validity of the TNZ model must be checked prior to the application of the model to the road network. The validation of the models required the selection of seal property to be monitored, the collection of data for the selected study area and the analysis of the data.
3.2 Background information
The first phase of this project involved researching information pertaining to existing seal evaluation systems, seal defects and associated mechanisms and seal performance criteria. The information was sourced from university libraries, Main Roads’ library, electronic databases and internet sources. The information pertaining to this project is found in the literature review chapter.
3.3 Seal properties
The selection of the seal properties to be assessed was based on the following factors:
• The associated failure of the seal property
• The effect the failure will have on the safety of the road users
• The effect the failure has on the life of the seal
• Mode of quantifying the seal property failure
The above factors ensure that the seal property that was selected had a significant effect on safety and seal life. It was also important to select a seal property that was easily measurable and where data was readily available.
The texture depth was considered as the seal property to be assessed. The failure of this property is a reduction in texture depth to a level where the road surfacing is not safe. This failure is referred to as flushing and has great implications for road safety. Flushing is also the most common long-term failure in seals; therefore a premature occurrence would affect the seal life. There is anecdotal evidence that there is an increase of occurrences of flushed seals. Texture depth is easily and commonly measured; it is a key parameter for seal design, and yearly measurements are collated in the Main Roads ARMIS database. The New Zealand performance model (TNZ P17:2002) is reliant on the texture depth to predict the performance of a reseal. Based on these considerations texture depth was chosen to be assessed for this research project.
3.4 Study area selection
Of these seven roads, only reseals were considered. This would further reduced the number of variables, as it may be conceived that the existing seal is impermeable and embedment may not contribute to a change in texture depth, provided the reseal was applied at or near the end of the seal design life. The roads selected for study have traffic volumes varying from 49091 to 261 AADT.
3.4.1 Bruce Highway 10N and 10P
The Bruce Highway is a national highway and is the major connection between the Queensland state capital, Brisbane, and Cairns in the Far North region. The Highway is approximately 1700Km long of which 234km is the responsibility of the Far North Region. Of all roads in the region, the Bruce Highway is subject to the greatest traffic loading. The majority of the highway within the region traverses flat coastal terrain, with the exception of the Cardwell range between Ingham and Innisfail, and sections of undulating terrain.
3.4.2 Captain Cook Highway 20A
The Captain Cook Highway is a coastal road connecting Cairns and Mossman. The road is approximately 75km long with similar traffic volumes to the Bruce Highway.
3.4.3 Palmerston Highway 21A
3.4.4 Kennedy Highway 32A and 32B
The Kennedy Highway stretches from the Captain Cook Highway to the Palmerston Highway near Ravenshoe, in the Atherton Tablelands. Approximately 12km on the 32A section of Kennedy Highway is constructed on mountainous terrain.
3.4.5 Gulf Developmental Road 92B
[image:45.612.127.478.300.619.2]The Gulf Developmental Road is an inland road with small traffic loadings. In contrast with the other roads selected for study, the Gulf Developmental Road has only had bitumen sprayed seals applied as a surfacing treatment.
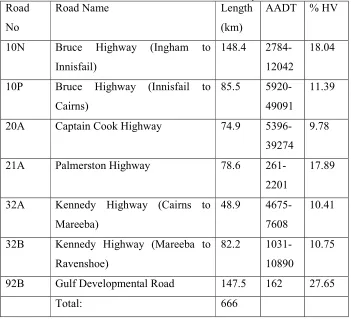
Table3-1 State controlled roads in the study area
Road No
Road Name Length
(km)
AADT % HV
10N Bruce Highway (Ingham to Innisfail)
148.4 2784-12042
18.04
10P Bruce Highway (Innisfail to Cairns)
85.5 5920-49091
11.39
20A Captain Cook Highway 74.9 5396-39274
9.78
21A Palmerston Highway 78.6
261-2201
17.89
32A Kennedy Highway (Cairns to Mareeba)
48.9 4675-7608
10.41
32B Kennedy Highway (Mareeba to Ravenshoe)
82.2 1031-10890
10.75
92B Gulf Developmental Road 147.5 162 27.65
3.5 Data collection
The ARMIS database is the greatest sources of seal data available for the region. The data was exported from ARMIS as an excel spreadsheet. For each road, two (2) data sets were required.
The first dataset (layer data) contained the age of each layer in the road including the pavement material. A spreadsheet for each road was constructed. For each layer on each section of road the following relevant data was outputted directly from ARMIS:
• Chainage – start and finish for the section of road
• Layer number – with 1 being the top layer
• Layer depth – for seal and reseals this corresponded to the nominal aggregate size used
• Layer date – the date the layer was constructed
• Layer type name – describe the layer type. i.e. bitumen sprayed seal
• AADT – added manually
• Percentage of heavy vehicles – added manually
• Number of lanes – added manually
Other data was outputted from ARMIS, such as Main Roads region number, but this did not contribute to the project. The data was sorted by road section and then by layer number. This data set contained over 11,000 data points for the seven (7) roads.
3.6 Data Manipulation
3.61 Layer Dataset
This dataset was used to find the mean seal life for each nominal seal size for the seven roads selected. The data points of relevance were those only relating to bitumen sprayed seals.
A Matlab program (sealage.m) was developed to sort and collate all the relevant data from the dataset, refer to Appendix Cfor program code script. The program imported all the data from layer dataset, which consisted of seven spreadsheets. The layer data for each section of road corresponded to only bitumen spray seals was extracted from the dataset. Each corresponding layer was compared to the next layer for the same section of road to calculate the seal age. The age of the seal was determined by subtracting the layer date from the proceeding layer date. The vehicles per lane per day (v/l/d) were determined by dividing the AADT by the number of lanes, assuming all lanes were equally trafficked. AADT at the time of completion of the seal was determined by assuming a constant growth in traffic volumes of 2.5% per annum. This procedure was repeated for all of the selected roads.
The first output of the program was an excel spreadsheet (SealAge.xls) containing the following data for only bitumen spray seals:
• Seal age
• Nominal seal size
• Adjusted AADT
• v/l/d
• Percent of heavy vehicles Further data was extrapolated, such as:
• Equivalent light vehicles
The data was sorted by nominal seal size and then by seal age.
The second output was an excel spreadsheet (SealPos.xls) containing the following data:
• Road code
• Chainages
• Construction date
This data is used in conjunction with texture depth dataset to monitor the change in yearly texture depth. The output was restricted to seals constructed after the 1st January 2000, as ARMIS did not contain texture depth data prior to 2001.
3.6.2 Texture Depth Dataset
The sensor measured texture depth was converted to the sand patch texture depth value by the following relationship.
SPTD=2.5(MPD)
The texture depth dataset was further manipulated to compare the change in texture depth predicted by the TNZ P17 deterioration model. The predicted texture depth was calculated from the data in SealTD dataset. The MATLAB program (tdrdeg.m) imported the data from SealTD.xls and plotted the average measured texture depth and TNZ P17 predicted texture depth against the age of the seal.
3.7 Validation of Deterioration Model
The validity of the TNZ P17 deterioration model for the Far North region was check by comparing the predicted life and actual life of a seal, as determined from the manipulation of the Layer dataset 1. A graph for each nominal seal size showing the correlation was generated.
The model was further tested by comparing the deterioration of texture depth of a seal over the period of 2001 to 2007 with that predicted by the model.
3.8 Development of the Far North Region Seal Life
Model
The seal life model would be manipulated to reflect the seal behaviour in the Far North Region. The TNZ P17 performance specification uses the following relationship between traffic loading (elv), sealing aggregate (ALD) and seal life (Yd).
Yd = 4.916 + 1.68ALD – (1.03 + 0.219ALD) log elv
Where the term
4.916 + 1.68ALD;
Similarly the term
1.03 +0.219ALD;
represents the effect the aggregate has on the rate of deterioration and will be referred to as the aggregate-deterioration term. These two (2) terms are adjusted so that the deterioration model reflects the seal behaviour in the Far North Region.
Using the real data from seal age dataset, a logarithmic trend is fitted to the plot of seal life versus log elv for each aggregate ALD. This graph is used to calculate the aggregate-life and aggregate-deterioration terms for the region. The ALD of the aggregate is not readily available and is therefore assumed to be 60% of the nominal aggregate size. The reduction factor is that used by sprayed seal designers in the Far North Region for preliminary seal designs where the aggregate properties are not known.
The aggregate-life term is calculated by firstly, extrapolating the seal life for each ALD value when elv is 1; then by plotting the seal life against ALD and determining the relationship.
4
Results & Analysis
4.1 Introduction
The TNZ P17 deterioration model was selected to assess the performance of sprayed seals in the Far North Region. The successful application of this model requires the validation as assessed against actual seal behaviour.
4.2 Validation of Model
4.2.1 Seal Life
For each nominal aggregate size, the ages of the sprayed seals (Blue) were plotted against a logarithmic scale of Vehicle/Lane/Day (in equivalent light vehicles). A line was fitted (Black) and compared to The TNZ seal life prediction (Pink). The equation for the line of best fit is located in the top right corner of the graph. The region seal life predication (Yellow) has been retrofitted to the graph. Refer to graphs 4-1 to 4-4.
The wide and seemingly random range of seal ages may be due to a number of factors. Low seal age may be due to primer seals incorrectly identified as seals, incorrect input of chainages and premature failure of the seal. Primer seals have a design life of approximately two (2) years and the incorrect identification as a seal would yield a low seal age. The incorrect input of chainages for a new reseal may reduce the recorded seal life of adjacent seals. Consider a seal constructed three (3) years prior to a reseal on an adjacent section of road. The chainage of the new reseal is recorded such that it was applied to the adjacent section of road. The adjacent seal is recorded as having a seal life of three (3) years, when in fact the seal layer will continue to age. This problem would also conversely effect the seal age of the section of the road where the reseal is applied, resulting in a seal age greater than it should be. The omission of new seals in ARMIS would also result in high seal age data.
Regardless of the inconclusive correlation between the regional seal age and TNZ seal life prediction, the region data and trends will be used for further analysis and manipulate the deterioration model.
7mm Seal Age
7mm Seal Life
y = -5.1285log(elv) + 24.512
[image:53.612.132.479.455.671.2]There is less seal age data available for 7mm seals than the other sizes. The range of 7mm data is between 1600 and 7400 with an even distribution of data points. The trend line fitted to the data shows a greater rate of seal life deterioration than the TNZ prediction. Over the range of data the trend, region model and TNZ model all predict a similar seal life of approximately eight (8) years at 1600 v/l/d. There is some divergence between the three lines at the upper limit of the range, with the TNZ model, region model and data trend predicting seal lives of 7.6, 5.5 and 4.7 years at 7400 v/l/d, respectively. The 7mm trend line is defined by the following equation, y = -5.1285 log(elv) + 24.512.
Over the range of data, the region model shows some similarities to the trend.
10mm Seal Age
10mm Seal Life
y = -1.4447log(elv) + 12.324
0 2 4 6 8 10 12 14 16 18 20
100 1000 10000
[image:54.612.132.480.336.552.2]Vehicle/Lane/Day (elv) S e a l L if e ( y e a rs ) Region Data TNZ P17 Region Model Region Trend
The majority of reseals in the Far North region are 10mm seals. The seal age data available for the 10mm seal is across a wide range of traffic loading, from 200 to 13500 v\l\d. The data is concentrated in two sections, around 250 v/l/d and 3000-9000 v/l/d. The data grouping around 250 v/l/d are seals on the Gulf Developmental Road. The trend line fitted to the 10mm seal age data is approximately four (4) years below the TNZ prediction and follows similar seal deterioration. The 10mm trend line is defined by the following equation,
y = -1.4447 log(elv) + 12.324.
The region model predicts greater seal life deterioration than that of the region trend and TNZ model.
14mm Seal Age
14mm Seal Life
y = -7.7234log(elv) + 36.914
[image:55.612.132.480.317.533.2]0 5 10 15 20 25 1000 10000 Vehicles/Lane/Day (elv) S e a l L if e ( y e a rs ) Region Data TNZ P17 Region Model Region Trend
Figure 4-3 14mm seal age in far north region
16mm Seal Age
16mm Seal Life
y = -7.6548log(elv) + 34.707
[image:56.612.131.480.81.302.2]0 5 10 15 20 25 30 35 1000 10000 Vehicles/Lane/Day (elv) S e a l L if e ( y e a rs ) Region Data TNZ P17 Region Model Region Trend
Figure 4-4 16mm seal age in far north region
The greatest range of seal age data exists for the 16mm seal, from 250 to 13700 v\l\d. The region trend line fitted to the seal age data and the region model, predict a greater seal life deterioration than the TNZ model. The 16mm trend line is defined by the following equation,
y = -7.6548 log(elv) + 34.707.
4.2.2 Texture depth deterioration
The TNZ P17 specification states the relationship,
TD = k -0.07 ALD log (T),
which represents the deterioration of texture depth over the life of the seal. The specification also states that the seal is at the end of its life when the texture depth reaches 0.9mm. This condition gives:
where T is the traffic loading and is represented by:
T = (elv 365 Y)
The traffic loading is the number of equivalent light vehicles travelling on the seal for a period of Y years. When the texture depth is 0.9 mm the Y variable is the seal design life calculated by the seal life model and is represented by Yd. The combination of these equations yields:
TDY = 0.07 ALD log (Yd/Y) + 0.9.
This equation is used to predict the texture depth of a seal at any point in its design life and will be used to compare the actual and predicted texture depths. Notice the constant, k, has been cancelled out and therefore it is not necessary to specify its value.
[image:57.612.134.481.476.688.2]The measured texture depth in figure 4-5 does not follow the TNZ prediction, with a significant increase in texture depth recorded 2.6 years into the life of the seal. To better understand the anomaly the yearly texture depths over the section of road must be analysed. Figure 4-6 shows the yearly texture depths in the outer wheel paths over the section of road.
Figure 4-6 Yearly texture depth of a 10mm seal on 21A in Far North Region
The inaccurate texture depth results may be due to the nature of measurement employed. The texture depths are sensor measured and averaged over a 100m section of road along the outer wheel path, inner wheel path and between the wheel paths. The sensor is mobile and it is possible that over the 100m section the following factors may have affected the average texture depth:
• Pot hole patching – surface of different texture depth
• The sensor measuring adjacent sections along the width of the road
• Bleeding or stripping - significant variation of texture depth over the 100m section of road
The texture depth data does not accurately represent what is actually happening to the seal and cannot be used to validate the TNZ texture depth model.
4.3 Far North Region Seal Life Model
The TNZ P17 deterioration model accurately predicts the seal life of New Zealand Roads as a function of traffic loading and the ALD of the aggregate. A model must be developed for the Far North region that will represent the seal behaviour in the region.
[image:59.612.128.485.577.682.2]The seal life model for the Far North Region is able to be developed using the seal age analysis from each seal size. The results from the regional seal age analysis yielded the following trend equations in the form of y = mx+c.
Table 4-2 Seal age analysis as a function of traffic loading
The last term (c) in each equation represents the maximum design life of a seal of a given size. In the context of the model, the term represents the seal life if the road is subject to one equivalent light vehicle over the life of the seal. These values are used to determine the aggregate-life term in the Far North Region Seal life model. The values are plotted against the corresponding ALD to produce figure 4-7. The relationship as a function of ALD produced the aggregate-life term for the Far North Region model. The aggregate-life term for the region model is
3.1645 ALD + 4.8044
And represents the effect the ALD of the aggregate has on the seal life.
Aggregate-Life Term
y = 3.1645ALD + 4.8044
0 5 10 15 20 25 30 35 40
4 5 6 7 8 9 10
[image:60.612.134.479.302.515.2]ALD (mm) L if e f o r e lv = 1 ( y e a rs ) Region Data Agg-Life Term
Figure 4-7 Maximum seal life as a function of ALD
The aggregate-deterioration term for the region model is
0.7871 ALD - 0.061
And represents the effect the ALD of the aggregate has on the seal life.
Aggregate-Deterioration Term
y = 0.7871ALD - 0.061
0 1 2 3 4 5 6 7 8 9
0 2 4 6 8 10 12
[image:61.612.133.480.165.380.2]ALD (mm) R a te o f D e te ri o ra ti o n ( y e a rs /l o g (e lv )) Region Data Agg-Det Term
Figure 4-8 Rate of deterioration of seal life as a function of ALD
The combination of the aggregate-life term and the aggregate-deterioration term produces the seal life model. The Far North Region Seal Life model is defined by
Yd = 3.1645 ALD + 4.8044 - (0.7871 ALD - 0.061) Log(elv)
Figure 4-9 graphically represents the behaviour of sprayed seals in the Far North region predicted by the seal life model. The graph shows a convergence of seal life near 10,000 v/l/d towards five (5) years. This would indicate that all seals regardless of aggregate ALD with have the same life on a road subject to 10,000 v/l/d (elv).
Region Model Seal Life Prediction 0 5 10 15 20 25 30
10 100 1000 10000
[image:62.612.132.479.66.281.2]Vehicles/Lane/Day (elv) S e a l L if e ( Y e a rs ) 7mm 10mm 14mm 16mm
[image:62.612.134.479.415.626.2]Figure 4-9 Far North Region seal life prediction
Figure 4-10graphically represents the TNZ model. In comparison to the Far North region model it can be seen that the Region model predicts longer seal lives for small traffic loading, and a greater deterioration than that predicted by the TNZ model.
TNZ Model Seal Life Prediction
0 5 10 15 20 25 30
10 100 1000 10000
Vehicles/Lane/Day (elv) S e a l L if e ( y e a rs ) 7mm 10mm 14mm 16mm
5
Conclusion
The Department of Transport and Main Roads, Queensland, recognises that the assessment, prediction and monitoring of seal performance are vital for delivering continually high standard sprayed seals on the state roads. Anecdotal evidence suggests that more sprayed seals are failing prematurely due to flushing.
Premature flushing of seals is a global problem. Flushing is characterised by excess bitumen on the surface of roads, where the binder nears the uppermost surface of the aggregate particles. Bitumen is a crude oil based product and there are concerns for its future availability. Therefore, every attempt should be made to ensure that sprayed seals are reaching the design life. Most importantly, flushing has major safety implications. Poor skid resistance, inconspicuity of road markings and the propensity to aquaplane are among the most detrimental products of flushing. There is therefore an increased propensity for road crashes on roads with flushed seals.
The TNZ P17 performance based specification for reseals is viable tool for the assessment, prediction and monitoring of seal performance with respect to flushing. The design life and the texture depth deterioration models are detailed in the specification. The specification has already had success being implemented in New Zealand and America. The implementation of this specification ensures that the seal construction contractors are accountable for premature failure of sprayed seals. As a result, the process has lead to innovation in the delivery of sprayed seal.
The seal age data collected for the Far North region did not show any clear trends and any correlation with the Far North region design life model could only be considered coincidental. The Far North region design life model requires more extensive and refined data to better develop the model.
The validation of the texture depth deterioration model was futile as the available texture depth data was inconsistent and inaccurate. As a result, the means by which the yearly texture depth data is collected requires review.
5.1 Project Benefits
The seal design life model developed for the Far North region is the first step required to adopt the TNZ P17 performance specification. It is suspected that the Far North region seal design life model does not represent the seal behaviour in the region. However, with more refined seal age data the model will be able to be refined and the TNZ P17 performance specification applied to the region. The employment of the performance specification is expected to have the same success as it has had in New Zealand and America.
The process used to develop the seal design life model detailed by this project can be easily applied in any region of the world.
5.2 Future works
The Far North region design life model requires more exact data, to further develop the model. A testing program needs to be developed to collect texture depth data over the life of seals. The TNZ P17 specification predicts the performance of the seal, based on the sand patch texture depth performed after 12 months from construction. The predictions based on the data from the 12 month sand patch texture depths collected are inconclusive for the Far North region. Data over the entire life of a seal is required to check the validity of the TNZ P17 texture depth deterioration model.
Figure


Related documents
