“Tackling severe family
disadvantage in
Scotland means
looking at more than
just poverty…”
A WIDER LENS
Louise Bazalgette
Matt Barnes
Chris Lord
Until now, policy makers interested in tackling disadvantagehave mainly relied on income poverty as their key measure. This approach, enshrined in the Child Poverty Act 2010, focuses mainly on income poverty, to the exclusion of other disadvantages like poor housing, worklessness and ill health. Recently, this income-based approach has come under growing criticism – in particular from the Field Review on Poverty and Life Chances – which instead advocated multidimensional measures, which provide a fuller picture of disadvantage.
This report is the first large-scale analysis of Scottish families’ experiences of multiple disadvantage. Using data from the Scottish Household survey, it provides new analysis to help us understand the scale and nature of disadvantage affecting families in Scotland. This analysis has two key benefits beyond that of providing a more accurate picture. First, it is more easily understood by the public, while complex income-based measures are not. And second, it can contribute to better informed policy from both central and local government by identifying a variety of factors contributing to disadvantage.
A Wider Lens is the first phase of a research project on family disadvantage in Scotland. The next stage will use in-depth qualitative research techniques (including focus groups, diary-prompted interviews and ethnographic visits to families’ homes) to develop detailed knowledge of the challenges experienced by families suffering from multiple disadvantages, and to develop policy solutions to help overcome them.
Louise Bazalgette is a Senior Researcher on the Family and Society programme at Demos. Matt Barnes is a dedicated Analyst at NatCen. Chris Lord is a Research Analyst in the Income and Work team at NatCen.
A Wider Lens
|
Louise Bazalgette · Matt Barnes · Chris Lor
d
traditional, ‘ivory tower’ model of policy making by giving a voice to people and communities. We work together with the groups and individuals who are the focus of our research, including them in citizens’ juries, deliberative workshops, focus groups and ethnographic research. Through our high quality and socially responsible research, Demos has established itself as the leading independent think-tank in British politics.
In 2012, our work is focused on four programmes: Family and Society; Public Services and Welfare; Violence and Extremism; and Citizens. Alongside and connected with our research programes, Demos has political projects focused on the burning issues in current political thinking, including the Progressive Conservatism Project, the Centre for London at Demos and Demos Collections, bringing together topical essays by leading thinkers and commentators.
Magdalen House, 136 Tooley Street, London, SE1 2TU, UK
ISBN 978 1 909037 23 6 Series design by modernactivity Typeset by Chat Noir Design, Charente Printed by Lecturis, Eindhoven
Set in Gotham Rounded and Baskerville 10
As the publisher of this work, Demos wants to encourage the circulation of our work as widely as possible while retaining the copyright. We therefore have an open access policy which enables anyone to access our content online without charge.
Anyone can download, save, perform or distribute this work in any format, including translation, without written permission. This is subject to the terms of the Demos licence found at the back of this publication. Its main conditions are:
· Demos and the author(s) are credited
· This summary and the address www.demos.co.ukare displayed · The text is not altered and is used in full
· The work is not resold
· A copy of the work or link to its use online is sent to Demos
Acknowledgements 7
Executive summary
91
Types of disadvantage affecting families
in Scotland
172
Quantifying experiences of multiple
disadvantage among families in Scotland
393
Current policy responses to tackling
disadvantage affecting families in Scotland
57Appendices
67Notes 75
Acknowledgements
We are very grateful to Quarriers for making this research possible, and in particular to Nicolas White for his
enthusiasm and support throughout the first phase of research. We look forward to working together on the next stage of this research project.
We would also like to thank Matt Barnes and Chris Lord at NatCen for conducting the exciting new analysis of the Scottish Households Survey that is presented in this report. We are very grateful to the Scottish Government for giving NatCen access to the data used in this project, which are not yet available in the public domain.
At Demos we would like to thank Alexandra Paget and Andrew Rhodes for their excellent research support. We would also like to thank Ralph Scott and Rob Macpherson for their expert work on the publication and launch of this report.
All errors or omissions remain our own.
Louise Bazalgette Demos
Executive summary
The purpose of this study is to develop new data to help us understand the scale and nature of disadvantage affecting families in Scotland. In previous decades policymakers have particularly focused on addressing income-based measures of family disadvantage that might compromise children’s outcomes, such as those enshrined in the Child Poverty Act 2010 (‘relative’ child poverty; ‘combined low income and material deprivation’, ‘absolute low income’ and ‘persistent poverty’). However, more recently a variety of prominent voices – most notably Frank Field’s in the report of the Independent Review on Poverty and Life Chances1– have criticised this predominantly income-based
approach to understanding disadvantage for reducing the many factors that can threaten children’s life chances to purely monetary considerations.
In recent years, researchers have increasingly sought to understand disadvantage from a multidimensional perspective by identifying households that suffer from a combination of disadvantages (such as poor housing, poor health, worklessness and so on as well as low income).2Such an approach has the
additional benefit that it can be understood more easily by the public, while complex income-based measures are often poorly understood.3Multidimensional measures of disadvantage can
also contribute to better informed policy responses at a national and local level by identifying a broader set of policy priorities and increasing understanding of how various types of dis-advantage can interact in people’s lives. Demos’s own multi-dimensional poverty study (forthcoming) is a key example of this approach.
new secondary analysis of a large-scale survey of Scottish
households to develop new knowledge of experiences of multiple disadvantage in Scotland. The key research questions are:
· How many households in Scotland experience multiple disadvantage?
· Does the prevalence of multiple disadvantage vary by local area?
· Which types of household are most at risk of multiple disadvantage?
In exploring ‘multiple disadvantage’, this report does not in any way seek to replicate the ‘troubled families’ policy agenda currently being pursued in England, which focuses on families ‘characterised by there being no adult in the family working, children not being in school and family members being involved in crime and anti-social behaviour’.4The estimates used to arrive
at the 120,000 ‘troubled families’ figure recently quoted by the Troubled Families team at the Department for Communities and Local Government (DCLG) used different datasets, different indicators of disadvantage, and different thresholds of the most disadvantaged households. Perhaps even more importantly, this study (like the Cabinet Office’s study, quoted by DCLG, which originally estimated that approximately 120,000 families in England have multiple problems5) does not include any
measures of crime or antisocial behaviour and seeks to identify a group of families that are at greater risk of poor outcomes, rather than families identified as posing a threat to the safety and cohesion of their wider community.
Methodology
The large size of this survey means that it is possible to look at multiple disadvantage within local areas, and also according to sub-groups of the population (eg families with children, working age adults without children and older people).
The seven indicators of disadvantage identified in this study are:
· low income · worklessness
· no educational qualifications · overcrowding
· ill health
· mental health problems · poor neighbourhood
Households are categorised according to the number of these types of disadvantage they experience:
· households with no disadvantages
· households with one to three disadvantages · households with four or more disadvantages6
The study then looks at the prevalence of each individual disadvantage indicator in each local authority and across Scotland as a whole, as well as the prevalence of multiple dis-advantage. It also compares the type and number of disadvan-tages experienced by the three population sub-groups
(families with children, working-age adults without children and older people).
A more detailed methodology can be found at the beginning of chapter 2.
Key research findings
Overall rates of disadvantage in Scotland according to population sub-group
· 20 per cent of families with children had low income (compared with 16 per cent of working age households without children and 17 per cent of pensioner households).
· 10 per cent of families with children were living in overcrowded accommodation (compared with 1 per cent of working age households without children and <0.5 per cent of pensioners). · 18 per cent of families with children had poor health (compared
with 24 per cent of working age households without children and 54 per cent of pensioner households).
· 4 per cent of families with children had poor mental health (compared with 5 per cent of working age households without children and 3 per cent of pensioner households).
· 15 per cent of families with children were workless (compared with 24 per cent of working age households without children). · 12 per cent of household representatives for families with
children had no qualifications (compared with 19 per cent of working age households without children and 47 per cent of pensioner households).
· 8 per cent of survey respondents for families with children rated their neighbourhood as ‘fairly poor’ or ‘very poor’ (compared with 7 per cent of working age households without children and 4 per cent of pensioner households).
Overall rates of multiple disadvantage in Scotland
These are the overall rates of multiple disadvantage in Scotland for each of the three sub-groups in this study:
· 4 per cent of families with children have four or more of the seven disadvantages identified in this study.
· 5 per cent of working-age households without children have four or more disadvantages.
Total numbers of multiply disadvantaged households in Scotland
In 2010 there were approximately 2.3 million households in Scotland. On the basis of these findings, we can make the following estimates:
· There are approximately 24,000 families with children in Scotland that are affected by four or more of the seven disadvantages identified in this study.
· There are approximately 55,000 working age households without children affected by four or more disadvantages.
· There are 52,000 pensioner households with four or more disadvantages.
Prevalence of multiple disadvantage by local area
This was the prevalence of multiple disadvantage across all three population subgroups by local area:
· Glasgow had the highest proportion of households with four or more disadvantages.
· North Lanarkshire also had higher than average rates of multiple disadvantage.
· Edinburgh had the highest proportion of households without any
disadvantages.
· Other areas with a high proportion of households without any
disadvantages were Highlands, Grampian and Central.
Within the population sub-group of families with children:
· Glasgow was again the most disadvantaged area, with one in ten (11 per cent) families with children in Glasgow experiencing four or more disadvantages.
Characteristics of households that are most at risk of multiple disadvantage
Looking across all three population sub-groups, certain characteristics were linked to multiple disadvantage, such as:
· single person households (including lone parents) and large households
· women (likely to be lone parents) · separated or divorced households · rented households.
These patterns generally hold within the sub-groups, although certain patterns stand out:
· Among working age households without children, those who live alone (without a partner) and are renting their accommodation appear most at risk of experiencing multiple disadvantage.
· Among pensioner households, those most at risk are the oldest old, women, widowed people and people who rent their accommodation.
Profiling of families with children that have four or more disadvantages demonstrates the following:
· Half (51 per cent) are lone parents, compared with 21 per cent among all families with children.
· Three-quarters (77 per cent) are living in social rented housing.
· Half (50 per cent) live in large urban areas.
Families with children that have low income, poor health and no educational qualifications
· Overall, 2 per cent of families with children had this combination of disadvantages (they may also have had additional disadvantages).
· Within local areas, the proportion of families with this set of disadvantages ranged from <0.5 per cent in Dunbartonshire to 3 per cent in Glasgow; 3 per cent of families with children in North Lanarkshire and South Lanarkshire also had this combination of disadvantages.
The structure of this report
Chapter 1 describes the broader social and economic context for this research project by outlining some of the facts and figures on how families with children in Scotland are currently experiencing various types of disadvantage, or risk of harm. Types of disadvantage explored include child poverty, poor housing and worklessness.
Chapter 2 presents NatCen’s new analysis of the Scottish Household Survey (2009/10) to provide a statistical portrait of Scottish families’ experiences of seven types of disadvantage (low income; worklessness; no educational qualifications; overcrowding; ill health; mental health problems; poor neighbourhood).
This analysis will provide new evidence of:
· the proportion of households in Scotland that experience multiple disadvantage
· the prevalence of multiple disadvantage according to local area · the types of household that are most at risk of multiple
disadvantage
The next phase of research
The purpose of this initial scoping study is to understand the scale and nature of disadvantage in Scotland, with a particular focus on families with children.
This study will be used to inform the next stage of Demos’s research project, which will use in-depth qualitative research techniques (including focus groups, diary-prompted interviews and ethnographic visits to families’ homes) to develop a detailed knowledge of the aspirations and challenges experienced by families suffering from multiple disadvantages. These are some of the key research questions for this next phase:
· What are the current limitations in support for families experiencing multiple disadvantage? Where are the gaps, tensions, and duplications of effort resulting from silo-based working or attempts to tackle problems in isolation from people’s families or wider communities?
· Which types of support and approaches do families themselves believe would help them the most?
· How might effective approaches to family support build on existing community and family supports and build families’ resilience?
· Which examples of good practice in family support can we learn from that are effective andcost effective in improving outcomes for families experiencing multiple disadvantage?
· What lessons can service providers and policymakers in Scotland and the UK draw from these new research findings?
1
Types of disadvantage
affecting families in
Scotland
This chapter will describe the broader social and economic context for this research project by outlining some of the facts and figures on how families with children in Scotland are currently experiencing various types of disadvantage, or risk of harm. The chapter is divided thematically into the following sections:
· low income and child poverty
· poor housing and area-based deprivation · educational disadvantage and worklessness · health inequalities
· alcohol consumption and drug use · child abuse and neglect
This overview will set out existing evidence on how a variety of types of disadvantage, such as poverty, area-based deprivation, poor health and worklessness, interact in families’ lives. This evidence will provide a descriptive context for the new analysis presented in chapter 2, which details the proportion of families that are currently experiencing ‘multiple disadvantage’ in Scotland.
Low income and child poverty
A large body of evidence demonstrates that children growing up in low-income households are at greater risk of poor outcomes across a variety of domains including health, emotional and behavioural problems, risky behaviours and educational attainment.8In response to this serious moral and social
for reducing child poverty in the Child Poverty Act 2010, to be met by April 2020:
· relative child poverty: less than 10 per cent of children to live in households that have a household income of less than 60 per cent of median household income
· combined low income and material deprivation: less than 5 per cent of children to live in households that have a household income of less than 70 per cent of median household income and
experience material deprivation
· absolute low income: less than 5 per cent of children to live in households that have a household income of less than 60 per cent of the median household income for 2010
· persistent poverty: to reduce the proportion of children who experience long periods of relative poverty (eg are in relative poverty for three consecutive years within a four-year period)9
To inform Scotland’s own strategy for reducing child poverty, the Scottish Government published evidence on current rates of child poverty in Scotland in November 2010.10This
demonstrated that with 21 per cent of Scottish children living in relative poverty in 2008/09, child poverty levels in Scotland are similar to the UK-wide level of 22 per cent. Although more than a fifth of Scotland’s children were living in relative poverty in 2008/09, this represents a decline in the poverty rate since 1998/99, when the figure stood at 28 per cent.11In 2008/09, 16
per cent of Scottish children were living in ‘combined low income and material deprivation’ (this proportion has remained roughly constant since 2004/05) and 11 per cent of children, or 110,000 children, were living in ‘absolute poverty’ (a reduction from 28 per cent in 1998/99). 13 per cent of children lived in persistent poverty between 2004 and 2007, a slight reduction from 15 per cent of children living persistently in poverty between 2001 and 2004.12
experiencing persistent poverty. For the purposes of this study, children were categorised as being ‘persistently poor’ if they were living in relative poverty during at least three out of four of the annual surveys carried out for Growing Up in Scotland. This study found that the family’s employment status had the largest impact on the child’s risk of persistently living in poverty, with families that were consistently out of work most at risk of persistent poverty.13Nearly all workless families in the survey
experienced poverty at some point, while approximately eight out of ten workless families experienced persistent poverty.14
Other risk factors included:
· Lone parent families: 73 per cent of birth-cohort children who lived in lone-parent families throughout the study period were
persistently poor, compared with only 12 per cent of children from stable couple families.
· Larger families: 37 per cent of birth cohort children who lived with two or more other children were persistently poor, compared with 21 per cent of solo children.
· Families with a young mother: 50 per cent of birth-cohort children whose mother was aged under 25 experienced persistent poverty. · Families with parents with low educational attainment: 49 per cent of
birth-cohort children whose mothers had low educational attainment experienced persistent poverty.
· Families living in rented housing (especially social housing): 59 per cent of birth-cohort children living in the social rented sector experienced persistent poverty.15
The study by the National Centre for Social Research also found that children from minority ethnic backgrounds were at greater risk of persistent poverty than white children, as were those children whose mother had a long-standing health problem or a disability.16
relative poverty, in comparison with 19 per cent of children (160,000) living with non-disabled adults. The same heightened risk of poverty applies to disabled children: 26 per cent of families that include a disabled child live in relative poverty, compared with 19 per cent of families with non-disabled children. This study suggests that ‘parental disability can be a barrier to labour market participation, preventing families with children from gaining sufficient resources from employment to escape poverty’.17
Poor housing and area-based deprivation
Poor housing
In 2004 Scotland’s Minister for Communities announced the new Scottish Housing Quality Standard (SHQS), with an agreed target that all social landlords must ensure their properties meet the standards by 2015.18The SHQS includes five criteria;
properties must:
· be above the statutory tolerable standard · be free from serious disrepair
· be energy efficient
· have modern facilities and services · be healthy, safe and secure19
The Scottish Government’s recent report on the SHQS found that approximately 1.4 million homes, or 61 per cent of all properties, failed to meet this standard in 2010.20A recent report
by the housing charity Shelter acknowledged that ‘the number of homes which fail the Scottish Housing Quality Standard
(SHQS) is falling’.21However, the report highlights the problem
that too many children still live in homes that do not reach the SHQS. They also estimate that 186,000 children live in houses that have condensation or damp, increasing children’s risk of asthma or other respiratory problems, and approximately one in ten (96,000) children live in overcrowded housing.22The
meeting the SHQS than private landlords, as 66 per cent of private sector homes, compared with 61 per cent of social housing properties, failed to meet the SHQS in 2008.23
Evidence published by the Scottish Government demon-strates that the social housing sector has a much stronger association with child poverty than other types of housing tenure: 63 per cent of children living in relative poverty live in social housing, while only 16 per cent of children who are not in poverty live in social housing. This research also found that 32 per cent of children who live in private rented housing are in poverty (although this equates to only one in ten of children who are living in poverty). A further 18 per cent of children who are in poverty are living in an owner-occupied home. However, the study observes that children living in a home that was bought with a mortgage are at lower risk of poverty.24
One of the types of poverty most strongly associated with housing quality and type is fuel poverty. Households are classified as living in fuel poverty if they need to spend more than 10 per cent of their income on household fuel.25The
Scottish Government’s Scottish House Condition Surveyin 2010 observed that tenants of local authority properties are most likely to be living in fuel poverty, with housing association tenants the next most likely. However, ‘extreme’ fuel poverty, whereby the household needs to spend more than 20 per cent of its income on fuel, is three times more common in privately rented or owned homes than in homes rented from a housing association.26
In 2010 28 per cent of Scottish households (658,000) were fuel poor and 7.8 per cent of households (185,000) were in ‘extreme fuel poverty’.27
Shelter’s recent research on the quality of children’s
housing in Scotland estimates that almost 20 per cent of children (179,000) in Scotland are currently living in fuel poverty. This report observes that in the previous year (between 2009 and 2010) there had been a 40 per cent increase in fuel poor households with children. It suggests that this is due to the cost of fuel increasing faster than family incomes.28The 2010 Scottish
people who live alone (55 per cent of older people who live alone experience fuel poverty and 23 per cent are in extreme fuel poverty); other small pensioner households (eg pensioner couples), of which 40 per cent are in fuel poverty and 18 per cent are in extreme fuel poverty; and lone parents, of whom 31 per cent are fuel poor.29Other risks of fuel poverty relate to the type
of building (detached houses present the greatest risk of fuel poverty, as do older buildings, while terraced houses and tenement flats present less risk). There are also varying risks of fuel poverty associated with the geographical area, with extreme fuel poverty twice as common in rural areas (14 per cent of households) than in urban areas (7 per cent of households).30
Area-based deprivation
A variety of other research has also demonstrated the link between area-based deprivation and household poverty. The Scottish Government’s child poverty review identified the fact that child poverty is particularly prevalent in deprived areas, with 45 per cent of children in the 15 per cent most deprived areas in Scotland living in relative poverty; 17 per cent of children in the remaining 85 per cent of Scotland are living in relative poverty.31Shelter’s report also observes that Scottish
children who are living in social housing are more likely to live in deprived areas, as 53 per cent of all social housing is located in the 15 per cent most deprived areas.32
In contrast to fuel poverty, the Scottish Government’s review observes that there is some evidence that relative poverty is less prevalent in rural areas, with 13 per cent of people in rural areas, in comparison with 18 per cent of people in urban areas, living in relative poverty.33Data from the Growing Up in
Other data suggest that children living in a deprived area have a greater risk of:
· lower participation in education (see more on educational attainment below)
· school exclusion
· unemployment on leaving school
· being a victim of crime (including property crime and violent crime)35
The Scottish Government’s 2008 strategy for tackling povertyAchieving our Potentialobserved that the number of deaths that result from violent assault in the most deprived areas are ten times higher than those in the least deprived areas.36
Independent research by Susan Deacon for the Scottish Government to explore how children can be given the best start in life from the early years onwards, published in 2011,
considered some of the evidence on how area-based deprivation can shape children’s experiences in the early years. Her report drew on a variety of sources, including evidence from Growing Up in Scotland, and found that children growing up in more deprived areas are disadvantaged in various ways:
· 20 per cent of parents with children under 5 perceived their neighbourhood to have low child-friendliness.
· Parents living in deprived areas are more likely than other parents to report low access to services like childcare, health and leisure facilities.
· Parents living in deprived areas and social housing were more likely to be dissatisfied with local facilities.37
Educational disadvantage and worklessness
Educational disadvantage
These are the figures on educational disadvantage from the Scottish Government’s annual report on attainment, leaver destinations and healthy living for 2012:
· 52.5 per cent of school leavers left with one or more passes at higher or advanced higher level and 45.4 per cent of school leavers left with one or more passes at Scottish Credit and Qualifications Framework (SCQF) levels 3–5 as their highest qualification.
· 2.1 per cent of school leavers attained no passes at SCQF level 3 or better. This included 5.4 per cent of those who left school at age 16 or under, 0.3 per cent of those who left school at 17 and 0.6 per cent of those who left school at 18 or above.
· 12.8 per cent of school leavers did not go on to a ‘positive destination’ (defined as higher education, further education, training, voluntary work, employment and ‘activity agreements’). · The average tariff score (calculated according to the number and type of educational qualifications achieved) of school leavers in positive destinations (409) was more than double that of school leavers who did not go on to positive destinations (188).38
This report also demonstrates the link between young people’s educational attainment and the characteristics of the area where they went to school. In 2010/11, the average tariff score for young people who went to school in large urban areas was 375, compared with an average score of 424 for children who went to school in remote rural locations. 85.7 per cent of young people who went to school in a large urban area had a ‘positive destination’ in comparison with 91.3 per cent of those educated in a remote rural location.39An earlier annual report notes that it
is likely that this disparity is linked to different levels of deprivation in the areas.40
average tariff score of 250, which was less than half the average score achieved by school leavers educated in the 20 per cent least deprived areas (531). Over three-quarters of young people (77.9 per cent) leaving schools in the 20 per cent most deprived areas went on to a ‘positive destination’, compared with 94.5 per cent of young people leaving schools in the 20 per cent least deprived areas.
Research by a Literacy Commission (commissioned by Scottish Labour) in 2009 estimated that approximately 19 per cent of children (equating to 13,000) in Scotland are not ‘functionally literate’ when they finish primary school (national data are not collected). The same study found that over 20 per cent of children in two local authorities have not reached the required standards in reading at age 14 and 10–19 per cent of 14-year-olds had not reached these standards in six other local authorities. Half of 14-year-olds in two local authorities and just under a third in six local authorities did not reach appropriate standards in reading.41
A report published by the Scottish Government in 2008 estimated that 39 per cent of men and 36 per cent of women of working age had a level of literacy that was likely to have a negative impact on their employment opportunities and life chances.42The Scottish Government’s review of evidence on
child poverty in 2010 observed: ‘Education is strongly linked with employment for parents, with those parents taking part in Working For Families who did not have any qualifications having a lower likelihood of entering paid employment.’43These
various findings illustrate how area-based deprivation, poor educational attainment and poor subsequent employment opportunities could contribute to the intergenerational transmission of poverty from parent to child.
Worklessness
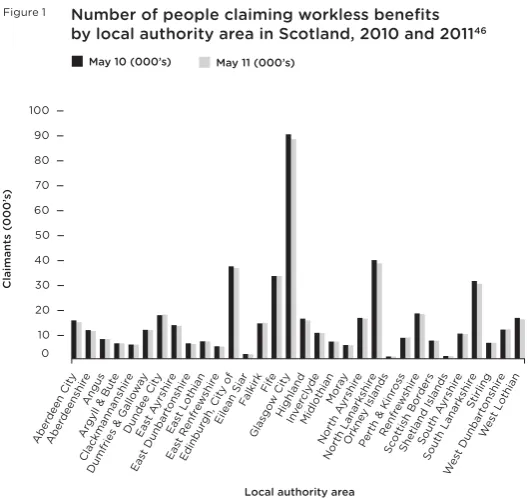
workless households in Scotland (see figure 1), although the proportion of workless households in Glasgow fell between 2010 and 2011.44The ONS reports that temporary and long-term
sickness was the main reason given for not working by workless households across the UK. In Scotland 34.1 per cent of workless households gave this reason for not being in work.45
A report published by the Scottish Government in 2009 found that 13.7 per cent of children (nearly one in seven) were living in workless households in 2008. However, in Glasgow nearly a quarter of children (24.5 per cent) were in workless households.47This has implications for the risk of relative
poverty experienced by these children, as the Scottish Government’s review of child poverty observed, ‘The risk of child poverty is reduced as access to work increases... the number of children living in poverty is lower in households
Ab erd een Ci ty Ab erd ee nsh ire Angu s Arg yll & Bu te Cla ck mannan shir e Dund ee C ity Ea st A
yrsh ire
Ea st D
unbar ton
shir e
Ea st L
oth ian Ea st R enfr ew shir e Edinbur
gh, C
ity o f
Eile
an S
iar Fa lkir k Fif e Gla sg ow Ci ty Hig hland
Inve
rcly de Mid loth ian Mo ray No
rth A
yrsh ire
No rth L
anar ksh
ire
Or kn
ey Isl and
s
Pe rth & K
inr oss Re nfr ew shir e Scott ish Bo rde rs Shetl and Isl and s So
uth A
yrsh ire
So
uth L
anar ksh ire Stir ling Wes t D unbar ton shir e We st L oth ian Dumfri es & Ga llo wa y Cl aiman ts (000’ s )
Local authority area
100 80 90 70 50 30 60 40 20 10 0
May 10 (000’s) May 11 (000’s)
[image:28.340.39.304.53.302.2]where more adults are working.’48Correspondingly, the risk of
child poverty is greater in workless families than in families where at least one adult is working; 71 per cent of children in workless families are in poverty, while 11 per cent of children in working families are in poverty. However, as this review observes, children in working families still make up more than two-fifths (42 per cent) of children in poverty.49Therefore, work
(especially part-time or low-paid work) is not always protective against poverty.
In 2011 the Scottish Centre for Social Research conducted analysis of the Growing Up in Scotland study to explore, among other things, the risk factors for parental unemployment and job loss (defined as a substantial decrease in household employment, equivalent to a single parent losing a part-time job or one parent in a couple family losing a full-time job). The authors of this study observed:
Parental unemployment is related to lower educational attainment and higher probability of economic inactivity, psychological distress and smoking among young adults, with the experience of parental worklessness in early childhood (aged 0–5) having the strongest influences on later educational attainment and economic inactivity.50
This analysis of five years of survey data relating to the Growing Up in Scotland birth cohort (collected between 2005/ 06 and 2009/10) contributed the following findings regarding parental characteristics that increased the risk of job loss:
· Lone parents were much more likely than couple families to experience ‘sustained job loss or substantial reduction in
working hours’ (13 per cent of lone parent families in comparison with 5 per cent of couple families).
· Lone parents who were at greater risk of job loss included mothers with more than one child and those living in urban areas (as opposed to small towns or rural areas).
· Both lone parents and couple families were at greater risk of job loss if the mother was younger (aged under 20), the mother had poor physical health, the main earner was from a lower
occupational class, the family was living on a low income, or the family lived in a deprived area.51
This study also explored family outcomes relating to job loss (as measured in the survey wave that took place in 2009/10). The authors found that when stably employed families were compared with those that had experienced job loss, for both lone parents and parental couples, the families that had job loss were more likely to show:
· a high level of ‘home chaos’ · income poverty
· high conflict in the parent–child relationship
However, income poverty was higher among lone parents than parental couples, and lone parents that had a substantial reduction in working hours were more likely to experience poor mental health. The same deterioration in mental health was not apparent in parental couples, which led the authors to comment: ‘This may indicate that the support of a partner may have a protective influence following job loss, or it may indicate a more voluntary (or unconstrained) reduction in work intensity among couple families.’52
Overall these findings highlight the impact of parents’ work status on the family environment in which their children grow up, with important implications for their children’s subsequent development and employment prospects. We can also see how parents’ own characteristics (including age, health and relationship status) are related to their employment opportunities.
Health inequalities
with other regions within the UK. For example, data on life expectancy published by the ONS in 2011 found that across the UK male life expectancy at birth was highest in Kensington and Chelsea (85.1 years in 2008–10) and lowest in Glasgow City (71.6 years in 2008–10), with a gap of 13.5 years between the two areas.53
Within Scotland, data on health inequalities collected by the Scottish Government demonstrate substantial divergence on a number of health indicators between more and less deprived areas in Scotland. For example, the ‘premature mortality’ indicator (measuring deaths among people aged under 75) finds that premature deaths are considerably less common in areas of low deprivation. In 2008, the rate of premature death per 100,000 people was 698 in the 10 per cent most deprived areas, in comparison with 205 in the 10 per cent least deprived areas (more than three times higher).54
The ‘healthy life expectancy’ indicator (measuring ‘the number of years people can expect to live in good health’) provides similar findings, with healthy life expectancy lower for both men and women in deprived areas than in areas of low deprivation. In 2007/08, men living in the most deprived decile could expect to live 18.8 fewer years in good health than men in the least deprived decile. Women from deprived areas could expect 17.1 fewer years of good health.55
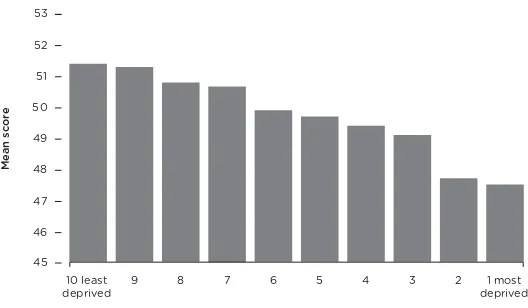
These health inequalities are not only limited to physical health; the same trends are also apparent in mental health. Between 2008 and 2010, the Scottish Health Survey included a measure of wellbeing called the Warwick-Edinburgh Mental Wellbeing Scale. The Scottish Government’s statistics on health inequalities report that there was a difference of 3.9 points between the Warwick-Edinburgh Mental Wellbeing Scale scores of men and women in the most deprived decile and those in the least deprived decile (see figure 2).56
Data derived from the Growing Up in Scotland study can shed light on the impact of maternal and child health inequalities on children’s health and development in the early years. Findings from a study published by the Scottish Government in 2010,
· 41 per cent of mothers living in the 20 per cent most deprived areas smoked when their child was in early infancy compared with only 8 per cent of mothers living in the 20 per cent least deprived areas.
· Nearly a quarter (23 per cent) of children in the most deprived areas ate one piece of fruit a day or less, compared with 8 per cent of children in the least deprived areas. 37 per cent of children in the most deprived areas, compared with 22 per cent of children in the least deprived areas, ate only one type of vegetable a day or less.
· Approximately one third of children in the least deprived areas ate sweets or crisps daily, while half of children in the most deprived areas ate these unhealthy foods every day.
· The 25 per cent least active children at age 34 months included about twice as many children from the least deprived areas (34 per cent of children from ‘least deprived’ areas, in comparison with 18 per cent from the most deprived).
· In 27 per cent of families in the least deprived areas, the mother had experienced a long-term health problem or disability once or
45 10 least
deprived
9 8 7 6 5 4 3 2 1 most
deprived
Me
an
sc
o
r
e
Income–employment index deciles
53
52
50
48
51
49
47
46
Mental wellbeing scores by income–employment index deciles in Scotland, ages 16+, 200957
[image:32.340.40.304.84.238.2]more since their child’s birth. In the most deprived areas 42 per cent of mothers had experienced a health problem or disability.58
Another study of the Growing Up in Scotland survey, which looked specifically at mothers’ mental health (published in 2010), found that overall about a third of mothers who took part in the survey experienced mental health problems at some point during the four year period after their baby’s birth.59At
any one wave of the survey, between 12 per cent and 14 per cent of mothers were experiencing poor mental health. Mothers who reported low mental health at the time of the first survey were more likely to have problems during subsequent sweeps of the survey. The authors observed: ‘Mental health difficulties were associated with a mother’s social circumstances: those who experienced poverty and those living in an area of deprivation were more likely to experience brief and repeated mental health problems.’ They also found that recurring mental health problems were associated with experiences of relationship difficulties or a lack of wider social support.60
These mothers’ experience of good or poor mental health was found to be associated with their child’s develop-mental outcomes:
Children whose mothers had good or average mental health throughout the survey period had better social, behavioural and emotional development than those whose mothers had brief mental health problems, and they in turn, had better development than those whose mothers had repeated mental health problems.61
This relationship remained statistically significant when other social and economic factors were controlled for. However, the relationships between children’s cognitive development at age 34 months and their mothers’ mental health did not remain significant once controls were applied.62
Scotland and England, with 80 per cent of Scottish young people and 81 per cent of English young people rating their health as excellent. However, self-rated health varies according to gender and level of deprivation. Among young people from the most affluent backgrounds, 87 per cent of men and 79 per cent of women rated their health as excellent, in comparison with 76 per cent of men and 74 per cent of women from the least affluent backgrounds.63As evidence in other sections of this review
suggests, adults’ health status has implications for their employment prospects and likelihood of experiencing poverty once they have a family, as well as for their quality of life. Therefore this disparity in self-rated health between young people from more and less affluent backgrounds could have substantial implications for the future life chances of young people from more deprived backgrounds, and even for the life chances of their children.
Alcohol consumption and drug use
Alcohol consumption
The Scottish Government’s 2009 strategy document Changing Scotland’s Relationship with Alcohol observed:
Excessive drinking can cause families to break down; it can result in crime and disorder, especially at weekends; and it causes loss of productivity through sickness. Estimates are that alcohol misuse costs Scotland £2.25 billion every year.64
It also noted that alcohol misuse is now a mainstream issue, with as many as 50 per cent of men and 30 per cent of women in Scotland drinking more than the maximum recommended weekly limits.65
admissions per 100,000 population in deprived areas, in comparison with only 145 admissions per 100,000 people in areas of low deprivation.66
National statistics collected by the Scottish Government also monitor rates of alcohol-related deaths among people aged between 45 and 74: there was a 13 per cent increase in alcohol-related deaths among this age group between 1998 and 2008, with the annual number of deaths reaching 1,800. Again, area-based deprivation appears to be strongly associated with the rate of related deaths in this age group, with only 28 alcohol-related deaths per 100,000 population in the 10 per cent least deprived areas in 2008, in comparison with 259 alcohol-related deaths in the 10 per cent most deprived areas.67
In 2007 the Scottish Centre for Social Research analysed the Growing Up in Scotland study for the Scottish Executive, to explore rates of alcohol consumption among Scottish parents in 2004/05 (including 5,217 parents of babies aged 10 months and 2,859 parents of toddlers aged approximately 34 months). This study found that, overall, approximately 80 per cent of parents of children in both cohorts drank alcohol at least monthly, with approximately 20 per cent drinking more than once a week. Parents of babies drank fewer units of alcohol each week (an average of 3.8 units), compared with the parents of toddlers (an average of 4.4 units each week).68In both the birth and toddler
cohorts, just under three-quarters of parents reported occasionally drinking more than five units of alcohol in one instance (above the maximum recommended daily intake for women of three units), with 22 per cent of babies’ parents and 27 per cent of toddlers’ parents doing this two or three times a month or more.
Parents’ alcohol consumption was related to the level of deprivation in the area where they lived, as well as their
areas to say that they drank five or more units on a single occasion each week (15 per cent in comparison with 7 per cent). This suggests that mothers from the most deprived areas may be at greater risk of developing problem drinking behaviours. Analysis of parents’ alcohol consumption according to their household income provided similar findings. Overall, fewer parents in the lowest household income bracket drank alcohol once a week or more (8 per cent), compared with those in the highest income bracket (36 per cent). However, mothers in the lowest income group were less likely to say that they never drank five or more units in one instance (20 per cent) than those in the highest income group (33 per cent).69
This study also found that lone parents were more likely not to drink at all than parents in couple relationships (22 per cent of lone mothers in the baby cohort in comparison with 18 per cent of partnered mothers). Parents in couple relationships were also more likely to drink alcohol each week than lone parents (21 per cent in comparison with 6 per cent). However, despite this, overall lone parents drank more units of alcohol each week (4.2 on average in comparison with 3.7 for partnered parents). Lone parents were also more likely to drink five or more units of alcohol in one instance than parents in couple relationships (15 per cent compared with 8 per cent).70Again,
this may suggest that lone parents are at greater risk of developing problematic drinking behaviours than two-parent couples, with associated risks for their children.
Drug use
The Scottish Government’s 2008 strategy for tackling drug abuse observed that approximately 52,000 people in Scotland were problem drug users while between 40,000 and 60,000 children were estimated to be affected by the drug problems of a parent. The strategy estimated that the cost of drug abuse to the public purse in Scotland amounted to £2.6 billion each year.71
cent to 6.6 per cent. In the same survey, 3.5 per cent of adults said they had used drugs in the last month, compared with 4.2 per cent of adults the previous year.72However, at the most
serious end of the scale there is also evidence that levels of problematic drug use in Scotland have increased, with 584 drug-related deaths in 2011, ‘more than in any previous year and an increase of 99 (20 per cent) compared with 2010 and 76 per cent more than in 2001’.73These deaths were particularly
concentrated in two health authority areas: the Greater Glasgow & Clyde NHS Board area (33 per cent of the deaths) and Lothian (13 per cent of these deaths).74
Annual drug misuse statistics collected by the Scottish Government annually include information relating to people who received a specialist assessment for their ‘drug use and care needs for the first time’. The report for 2011 recorded 10,813 ‘new’ assessments for drug support services (equivalent to 219 per 100,000 of the Scottish population).75The people covered
by the report had the following characteristics: · 71 per cent were male and 29 per cent were female.
· The median age was 32, with 60 per cent aged 30 and over. · 96 per cent were ‘white Scottish’.
· 67 per cent were unemployed (a smaller proportion than in 2009/10 when 73 per cent of individuals were unemployed). · 70 per cent said they funded their drug use with benefits, 22 per
cent funded their drug use with crime, and 15 per cent funded their drug use with debt.
· 72 per cent of those who provided information on their tenure lived in owned or rented accommodation (a reduction from 80 per cent the previous year), 12 per cent were homeless and 1 per cent lived in supported accommodation.
· 19 per cent had previously been in prison.
· 25 per cent had a drug-related physical health problem and 26 per cent said they had mental health problems; 16 per cent reported alcohol problems as well as their drug use problems. · 41 per cent said they had dependent children under the age of 16
These statistics give an indication of the types of
disadvantage that may be associated with problematic drug use (eg unemployment, homelessness, physical health problems and mental health problems). They also highlight the fact that a substantial proportion of problematic drug users (approximately two-fifths) have dependent children, a group of children that a sizeable body of research suggests will be at higher risk of experiencing neglect or maltreatment.76
Child abuse and neglect
For children and young people, abuse and neglect are hugely important indicators of disadvantage. In a substantial review of evidence on child neglect published by the NSPCC in 2012, Radford and colleagues observed:
Abuse and neglect by parents or guardians was found to be associated with children’s and young people’s poorer emotional wellbeing, including current thoughts about self-harm and suicidal ideation. Witnessing domestic violence was also related to poorer emotional wellbeing. Experiencing physical violence from a parent or guardian and witnessing domestic violence were also associated with higher levels of delinquent behaviour.77
A review of child neglect in Scotland carried out by researchers at the University of Stirling for the Scottish Government sought to calculate the prevalence of child neglect in Scotland. This report found that in 2011 child neglect
continued to be the most frequent reason for a child being made subject to a child protection plan. In 2010 there were 1,098 registrations for neglect, which equates to 0.12 per cent of children aged 0–15 in Scotland (or approximately one in every 1,000 children).78
Other national statistics demonstrate that 39,217 children were referred to the Children’s Reporter in 2010/11,
neglect to 2,062 adults in the general public and 2,174 pro-fessionals (in jobs including teaching, social work, policing and health). This poll found that about 30 per cent of the Scottish public (compared with 29 per cent of the public in Wales and 26 per cent of the public in England) said they ‘had been worried or very worried about a child’. The same poll found that about 52 per cent of the Scottish public were confident that professionals would respond adequately to concerns about a child, compared with 39 per cent who were less confident that the professional response would be adequate.79The adequacy of professional
responses to abuse and neglect of children is clearly of immense importance to the effectiveness of public policy and services in addressing childhood disadvantage.
2
Quantifying experiences
of multiple disadvantage
among families in
Scotland
The purpose of this study is to develop new data to help us understand the scale and nature of disadvantage affecting families in Scotland. The key research questions are:
· How many households in Scotland experience multiple disadvantage?
· Does the prevalence of multiple disadvantage vary by local area? · Which types of household are most at risk of multiple
disadvantage?
Demos commissioned researchers at NatCen to perform secondary analysis of the latest available two-year dataset of the Scottish Household Survey (2009/10), which contains
information from over 28,000 households in Scotland. The large size of this survey means that it is possible to look at multiple disadvantage within local areas, and also according to sub-groups of the population (eg families with children, working-age adults without children and older people).
Methodology
There is no established method for choosing which disadvantages should be considered in an investigation of multiple disadvantage, but previous research has sought to gain a spread across a variety of issues.80In this report we were only
appropriate indicators relating to alcohol or drug use or experiences of crime were available for this purpose.
We selected seven types of disadvantage for the purpose of this report (these are defined in more detail in box 1):
· low income · worklessness
· no educational qualifications · overcrowding
· ill health
· mental health problems · poor neighbourhood
Box 1 Definition of the indicators of disadvantage
We use seven indicators of disadvantage in this report. Much of the information in the Scottish Household Survey is collected from the highest income householder about the household or themselves (which is then used as a proxy for the household).81
These are the indicators:
· Low income:The highest income householder is asked about his or her income and that of their partner and one further random adult in the household.82The total weekly net income
of the household is then calculated but not equivalised. Rates of low income are set to match estimates from Households Below Average Income.83
· Worklessness: The highest income householder is asked about the employment status of each of the people in the household. If the highest income householder is not of working age then the household is set to missing for this indicator. For all other households, each person in the household is assessed, with those who are ‘self employed’, ‘employed full time’ or ‘employed part time’ set as working, and those with any other response set as not working. A household where everyone of working age is not working is set as workless.
qualification. If they record a response of ‘no qualifications’, then the indicator for the household is set as lacking educational qualifications.
· Overcrowding:This indicator is similar to the official ‘bedroom standard’ approach of measuring overcrowding. The bedroom standard allocates a separate bedroom to each married or cohabiting couple, any other person aged 21 or over, each pair of adolescents aged 10–20 of the same sex, and each pair of children aged under 10. Any unpaired person is allocated a separate bedroom. This is then compared with the actual number of bedrooms, which was self-reported by the highest income householder from the question ‘How many bedrooms do you have in this property? Please include any bedrooms that are currently being used for other purposes.’ Any household with a bedroom allocation higher than the number of actual bedrooms is said to be overcrowded.
· Ill health:The highest income householder is asked whether each of the people in the household has any long-standing illness, health problem or disability that limits their daily activity or the kind of work that they can do. They are then asked what this ill health or disability is. Any response other than ‘mental health problems’ is recorded as someone having poor health.
· Mental health problems:The highest income householder is asked whether each of the people in the household has any long-standing illness, health problem or disability that limits their daily activity or the kind of work that they can do. They are then asked what this ill health or disability is. A response of ‘mental health problems’ is recorded.
· Poor neighbourhood:The highest income householder is asked how they would rate their neighbourhood as a place to live. A response of ‘fairly poor’ or ‘very poor’ indicates a poor neighbourhood.
household has is then calculated, and again compared across local areas. The types of households most at risk of multiple disadvantage are explored by using other socio-demographic characteristics contained in the Scottish Household Survey dataset, such as age, family composition and tenure. Findings for Scotland as a whole are presented separately for households in three separate population sub-groups; households with children; working age households without children; and pensioner households.84
The findings presented in this chapter adopt the same conventions for conveying research findings as the Scottish Household Survey reports produced by the Scottish Government.85The most common statistic presented in the
report is a percentage, for example the percentage of households with four or more disadvantages. Percentages produced in a survey such as the Scottish Household Survey have a degree of error because they are generated from a sample of the population rather than the population as a whole. Needless to say,
percentages within this report should be compared with caution, especially when the sample size is small. However, we have sought to maximise sample size by using the two-year version of the Scottish Household Survey and a local area variable on the Scottish Household Survey dataset that combines local authorities with small sample sizes (see appendix B for more details).
Main findings
We analysed each population sub-group – families with children, working age households without children, and pensioner households – separately. The report particularly focuses on findings for families with children, but also presents new evidence on the other sub-groups.
Prevalence of disadvantage
As we would expect, some forms of disadvantage are more prevalent for particular sub-groups:
Low
inco me
Ove
rcrow ded
Ill he
alth
Men tal he
alth
Wo
rkle
ss
Poo
rne igh
bour
hoo d Ho u sehol d s w i th di s ad v an t ag e (%) 100 80 90 70 50 30 60 40 20 10 0
Families with children
Workingage households without children
Pensioner
households
Prevalence of disadvantage by population sub--group,
Scotland, 2009 and 2010
Figure 3
· Families with children have higher rates of overcrowding, as a result of the number of rooms required to house parents and children.
· Working age households without children have higher rates of worklessness; these households are more likely than those with children to contain students and single people (who are more likely to fall into the ‘workless’ category as there is only one person in the household who can work).
It is important to note that the data these indicators draw on are self-reported, rather than objectively assessed; for example, the data are based on individual people’s assessments of their health rather than those of medical practitioners. Older people’s lower willingness to report detrimental aspects of their lives may explain their relatively low rates of mental health problems and neighbourhood dissatisfaction compared with people in the other population sub-groups.
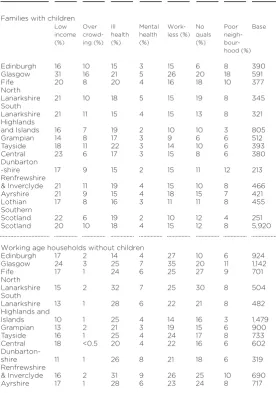
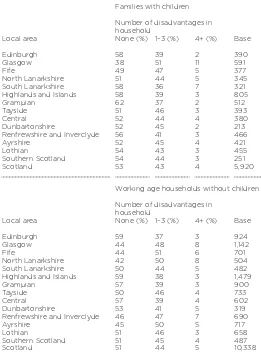
Table 1 presents the seven indicators of disadvantage by local area, again categorised separately into each of the three population sub-groups. These are the general findings for all three sub-groups:
· Glasgow records high rates of households with low income, which were overcrowded and workless, and had no educational qualifications and a poor opinion of their neighbourhood. · Fife and North Lanarkshire also record high rates of households
with no educational qualifications.
These are the findings for families with children:
· Glasgow clearly comes out as the most disadvantaged area, with high ratings for disadvantage across all seven indicators. · Lothian, Grampian, Highlands and Edinburgh show the lowest
levels of disadvantage across the seven indicators.
Prevalence of multiple disadvantage
In this study we have calculated multiple disadvantage by count-ing the number of disadvantages each household had (from nil to seven).86We then created three categories to enable us to
compare households with different numbers of disadvantages:
· households with no disadvantages
Table 1 Prevalence of disadvantage indicators by local area and
population sub-group, Scotland, 2009 and 2010
Families with children
Low Over Ill Mental Work- No Poor Base income crowd- health health less (%) quals neigh-(%) ing (%) (%) (%) (%)
bour-hood (%)
Edinburgh 16 10 15 3 15 6 8 390
Glasgow 31 16 21 5 26 20 18 591
Fife 20 8 20 4 16 18 10 377
North
Lanarkshire 21 10 18 5 15 19 8 345
South
Lanarkshire 21 11 15 4 15 13 8 321
Highlands
and Islands 16 7 19 2 10 10 3 805
Grampian 14 8 17 3 9 6 6 512
Tayside 18 11 22 3 14 10 6 393
Central 23 6 17 3 15 8 6 380
Dunbarton
-shire 17 9 15 2 15 11 12 213
Renfrewshire
& Inverclyde 21 11 19 4 15 10 8 466
Ayrshire 21 9 15 4 18 15 7 421
Lothian 17 8 16 3 11 11 8 455
Southern
Scotland 22 6 19 2 10 12 4 251
Scotland 20 10 18 4 15 12 8 5,920
Working age households without children
Edinburgh 17 2 14 4 27 10 6 924
Glasgow 24 3 25 7 35 20 11 1,142
Fife 17 1 24 6 25 27 9 701
North
Lanarkshire 15 2 32 7 25 30 8 504
South
Lanarkshire 13 1 28 6 22 21 8 482
Highlands and
Islands 10 1 25 4 14 16 3 1,479
Grampian 13 2 21 3 19 15 6 900
Tayside 16 1 25 4 24 17 8 733
Central 18 <0.5 20 4 22 16 6 602
Dunbarton-shire 11 1 26 8 21 18 6 319
Renfrewshire
& Inverclyde 16 2 31 9 26 25 10 690
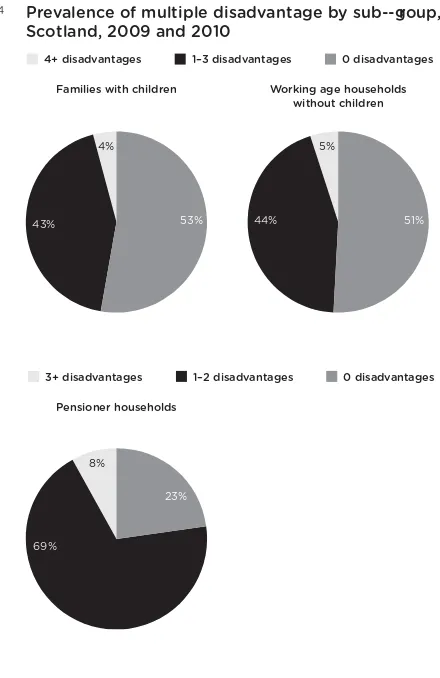
There was little variation in rates of multiple disadvantage between families with children and working age households without children (see figure 4). Pensioner households had noticeably higher rates, mainly as a consequence of the higher prevalence of ill health and lower educational attainment in this sub-group.
Table 1 Prevalence of disadvantage indicators by local area and
population sub-group, Scotland, 2009 and 2010 – continued
Working age households without children – continued
Lothian 13 1 24 4 20 18 5 658
Southern
Scotland 13 <0.5 23 5 18 24 4 487
Scotland 16 1 24 5 24 19 7 10,338
Pensioner households
Edinburgh 15 1 47 2 - 29 5 508
Glasgow 19 1 63 5 - 60 8 624
Fife 18 <0.5 55 2 - 54 4 521
North
Lanarkshire 12 1 66 4 - 59 5 357
South
Lanarkshire 21 <0.5 56 4 - 54 4 376
Highlands and
Islands 16 1 51 2 - 44 2 1,216
Grampian 14 <0.5 50 3 - 43 2 612
Tayside 19 1 56 2 - 34 4 614
Central 13 <0.5 49 2 - 40 3 453
Dunbarton-shire 12 <0.5 49 4 - 48 6 270
Renfrewshire
& Inverclyde 15 <0.5 55 3 - 43 5 477
Ayrshire 16 <0.5 51 2 - 50 4 592
Lothian 22 1 51 2 - 42 3 486
Southern
Scotland 23 1 46 1 - 54 3 509
Scotland 17 <0.5 54 3 - 47 4 7,615
Base: Households in Scotland
Families with children
Pensioner households
Workingage households
without children
Prevalence of multiple disadvantage by sub--group, Scotland, 2009 and 2010
Figure 4
4+ disadvantages 1–3 disadvantages 0 disadvantages
3+ disadvantages 1–2 disadvantages 0 disadvantages
4%
8%
69%
23%
5%
44% 51%
43% 53%
How many multiply disadvantaged households are
there in Scotland?
In 2010 there were over 2.3 million households in Scotland.87
[image:49.340.72.292.54.393.2]Table 2 Population estimates of multiply disadvantaged
households in Scotland, 2010
Number of disadvantages in household
None 1–3 4+ Total
Families with children 299,000 243,000 24,000 566,000
Working age households
without children 558,000 487,000 55,000 1,101,000
Pensioner households91 157,000 482,000 52,000 691,000
Scotland 1,014,000 1,212,000 131,000 2,357,000*
Notes: *Number of households taken from government estimates
from Scottish Household Survey92
Base: Households in Scotland
Source: Scottish Household Survey 2009/10
approximately 24,000 families with children in Scotland that are experiencing four or more of the seven disadvantages.
It is important to note at this point that it would not be correct to compare the number of families with children in Scotland with four or more disadvantages with the 120,000 ‘troubled families’ figure first produced by the Cabinet Office in 200788and recently quoted by the Troubled Families team at
DCLG.89As well as taking into account the caveats described in
this report, the estimates use different datasets, indicators of dis-advantage and thresholds of the most disdis-advantaged households.
In addition to this point, there are several important caveats to these estimates:
· The estimates depend on the methodology used in this report – the definitions of the sub-groups, of the disadvantage indicators and of multiple disadvantage; and the estimates could change if any of these methodologies are modified.
· Households that have missing data on at least one of the disadvantage indicators are excluded from the calculation of multiple disadvantage. There is an assumption therefore that households with at least some missing data are similar to those with no missing data.
This is despite some people electing not to take part in the survey (they may be systematically different from those who did); the survey not covering accommodations such as prisons, hospitals, military bases and larger student halls; and the sample having some variability because of the random selection of house-holds. Other research has suggested that the most disadvantaged households are less likely to take part in surveys – either by choice, because they are hard to contact or because they are excluded from the sampling frame.90Therefore, surveys may in
fact underestimate the levels of the most vulnerable households. · There is an assumption that rates of multiply disadvantaged
households in 2010 are the same as estimates from 2009/10 (separate analysis, not presented in this report, suggests they are very close).
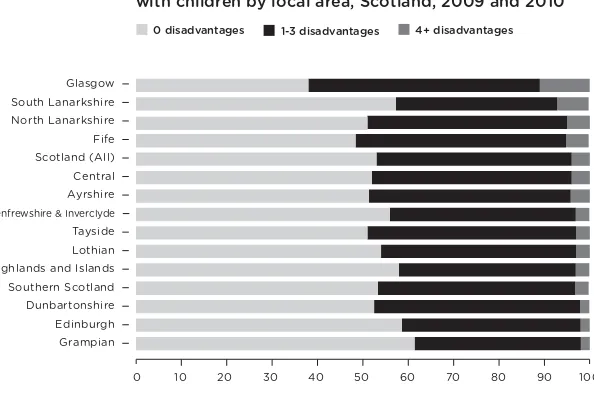
Figure 5 shows the prevalence of multiple disadvantage among families with children, according to local area. The areas are ranked based on the prevalence of families with children that demonstrate four or more disadvantages. This figure illustrates the following:
· Again, Glasgow clearly stands out as the most disadvantaged area. One in ten (11 per cent) families with children in Glasgow had four or more disadvantages.
· South Lanarkshire had the second highest rate of families with children with four or more disadvantages. As rates of the separate indicators of disadvantage were not higher than average in South Lanarkshire, this highlights the high levels of inequality in the area, with some families facing multiple disadvantage (7 per cent) and many avoiding disadvantage altogether (58 per cent).
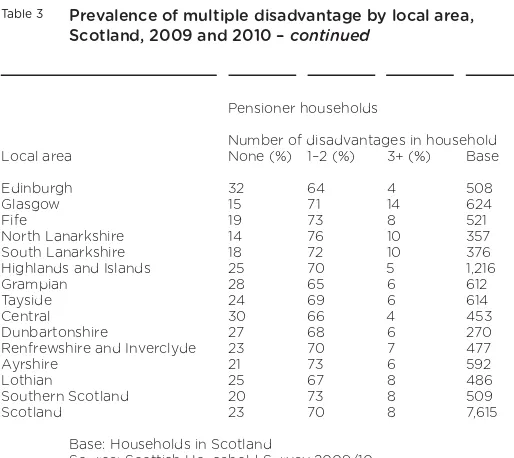
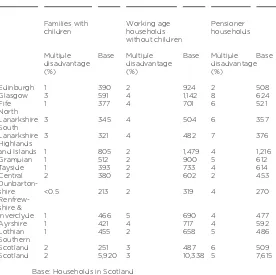
Table 3 presents the full statistics on multiple disadvantage by local area for each of the three population sub-groups:
· Glasgow had the highest proportion of households with four or more disadvantages for all three sub-groups.
Households most at risk of multiple disadvantage
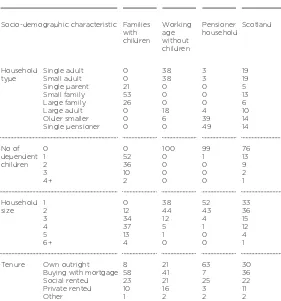
The Scottish Household Survey collects detailed information about the socio-demographic characteristics of households, such as family composition, housing tenure and rural or urban location. This makes it possible to profile households at most risk of multiple disadvantage and compare their characteristics to the population in general, thereby highlighting the households that are potentially most vulnerable to experiencing
disadvantage. Figure 6 presents the characteristics of families with children that are most at risk of multiple disadvantage. · The local area with the highest proportion of households
without any disadvantages across all three sub-groups was Edinburgh.
· Other areas with high proportions of households without any disadvantages were Highlands, Grampian and Central.
Families with childrenin Scotland (%)
North Lanarkshire South Lanarkshire Glasgow
Fife
Central Scotland (All)
Ayrshire
Renfrewshire & Inverclyde
Tayside Lothian
Edinburgh
Grampian
Highlands and Islands
Dunbartonshire Southern Scotland
100 90
80 70 60 50 40 30 20 10 0
0 disadvantages 1-3 disadvantages 4+ disadvantages
Prevalence of multiple disadvantage among families with children by local area