Schools’ Census 2011: Final Results
SDR 153/2011 6September 2011
This Statistical First Release presents the results collected by the Schools’ Census in January 2011 and updates the provisional statistics previously released on 6 July 2011 (see Notes, section 5.5). The tables shown in this release are only an overview, the more detailed information is now available in the accompanying Excel files and on StatsWales (a free to-use internet service that allows visitors to view, manipulate, create and download tables from the most up-to-date and detailed official data in Wales). To view the data please select the “Schools and Teachers” folder at the navigation screen of the following site:
www.statswales.wales.gov.uk
The tables in this release provide all Wales information for each category listed, plus a breakdown to local authority (LA) level for schools, pupils, teachers and support staff.
Additional information is provided at the end of the release showing the latest Pupil Projection figures based on the new census information (Appendix I).
Key results from the January 2011 schools’ census
Schools and pupils (Tables 1-6)
• In January 2011 there were 23 nursery, 1,435 primary, 222 secondary schools and 43 special schools. Of these, 467 primary and 56 secondary schools were classified as Welsh medium. There were
66 independent schools. Overall, there were 30 fewer LA maintained schools and 2 more independent schools than at January 2010.
• The total number of pupils (headcount) in LA maintained nursery, primary, secondary and special schools was 466,172 (969 fewer pupils than in 2010).
Chart 1: Number of pupils in maintained schools, by type of school
0 100,000 200,000 300,000 400,000 500,000
'00 '01 '02 '03 '04 '05 '06 '07 '08 '09 '10 '11
N
umbe
r of
pu
pi
ls
Primary schools Secondary schools All maintained schools
• Since 2000, the number of pupils in LA maintained schools has decreased year on year.
• Numbers of pupils in secondary schools increased from 2000 to 2004 and have decreased year on year since then.
• Numbers of pupils in primary schools decreased year on year from 2000 to 2010 but increased from 2010 to 2011.
Teachers and support staff (Tables 7-10)
• There were 24,854.4 full-time equivalent (FTE) qualified teachers in LA maintained schools, a fall of 432.2 (1.7 per cent) over the year.
• The pupil teacher ratio for all LA maintained schools was 18.2 compared to 18.0 in 2010.
• There were 21,320.5 support staff (FTE) in LA maintained schools, an increase of over 900 staff in the last year and continuing the trend of recent years. The introduction of the Foundation Phase and the Teacher Workload Agreement are the two main drivers behind the increase in support staff.
Free school meals (Table 11)
Chart 2: Percentage of pupils in maintained schools eligible for free school meals, by type of school
• The percentage of pupils known to be eligible for free school meals in primary, secondary and special schools has fluctuated over the last decade, generally decreasing from 2000 to 2008 and increasing since then.
0 5 10 15 20 25 30 35 40 45 50
'00 '01 '02 '03 '04 '05 '06 '07 '08 '09 '10 '11
%
o
f e
lig
ib
le p
u
p
il
s
Primary schools Secondary schools Special schools
• This increase may be related to that seen in the number of claimants of Jobseeker’s Allowance in Wales, which is one of the criteria for
eligibility for free meals.
• The percentage of pupils of compulsory school age in LA maintained schools known to be eligible for free school meals in 2011 was:
Primary schools 20.7 per cent – up from 20.1 per cent in 2010
Secondary schools 17.4 per cent – up from 17.1 per cent in 2010
Special schools 44.2 per cent – up from 42.0 per cent in 2010
Ethnicity (Table 12)
• In LA maintained schools 91.5 per cent of pupils (aged 5 and over) were classified as White British, 7.4 per cent were of minority ethnic origin and 1.1 per cent were unknown or not stated.
Pupils with Special Educational Needs (SEN) (Tables 13 - 14)
• In January 2011 13,839 pupils in schools in Wales had statements of SEN, 289 less pupils than in January 2010.
• In LA maintained sectors:
Primary schools: 1.6 per cent of pupils had statements of SEN and a further 19.6 per cent of pupils had special educational needs but no statement.
Secondary schools: 2.6 per cent of pupils had statements of SEN and a further 17.6 per cent of pupils had special educational needs but no statement
Special schools: 95.3 per cent of pupils had statements of SEN and 4.7 per cent of pupils had special educational needs but no statement.
Contents
Page
Schools and Pupils
Table 1 Number of schools, by local authority, January 2011 4
Table 2 Welsh medium schools and pupils, by local authority, January 2011 5
Table 3 Number of pupils, by age group, in nursery, primary, secondary and special
schools 5
Table 4 Number of pupils, full-time and part-time, by age and sex, in nursery, primary,
secondary and special schools, January 2011 6
Table 5 Pupil numbers, by local authority, January 2011 7
Table 6 Full-time equivalent pupils, by local authority, January 2011 7
Teachers and support staff
Table 7 Number of qualified teachers, by local authority, January 2011 8
Table 8 Full-time equivalent qualified teachers, by local authority, January 2011 9
Table 9 Pupil teacher ratios within schools, by local authority, January 2011 10
Table 10 Full-time equivalent support staff, by local authority, January 2011 10
Free school meals
Table 11 School meal arrangements in nursery, primary, secondary and special schools 11
Ethnicity
Table 12 Number of pupils aged 5 or over, by ethnic background, January 2011 12
Pupils with Special Educational Needs (SEN)
Table 13 Pupils with special educational needs in independent schools, by major need,
January 2011 13
Table 14 Pupils with special educational needs in schools, in maintained primary,
secondary and special schools, by major need, January 2011 14
Appendix I Pupil Projections 15
Notes 16
Schools and Pupils
Here are the key points about schools and pupils:
• The local authority with the most schools was Cardiff with 141 schools, and the local authority with the fewest was Merthyr Tydfil with 32 schools. (Table 1)
• Gwynedd had the most Welsh medium primary schools with 101, and the local authority with the fewest was Blaenau Gwent with 1 school. Gwynedd had the most Welsh medium secondary schools
with 14, and there were 4 local authorities with no Welsh medium secondary schools: Merthyr Tydfil, Blaenau Gwent, Monmouthshire and Newport. (Table 2)
• Of the pupils aged under 5 in maintained schools in Wales, the majority of them were attending school on a full time basis. (Table 3)
• Although the total number of pupils has declined over the last 4 years, the number aged under 5 has increased, reflecting the recent upturn in birth rates. (Table 4)
• Over the last decade, the total number of pupils in primary schools in Wales has decreased year-on-year, but there was an increase from January 2010 to January 2011, the first increase in the sector since 1998. (Table 4)
• The number of pupils in each local authority ranged between 9,358 in Merthyr Tydfil, to 52,775 in Cardiff. (Table 5)
• The number of full-time equivalent pupils in schools was highest in Cardiff at 50,570 pupils, and lowest in Merthyr Tydfil at 9,219 pupils. (Table 6)
Table 1: Number of schools, by local authority, January 2011
Nursery Primary Secondary Special Total Independent All schools
Isle of Anglesey 0 50 5 1 56 1 57
Gw ynedd 0 102 14 3 119 4 123
Conw y 0 61 7 1 69 2 71
Denbighshire (a) 0 52 8 2 62 4 66
Flintshire 1 74 12 2 89 2 91
Wrexham 1 60 9 1 71 3 74
Pow ys 0 101 13 3 117 10 127
Ceredigion 0 60 7 0 67 1 68
Pembrokeshire 0 61 8 1 70 4 74
Carmarthenshire 1 110 14 2 127 6 133
Sw ansea 0 84 15 2 101 4 105
Neath Port Talbot 0 71 11 3 85 0 85
Bridgend 2 52 10 2 66 3 69
The Vale of Glamorgan 3 46 8 3 60 3 63
Rhondda Cynon Taf 3 114 19 4 140 0 140
Merthyr Tydf il 3 24 4 1 32 0 32
Caerphilly 0 75 14 1 90 1 91
Blaenau Gw ent 0 27 5 1 33 0 33
Torf aen 3 30 7 1 41 0 41
Monmouthshire 0 32 4 1 37 7 44
New port 3 48 8 1 60 1 61
Cardiff 3 101 20 7 131 10 141
Wales 23 1,435 222 43 1,723 66 1,789
Wales – January 2010 25 1,462 223 43 1,753 64 1,817
Wales – January 2009 28 1,478 223 44 1,773 60 1,833
Wales – January 2008 28 1,509 222 44 1,803 66 1,869
Wales – January 2007 31 1,527 224 44 1,826 66 1,892
Table 2: Welsh medium schools and pupils, by local authority, January 2011
Schools Pupils Schools Pupils
Isle of Anglesey 49 5,074 4 3,433
Gw ynedd 101 9,587 14 7,494
Conw y 26 2,199 2 1,428
Denbighshire 19 2,097 3 3,262
Flintshire 5 808 1 560
Wrexham 7 1,321 1 802
Pow ys 23 2,813 5 3,233
Ceredigion 54 4,048 6 3,422
Pembrokeshire 19 2,872 1 967
Carmarthenshire 79 9,109 6 5,602
Sw ansea 9 2,643 2 1,413
Neath Port Talbot 13 2,187 1 975
Bridgend 4 1,069 1 336
The Vale of Glamorgan 5 1,431 1 856
Rhondda Cynon Taf 16 4,792 4 3,365
Merthyr Tydfil 2 554 0 0
Caerphilly 11 2,535 1 1,369
Blaenau Gw ent 1 287 0 0
Torfaen 3 661 1 958
Monmouthshire 2 273 0 0
New port 2 500 0 0
Cardif f 17 4,213 2 2,289
Wales 467 61,073
Wales – January 2010 476 60,318
Wales – January
56 41,764
58 43,432
2009 487 59,989 55 41,916
(a) Primary schools include Welsh Medium, Dual stream and Transitional schools. (b) Secondary schools include Welsh medium and Bilingual schools.
Further inf ormation on the def inition of Welsh medium schools may be found via the link below : http://w ales.gov.uk/topics/educationandskills/publications/guidance/definingschools?lang=en
Welsh medium Primary schools (a) Welsh medium Secondary schools (b)
Table 3: Number of pupils, by age group, in nursery, primary, secondary and special schools (a) (b)
2007 2008 2009 2010 2011
Nursery
Pupils aged: Under 5 1,752 1,787 1,791 1,672 1,572
5 and over 2 0 0 0 0
All ages 1,754 1,787 1,791 1,672 1,572
Primary
Pupils aged: Under 5 60,983 62,915 63,985 65,421 67,721
5 to 10 202,111 198,510 194,189 191,907 191,359
11 to 15 155 170 129 107 101
16 and over 12 12 11 10 8
All ages 263,261 261,607 258,314 257,445 259,189
Secondary
Pupils aged: Under 5 0 0 0 0 0
5 to 10 31 29 15 6 5
11 to 15 182,827 178,597 176,299 173,914 171,142
16 and over 27,495 28,310 29,107 29,987 30,083
All ages 210,353 206,936 205,421 203,907 201,230
Special
Pupils aged: Under 5 188 201 201 198 217
5 to 10 1,107 1,060 1,018 1,032 1,008
11 to 15 2,068 2,108 2,164 2,116 2,117
16 and over 639 671 732 771 839
All ages 4,002 4,040 4,115 4,117 4,181
Nursery, Primary, Secondary and Special
Pupils aged: Under 5 62,923 64,903 65,977 67,291 69,510
5 to 10 203,251 199,599 195,222 192,945 192,372
11 to 15 185,050 180,875 178,592 176,137 173,360
16 and over 28,146 28,993 29,850 30,768 30,930
Table 4: Number of pupils, full-time and part-time, by age and sex, in nursery, primary, secondary and special schools, January 2011 (a)
Total Total Total Total
Age as at 31 August 2010 Boys Girls Boys Girls Boys Girls Boys Girls Boys Girls Boys Girls Boys Girls
Pupils aged:
2 and under 31 43 145 161 380 462 475 2,515 2,323 5,775 0 0 0 9 4 7 4 24
3 (born 1/4/07 to 31/8/07) 69 60 207 154 490 1,190 1,198 4,737 4,600 11,725 0 0 0 11 2 11 3 27
3 (born 1/1/07 to 31/3/07) 35 33 104 113 285 1,032 894 2,533 2,479 6,938 0 0 0 2 2 7 1 12
3 (born 1/9/06 to 31/12/06) 59 56 151 133 399 1,795 1,611 3,385 3,352 10,143 0 0 0 17 2 5 6 30
4 (born 1/4/06 to 31/8/06) 8 8 2 0 18 7,245 6,815 25 14 14,099 0 0 0 35 14 1 0 50
4 (born 1/1/06 to 31/3/06) 0 0 0 0 0 4,060 3,940 2 6 8,008 0 0 0 23 9 0 0 32
4 (born 1/9/05 to 31/12/05) 0 0 0 0 0 5,620 5,400 8 5 11,033 0 0 0 23 19 0 0 42
Total Under 5 202 200 609 561 1,572 21,404 20,333 13,205 12,779 67,721 0 0 0 120 52 31 14 217
5 0 0 0 0 0 16,882 15,949 0 0 32,831 0 0 0 81 44 1 0 126
6 0 0 0 0 0 16,542 15,567 0 0 32,109 0 0 0 106 44 1 0 151
7 0 0 0 0 0 16,144 15,375 0 0 31,519 0 0 0 104 64 0 0 168
8 0 0 0 0 0 15,882 14,934 0 0 30,816 0 0 0 120 56 1 0 177
9 0 0 0 0 0 16,354 15,407 1 0 31,762 0 0 0 132 49 0 0 181
10 0 0 0 0 0 16,542 15,779 0 1 32,322 4 1 5 159 46 0 0 205
Total 5 to 10 0 0 0 0 0 98,346 93,011 1 1 191,359 4 1 5 702 303 3 0 1,008
11 0 0 0 0 0 49 44 0 0 93 16,839 16,200 33,039 270 102 0 0 372
12 0 0 0 0 0 1 0 1 0 2 17,395 16,708 34,103 293 102 0 0 395
13 0 0 0 0 0 0 0 0 0 0 18,095 17,309 35,404 360 120 0 0 480
14 0 0 0 0 0 2 2 0 0 4 17,463 16,746 34,209 308 123 0 0 431
15 0 0 0 0 0 1 1 0 0 2 17,437 16,950 34,387 318 120 1 0 439
Total 11 to 15 0 0 0 0 0 53 47 1 0 101 87,229 83,913 171,142 1,549 567 1 0 2,117
16 0 0 0 0 0 2 2 0 0 4 7,507 8,606 16,113 216 132 0 0 348
17 0 0 0 0 0 2 1 0 0 3 5,782 6,789 12,571 176 93 0 0 269
18 0 0 0 0 0 0 1 0 0 1 681 575 1,256 137 85 0 0 222
19+ 0 0 0 0 0 0 0 0 0 0 42 101 143 0 0 0 0 0
Total 16 to 19+ 0 0 0 0 0 4 4 0 0 8 14,012 16,071 30,083 529 310 0 0 839
Compulsory School Age 0 0 0 0 0 98,399 93,058 2 1 191,460 87,233 83,914 171,147 2,251 870 4 0 3,125
All ages 202 200 609 561 1,572 119,807 113,395 13,207 12,780 259,189 101,245 99,985 201,230 2,900 1,232 35 14 4,181
(a) Age as at 31 August 2010.
Full-time Full-time Part-time
Full-time Part-time Full-time Part-time
Table 5: Pupil numbers, by local authority, January 2011 (a)
Nursery Primary Secondary Special Total Independent All schools
Isle of Anglesey 0 5,259 4,208 73 9,540 92 9,632
Gw ynedd 0 9,704 7,494 144 17,342 362 17,704
Conw y 0 8,603 7,243 166 16,012 847 16,859
Denbighshire (a) 0 8,124 7,458 248 15,830 497 16,327
Flintshire 52 13,218 10,288 242 23,800 25 23,825
Wrexham 44 11,982 6,711 243 18,980 23 19,003
Pow ys 0 10,287 8,766 294 19,347 451 19,798
Ceredigion 0 5,073 4,723 0 9,796 4 9,800
Pembrokeshire 0 10,345 7,997 111 18,453 172 18,625
Carmarthenshire 77 14,691 12,038 118 26,924 793 27,717
Sw ansea 0 20,637 14,121 163 34,921 434 35,355
Neath Port Talbot 0 12,072 8,527 188 20,787 0 20,787
Bridgend 83 12,185 9,678 383 22,329 444 22,773
The Vale of Glamorgan 234 11,581 9,823 254 21,892 217 22,109
Rhondda Cynon Taf 99 21,340 17,573 436 39,448 0 39,448
Merthyr Tydf il 166 5,191 3,857 144 9,358 0 9,358
Caerphilly 0 16,629 12,351 135 29,115 133 29,248
Blaenau Gw ent 0 5,993 4,154 101 10,248 0 10,248
Torf aen 225 7,791 7,862 82 15,960 0 15,960
Monmouthshire 0 6,653 5,148 52 11,853 1,530 13,383
New port 236 12,992 10,536 112 23,876 650 24,526
Cardiff 356 28,839 20,674 492 50,361 2,414 52,775
Wales 1,572 259,189 201,230 4,181 466,172 9,088 475,260
Wales – January 2010 1,672 257,445 203,907 4,117 467,141 9,222 476,363 Wales – January 2009 1,791 258,314 205,421 4,115 469,641 9,302 478,943 Wales – January 2008 1,787 261,607 206,936 4,040 474,370 9,555 483,925 Wales – January 2007 1,754 263,261 210,353 4,002 479,370 9,699 489,069
(a) St Brigids School has pupils of both primary and secondary level w ho are included in the appropriate columns. Maintained schools
Table 6: Full-time equivalent pupils, by local authority, January 2011 (a)
FTE
Nursery Primary Secondary Special Total Independent All schools
Isle of Anglesey 0.0 4,997.0 4,208.0 72.5 9,277.5 68.5 9,346.0
Gw ynedd 0.0 9,126.5 7,494.0 141.5 16,762.0 362.0 17,124.0
Conw y 0.0 8,061.5 7,243.0 165.5 15,470.0 847.0 16,317.0
Denbighshire (a) 0.0 7,608.0 7,458.0 248.0 15,314.0 497.0 15,811.0
Flintshire 26.0 12,385.5 10,288.0 238.5 22,938.0 25.0 22,963.0
Wrexham 22.0 11,169.0 6,711.0 243.0 18,145.0 23.0 18,168.0
Pow ys 0.0 10,077.5 8,766.0 290.0 19,133.5 451.0 19,584.5
Ceredigion 0.0 4,944.0 4,723.0 0.0 9,667.0 4.0 9,671.0
Pembrokeshire 0.0 9,830.5 7,997.0 110.5 17,938.0 172.0 18,110.0
Carmarthenshire 77.0 14,524.5 12,038.0 118.0 26,757.5 793.0 27,550.5
Sw ansea 0.0 18,952.0 14,121.0 162.0 33,235.0 413.0 33,648.0
Neath Port Talbot 0.0 11,088.5 8,527.0 187.5 19,803.0 0.0 19,803.0
Bridgend 72.0 12,057.0 9,678.0 382.0 22,189.0 439.5 22,628.5
The Vale of Glamorgan 117.0 10,820.5 9,823.0 253.5 21,014.0 213.0 21,227.0
Rhondda Cynon Taf 99.0 21,317.0 17,573.0 435.0 39,424.0 0.0 39,424.0
Merthyr Tydf il 164.5 5,053.5 3,857.0 144.0 9,219.0 0.0 9,219.0
Caerphilly 0.0 15,623.5 12,351.0 133.5 28,108.0 133.0 28,241.0
Blaenau Gw ent 0.0 5,595.0 4,154.0 101.0 9,850.0 0.0 9,850.0
Torf aen 113.5 7,399.5 7,862.0 81.0 15,456.0 0.0 15,456.0
Monmouthshire 0.0 6,416.0 5,148.0 52.0 11,616.0 1,502.0 13,118.0
New port 118.0 12,318.5 10,536.0 112.0 23,084.5 644.5 23,729.0
Cardiff 178.0 26,830.5 20,674.0 485.5 48,168.0 2,402.0 50,570.0
Wales 987.0 246,195.5 201,230.0 4,156.5 452,569.0 8,989.5 461,558.5
Wales – January 2010 1,033.5 245,155.0 203,907.0 4,092.5 454,188.0 9,082.5 463,270.5 Wales – January 2009 1,138.0 246,323.5 205,421.0 4,087.0 456,969.5 9,176.5 466,146.0 Wales – January 2008 1,121.0 249,762.0 206,936.0 4,008.5 461,827.5 9,408.0 471,235.5 Wales – January 2007 1,143.0 251,941.0 210,353.0 3,976.5 467,413.5 9,575.5 476,989.0
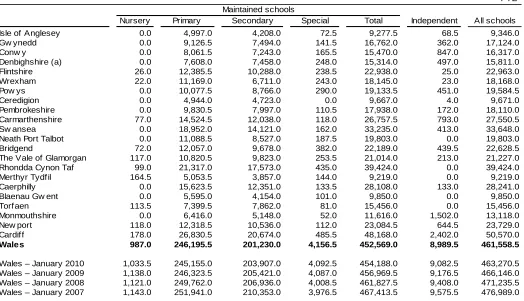
[image:7.595.32.556.433.734.2]Teachers and support staff
Here are the key points about teachers and support staff:
• The number of teachers in each local authority ranged between 3,270 in Cardiff, to 532 in Merthyr Tydfil. (Table 7)
• The number of full-time equivalent qualified teachers in schools was highest in Cardiff at 2,915.6 teachers, and lowest in Merthyr Tydfil at 503.8 teachers. (Table 8)
• Ceredigion had the lowest primary pupil teacher ratio at 17.5, and Torfaen had the highest at 23.1. The lowest secondary pupil teacher ratio was also in Ceredigion at 14.6, and the highest was also in Torfaen at 18.1. (Table 9)
• The pupil teacher ratio is highest in primary schools at 20.5 and lowest in special schools at 6.4. (Table 9) • The number of full-time equivalent support staff in schools was highest in Cardiff at 2,219.2 support
staff, and lowest in Merthyr Tydfil at 366.4 support staff. (Table 10)
• The introduction of the Foundation Phase and the Teacher Workload Agreement are the two main drivers behind the increase in support staff. (Table 10)
Table 7: Number of qualified teachers, by local authority, January 2011
Nursery Primary Secondary Special Total Independent All schools
Isle of Anglesey 0 280 272 14 566 9 575
Gw ynedd 0 522 528 26 1,076 59 1,135
Conw y 0 484 477 22 983 139 1,122
Denbighshire (a) 0 434 497 40 971 75 1,046
Flintshire 2 681 684 36 1,403 10 1,413
Wrexham 3 635 454 30 1,122 14 1,136
Pow ys 0 653 583 48 1,284 92 1,376
Ceredigion 0 332 343 0 675 3 678
Pembrokeshire 0 545 495 20 1,060 33 1,093
Carmarthenshire 5 856 800 23 1,684 109 1,793
Sw ansea 0 1,005 870 35 1,910 64 1,974
Neath Port Talbot 0 613 535 35 1,183 0 1,183
Bridgend 4 573 617 57 1,251 65 1,316
The Vale of Glamorgan 10 617 615 55 1,297 52 1,349
Rhondda Cynon Taf 9 1,020 1,082 57 2,168 0 2,168
Merthyr Tydf il 11 269 236 16 532 0 532
Caerphilly 0 752 754 22 1,528 17 1,545
Blaenau Gw ent 0 304 255 15 574 0 574
Torf aen 7 342 465 12 826 0 826
Monmouthshire 0 339 340 14 693 237 930
New port 6 642 653 20 1,321 62 1,383
Cardiff 15 1,501 1,380 105 3,001 269 3,270
Wales 72 13,399 12,935 702 27,108 1,309 28,417
Wales – January 2010 78 13,582 13,102 673 27,435 1,297 28,732
Wales – January 2009 82 13,726 13,219 675 27,702 1,267 28,969
Wales – January 2008 79 13,916 13,212 675 27,882 1,302 29,184
Wales – January 2007 90 14,064 13,381 659 28,194 1,241 29,435
Table 8: Full-time equivalent qualified teachers, by local authority, January 2011 (a)
FTE
Nursery Primary Secondary Special Total Independent All schools
Isle of Anglesey 0.0 257.0 258.0 12.2 527.2 5.9 533.1
Gw ynedd 0.0 462.0 484.8 26.0 972.8 51.8 1,024.6
Conw y 0.0 425.2 453.1 21.4 899.6 124.9 1,024.6
Denbighshire (a) 0.0 386.8 457.4 38.0 882.2 68.1 950.2
Flintshire 1.0 600.0 636.7 33.8 1,271.6 9.9 1,281.5
Wrexham 1.9 556.1 422.0 29.5 1,009.5 11.0 1,020.5
Pow ys 0.0 549.2 550.3 43.2 1,142.7 79.8 1,222.6
Ceredigion 0.0 283.1 322.9 0.0 606.0 3.0 609.0
Pembrokeshire 0.0 478.2 458.9 17.0 954.1 25.3 979.4
Carmarthenshire 5.0 760.6 745.6 22.6 1,533.8 89.2 1,623.0
Sw ansea 0.0 906.7 810.8 29.6 1,747.0 49.2 1,796.3
Neath Port Talbot 0.0 553.1 511.9 32.6 1,097.6 0.0 1,097.6
Bridgend 4.0 535.0 585.4 54.1 1,178.5 53.9 1,232.4
The Vale of Glamorgan 7.8 556.0 593.3 47.0 1,204.1 41.8 1,245.9
Rhondda Cynon Taf 8.1 958.6 1,032.0 54.2 2,052.9 0.0 2,052.9
Merthyr Tydf il 9.9 252.0 225.9 16.0 503.8 0.0 503.8
Caerphilly 0.0 686.2 701.6 19.8 1,407.6 10.2 1,417.7
Blaenau Gw ent 0.0 284.3 249.4 14.4 548.1 0.0 548.1
Torf aen 7.0 320.1 435.2 11.4 773.8 0.0 773.8
Monmouthshire 0.0 297.9 325.8 13.0 636.6 202.8 839.4
New port 5.0 583.1 614.9 17.6 1,220.6 59.1 1,279.7
Cardiff 13.0 1,307.5 1,268.9 94.8 2,684.2 231.4 2,915.6
Wales 62.7 11,998.7 12,144.7 648.2 24,854.4 1,117.3 25,971.7
Wales – January 2010 68.6 12,206.6 12,379.0 632.3 25,286.6 1,109.5 26,396.0 Wales – January 2009 73.9 12,342.5 12,515.0 630.6 25,562.0 1,097.2 26,659.2 Wales – January 2008 73.0 12,528.8 12,523.8 637.1 25,762.7 1,117.8 26,880.5 Wales – January 2007 76.8 12,648.4 12,663.2 624.3 26,012.6 1,053.1 27,065.7
Table 9: Pupil teacher ratios within schools, by local authority, January 2011 (a)
Nursery Primary Secondary Special Total Independent All schools
Isle of Anglesey . 19.4 16.3 5.9 17.6 11.6 17.5
Gw ynedd . 19.8 15.5 5.4 17.2 7.0 16.7
Conw y . 19.0 16.0 7.7 17.2 6.8 15.9
Denbighshire (a) . 19.7 16.3 6.5 17.4 7.3 16.6
Flintshire 26.4 20.6 16.2 7.0 18.0 2.5 17.9
Wrexham 11.4 20.1 15.9 8.2 18.0 2.1 17.8
Pow ys . 18.3 15.9 6.7 16.7 5.6 16.0
Ceredigion . 17.5 14.6 . 16.0 1.3 15.9
Pembrokeshire . 20.6 17.4 6.5 18.8 6.8 18.5
Carmarthenshire 15.4 19.1 16.1 5.2 17.4 8.9 17.0
Sw ansea . 20.9 17.4 5.5 19.0 8.4 18.7
Neath Port Talbot . 20.0 16.7 5.8 18.0 . 18.0
Bridgend 18.0 22.5 16.5 7.1 18.8 8.2 18.4
The Vale of Glamorgan 15.0 19.5 16.6 5.4 17.5 5.1 17.0
Rhondda Cynon Taf 12.3 22.2 17.0 8.0 19.2 . 19.2
Merthyr Tydf il 16.6 20.1 17.1 9.0 18.3 . 18.3
Caerphilly . 22.8 17.6 6.7 20.0 13.1 19.9
Blaenau Gw ent . 19.7 16.7 7.0 18.0 . 18.0
Torf aen 16.2 23.1 18.1 7.1 20.0 . 20.0
Monmouthshire . 21.5 15.8 4.0 18.2 7.4 15.6
New port 23.5 21.1 17.1 6.4 18.9 10.9 18.5
Cardiff 13.7 20.5 16.3 5.1 17.9 10.4 17.3
Wales 15.7 20.5 16.6 6.4 18.2 8.0 17.8
Wales – January 2010 15.1 20.1 16.5 6.5 18.0 8.2 17.6
Wales – January 2009 15.4 20.0 16.4 6.5 17.9 8.4 17.5
Wales – January 2008 15.4 19.9 16.5 6.3 17.9 8.4 17.5
Wales – January 2007 14.9 19.9 16.6 6.4 18.0 9.1 17.6
(a) St Brigids School has pupils and teachers of both primary and secondary level w ho are included in the appropriate columns. Maintained schools
Table 10: Full-time equivalent support staff, by local authority, January 2011 (a)
FTE
Nursery Primary Secondary Special Total
Isle of Anglesey 0.0 257.8 172.4 27.4 457.6
Gw ynedd 0.0 435.1 227.9 50.5 713.4
Conw y 0.0 342.6 211.7 51.1 605.4
Denbighshire (a) 0.0 421.4 245.1 89.4 755.9
Flintshire 2.2 684.9 292.2 127.7 1,107.0
Wrexham 7.0 623.8 242.2 94.9 967.9
Pow ys 0.0 510.1 285.3 110.9 906.3
Ceredigion 0.0 339.0 272.4 0.0 611.4
Pembrokeshire 0.0 679.0 347.6 67.9 1,094.5
Carmarthenshire 6.1 846.5 536.8 55.0 1,444.4
Sw ansea 0.0 1,025.2 576.2 85.5 1,686.8
Neath Port Talbot 0.0 543.8 211.3 80.1 835.2
Bridgend 8.1 626.8 216.4 137.5 988.7
The Vale of Glamorgan 14.1 474.4 274.0 154.3 916.7
Rhondda Cynon Taf 9.2 1,000.8 505.3 115.6 1,631.0
Merthyr Tydfil 14.8 239.7 68.9 43.0 366.4
Caerphilly 0.0 773.3 349.5 56.4 1,179.2
Blaenau Gw ent 0.0 282.8 121.3 52.2 456.3
Torfaen 17.2 400.2 241.6 44.9 703.9
Monmouthshire 0.0 366.5 179.8 27.8 574.1
New port 18.0 630.4 400.8 49.9 1,099.1
Cardif f 28.4 1,346.2 674.6 170.0 2,219.2
Wales 125.1 12,850.2 6,653.2 1,692.0 21,320.5
Wales – January 2010 119.6 12,263.7 6,525.8 1,500.6 20,409.7
Wales – January 2009 120.6 11,198.5 6,234.4 1,540.2 19,093.8
Wales – January 2008 103.4 9,466.1 5,893.5 1,482.6 16,945.6
Wales – January 2007 106.5 8,893.1 5,467.5 1,366.9 15,834.0
Free school meals
Here are the key points about free school meals:
• The number of pupils entitled to free meals has increased over the last 4 years, despite a fall in the number of pupils aged 5 to 15.
• Since 2008, the percentage of compulsory aged school pupils known to be eligible for free meals has increased year on year. This increase may be related to that seen in the number of claimants of
Jobseeker’s Allowance in Wales, which is one of the criteria for eligibility for free meals (more information can be seen in the Key Quality Information at the back of this release).
• The percentage of pupils known to be eligible for free meals was highest in special schools at 41.9 per cent. (Table 11)
Table 11: School meal arrangements in nursery, primary schools, secondary and special schools (a)
Number Percentage Number Percentage Number Percentage Number Percentage of pupils of pupils of pupils of pupils of pupils of pupils of pupils of pupils know n to be know n to be know n to be know n to be know n to be know n to be know n to be know n to be
eligible f or eligible f or eligible for eligible f or eligible f or eligible f or eligible for eligible f or f ree meals f ree meals f ree meals free meals f ree meals f ree meals f ree meals free meals All pupils:
2007 173 9.9 44,114 16.8 30,655 14.6 1,587 39.7
2008 155 8.7 42,281 16.2 29,408 14.2 1,588 39.3
2009 170 9.5 44,083 17.1 30,426 14.8 1,543 37.5
2010 159 9.5 47,212 18.3 31,737 15.6 1,641 39.9
2011 134 8.5 49,052 18.9 31,795 15.8 1,753 41.9
Pupils aged 5-15:
2007 . . 37,146 18.4 29,105 15.9 1,308 41.2
2008 . . 35,481 17.9 27,820 15.6 1,303 41.1
2009 . . 36,525 18.8 28,713 16.3 1,257 39.5
2010 . . 38,665 20.1 29,805 17.1 1,321 42.0
2011 . . 39,642 20.7 29,780 17.4 1,380 44.2
(a) At January each year.
Ethnicity
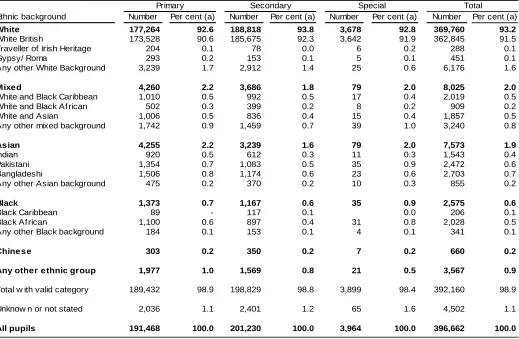
Here are the key points about ethnicity:
• Of the total number of pupils aged 5 or over at primary, secondary and special schools in Wales, over 9 in 10 pupils were classed as White British.
• The percentage of pupils whose ethnic background was classified as minority ethnic origin was slightly higher in primary schools than in secondary or special schools.
• Of the pupils whose ethnic background was classified as Black, almost 80 per cent of them were classified as Black African.
[image:12.595.35.554.320.659.2]• Of the pupils whose ethnic background was classified as Asian, 20 per cent of them were classified as Indian, 33 per cent as Pakistani, and 36 per cent as Bangladeshi. (Table 12)
Table 12: Number of pupils aged 5 or over, by ethnic background, January 2011
Ethnic background Number Per cent (a) Number Per cent (a) Number Per cent (a) Number Per cent (a)
White 177,264 92.6 188,818 93.8 3,678 92.8 369,760 93.2
White British 173,528 90.6 185,675 92.3 3,642 91.9 362,845 91.5
Traveller of Irish Heritage 204 0.1 78 0.0 6 0.2 288 0.1
Gypsy/ Roma 293 0.2 153 0.1 5 0.1 451 0.1
Any other White Background 3,239 1.7 2,912 1.4 25 0.6 6,176 1.6
Mixed 4,260 2.2 3,686 1.8 79 2.0 8,025 2.0
White and Black Caribbean 1,010 0.5 992 0.5 17 0.4 2,019 0.5
White and Black Af rican 502 0.3 399 0.2 8 0.2 909 0.2
White and Asian 1,006 0.5 836 0.4 15 0.4 1,857 0.5
Any other mixed background 1,742 0.9 1,459 0.7 39 1.0 3,240 0.8
Asian 4,255 2.2 3,239 1.6 79 2.0 7,573 1.9
Indian 920 0.5 612 0.3 11 0.3 1,543 0.4
Pakistani 1,354 0.7 1,083 0.5 35 0.9 2,472 0.6
Bangladeshi 1,506 0.8 1,174 0.6 23 0.6 2,703 0.7
Any other Asian background 475 0.2 370 0.2 10 0.3 855 0.2
Black 1,373 0.7 1,167 0.6 35 0.9 2,575 0.6
Black Caribbean 89 - 117 0.1 0.0 206 0.1
Black Af rican 1,100 0.6 897 0.4 31 0.8 2,028 0.5
Any other Black background 184 0.1 153 0.1 4 0.1 341 0.1
Chinese 303 0.2 350 0.2 7 0.2 660 0.2
Any other ethnic group 1,977 1.0 1,569 0.8 21 0.5 3,567 0.9
Total w ith valid category 189,432 98.9 198,829 98.8 3,899 98.4 392,160 98.9
Unknow n or not stated 2,036 1.1 2,401 1.2 65 1.6 4,502 1.1
All pupils 191,468 100.0 201,230 100.0 3,964 100.0 396,662 100.0
(a) Of all pupils aged 5 or over.
Pupils with special educational needs (SEN)
Here are the key points about special educational needs:
• 15.5 per cent of pupils at independent schools have some form of special educational need; almost a third of these pupils with SEN have statements of SEN. Of the pupils with statements of special educational needs, around 30 per cent had behavioural, emotional and social difficulties as their major need, 20 per cent of pupils had autistic spectrum disorders and 20 per cent of pupils had specific learning difficulties as their major need. (Table 13)
• Just over 20 per cent of all pupils at primary, secondary and special schools in Wales have some form of special educational need; 13.4 per cent of the pupils with special educational needs have statements of SEN. (Table 14)
• 21.2 per cent of pupils at primary schools have some form of special educational need; 7.5 per cent of these pupils with SEN have statements of SEN. Of the pupilswith special educational needs, the most common major need was moderate learning difficulties, representing nearly 50 per cent of pupils with some form of SEN. (Table 14)
• 20.3 per cent of pupils at secondary schools have some form of special educational need; 13.0 per cent of these pupils with SEN have statements of SEN. Of the pupils with special educational needs, the most common major need was moderate learning difficulties, representing around 40 per cent of all pupils with some form of SEN. (Table 14)
[image:13.595.37.553.514.720.2]• All pupils at special schools have some form of special educational need; 95.3 per cent of these pupils with SEN have statements of SEN. Of the pupilswith special educational needs, the most common major need was severe learning difficulties, representing over 30 per cent of all pupils with some form of SEN. (Table 14)
Table 13: Pupils with special educational needs in independent schools, by major need, January 2011
Inci
Number %
Pupils w ith a statem ent of special need:
dence (a)
Moderate learning dif ficulties 19 0.2
Severe learning diff iculties 21 0.2
Prof ound & multiple learning diff iculties 2
-Specific learning dif f iculties 91 1.0
Autistic Spectrum Disorders 87 1.0
Physical and medical dif ficulties 59 0.6
Hearing impairment 1
-Visual impairment 1
-Multiple sensory impairment 0 0.0
Speech, language & communication dif ficulties 40 0.4
Behavioural, emotional and social diff iculties 125 1.4
4.9
10.6
Total 446
Pupils w ith special educational needs but no statement 964
Total pupils on roll in independent schools (headcount) 9,088
Incidence Placement Incidence Placement Incidence Placement Incidence Placement
Number % (a) % (b) Number % (a) % (b) Number % (a) % (b) Number % (a) % (b)
Pupils w ith a statem ent of special educational need:
Moderate learning diff iculties 652 0.3 4.9 1,171 0.6 8.7 499 11.9 3.7 2,322 0.5 17.3
Severe learning dif ficulties 271 0.1 2.0 267 0.1 2.0 1,259 30.1 9.4 1,797 0.4 13.4
Prof ound & multiple learning dif ficulties 127 - 0.9 72 - 0.5 437 10.5 3.3 636 0.1 4.7
Specific learning diff iculties 196 0.1 1.5 727 0.4 5.4 43 1.0 0.3 966 0.2 7.2
Autistic Spectrum Disorders 702 0.3 5.2 796 0.4 5.9 828 19.8 6.2 2,326 0.5 17.4
Physical and medical dif ficulties 516 0.2 3.9 460 0.2 3.4 217 5.2 1.6 1,193 0.3 8.9
Hearing impairment 178 0.1 1.3 141 0.1 1.1 14 0.3 0.1 333 0.1 2.5
Visual impairment 80 - 0.6 104 0.1 0.8 14 0.3 0.1 198 - 1.5
Multiple sensory impairment 9 - 0.1 6 - - 9 0.2 0.1 24 - 0.2
Speech, language & communication dif f iculties 984 0.4 7.3 794 0.4 5.9 185 4.4 1.4 1,963 0.4 14.7
Behavioural, emotional and social dif f iculties 403 0.2 3.0 752 0.4 5.6 480 11.5 3.6 1,635 0.4 12.2
Total 4,118 1.6 30.7 5,290 2.6 39.5 3,985 95.3 29.8 13,393 2.9 100.0
Pupils w ith a special
educational need but no statem ent:
Moderate learning diff iculties 25,715 9.9 29.8 16,433 8.2 19.0 28 0.7 - 42,176 9.0 48.8
Severe learning dif ficulties 416 0.2 0.5 160 0.1 0.2 46 1.1 0.1 622 0.1 0.7
Prof ound & multiple learning dif ficulties 42 - - 11 - - 14 0.3 - 67 - 0.1
Specific learning diff iculties 6,985 2.7 8.1 8,701 4.3 10.1 1 - - 15,687 3.4 18.2
Autistic Spectrum Disorders 587 0.2 0.7 503 0.2 0.6 29 0.7 - 1,119 0.2 1.3
Physical and medical dif ficulties 1,581 0.6 1.8 1,300 0.6 1.5 8 0.2 - 2,889 0.6 3.3
Hearing impairment 755 0.3 0.9 619 0.3 0.7 1 - - 1,375 0.3 1.6
Visual impairment 351 0.1 0.4 259 0.1 0.3 0 0.0 0.0 610 0.1 0.7
Multiple sensory impairment 18 - - 19 - - 3 0.1 - 40 -
-Speech, language & communication dif f iculties 8,655 3.3 10.0 1,535 0.8 1.8 19 0.5 - 10,209 2.2 11.8
Behavioural, emotional and social dif f iculties 5,603 2.2 6.5 5,937 3.0 6.9 47 1.1 0.1 11,587 2.5 13.4
Total 50,708 19.6 58.7 35,477 17.6 41.1 196 4.7 0.2 86,381 18.5 100.0
All pupils w ith special educational needs:
Moderate learning diff iculties 26,367 10.2 26.4 17,604 8.7 17.6 527 12.6 0.5 44,498 9.5 44.6
Severe learning dif ficulties 687 0.3 0.7 427 0.2 0.4 1,305 31.2 1.3 2,419 0.5 2.4
Prof ound & multiple learning dif ficulties 169 0.1 0.2 83 - 0.1 451 10.8 0.5 703 0.2 0.7
Specific learning diff iculties 7,181 2.8 7.2 9,428 4.7 9.4 44 1.1 - 16,653 3.6 16.7
Autistic Spectrum Disorders 1,289 0.5 1.3 1,299 0.6 1.3 857 20.5 0.9 3,445 0.7 3.5
Physical and medical dif ficulties 2,097 0.8 2.1 1,760 0.9 1.8 225 5.4 0.2 4,082 0.9 4.1
Hearing impairment 933 0.4 0.9 760 0.4 0.8 15 0.4 - 1,708 0.4 1.7
Visual impairment 431 0.2 0.4 363 0.2 0.4 14 0.3 - 808 0.2 0.8
Multiple sensory impairment 27 - - 25 - - 12 0.3 - 64 - 0.1
Speech, language & communication dif f iculties 9,639 3.7 9.7 2,329 1.2 2.3 204 4.9 0.2 12,172 2.6 12.2
Behavioural, emotional and social dif f iculties 6,006 2.3 6.0 6,689 3.3 6.7 527 12.6 0.5 13,222 2.8 13.3
Total 54,826 21.2 54.9 40,767 20.3 40.9 4,181 100.0 4.2 99,774 21.4 100.0
Total pupils on roll 259,189 201,230 4,181 464,600
[image:14.595.31.797.46.520.2]Primary Secondary Special Total
Appendix I: Pupil Projections
These projections are based on the school population of Wales at January 2011 and the trends indicated by the 2008 based mid-year projection of the home population of Wales produced by the Government
Actuary's Department.
To calculate the school projections, it is assumed that the participation rates of all age groups and types of school will each remain constant. These projections do not allow for changes in pre and post compulsory school age participation or for the changes in the proportions attending special or independent schools.
Number of full-time equivalent pupils (a)
Thousands
Actual
2010/11 2011/12 2012/13 2013/14 2014/15 2019/20
Maintained nursery: 1.0 1.0 1.0 1.0 1.0 1.0
Maintained primary:
Aged under 5 54.7 56.1 57.2 56.7 56.6 57.4
Aged 5 and over 191.5 192.6 195.0 199.9 203.7 210.6
Maintained secondary:
Under school leaving age 171.1 168.2 164.9 160.4 157.6 166.4
Over school leaving age 30.1 29.4 29.1 29.1 28.6 25.7
Maintained nursery, primary and secondary, all ages 448.4 447.3 447.2 447.0 447.5 461.1
Maintained special, all ages 4.2 4.1 4.1 4.0 4.0 4.1
Independent, all ages 9.0 8.9 8.8 8.8 8.7 8.8
All schools (including maintained special schools and independent schools):
Aged under 5 56.6 58.1 59.1 58.6 58.5 59.4
Compulsory school age 372.3 370.4 369.4 369.6 370.7 386.8
Over school leaving age 32.7 31.9 31.6 31.6 31.1 27.9
All ages 461.6 460.4 460.1 459.8 460.2 474.1
(a)
Projection
Notes
1. Context
1.1 Policy/Operational
Schools’ data are derived from the Pupil Level Annual School Census (PLASC) returns and STATS 1 returns supplied by schools open on Census day in January each year. The returns are authorised by headteachers and validated by local authorities (LAs). PLASC was introduced as part of the Welsh Government’s Information Management Strategy which aims to reduce administrative burdens and improve access to high quality management information through the collection of individual level data, in electronic format so that it can be shared and used many times to meet multiple needs.
1.2 Related Publications
The Welsh Government also releases teacher data from a different source (the STATS 3 return) in the form of a Statistical First Release:
Teachers in service, vacancies and sickness absence: January 2011, published on 16 June 2011.
Since the above release is from a different source, figures may not match, and therefore caution should be taken when making comparisons.
Attached is the latest available release for England, published on 22 June 2011: Schools, Pupils and their Characteristics, January 2011
Scotland publishes some data on pupils as part of a larger publication on schools. Their latest release was published on 1 December 2010 (revised on 13 June 2011):
Summary Statistics for Schools in Scotland, No.1 2010 Edition
Scotland also publishes some data on school meals as part of a different publication. Their latest release was published on 27 June 2011:
Summary statistics for attainment, leaver destinations and school meals, No. 1: 2011 Edition The latest available release for Northern Ireland, published on 25 March 2011, can be found here: Enrolments at schools and in funded pre-school education in Northern Ireland 2010/11 (revised)
2. Data sources
Pupil Level Annual School Census (PLASC) / School Census (STATS 1 Return)
PLASC is an electronic collection of pupil and school level data provided by all maintained sector primary, secondary, nursery and special schools in January each year. Schools record data on pupils and the school throughout the year in their Management Information System (MIS) software. This data is collated into an electronic PLASC return and submitted to the Welsh Government through DEWi, a secure online data transfer system developed by the Welsh Government.
From January 1994 independent schools in Wales complete a STATS 1 return which replaced Form 101A (school census return for independent schools prior to January 1994).
Special Education Provision (STATS 2)
In addition to information gathered on the PLASC returns on pupils in special and ordinary maintained schools who receive special education, each local authority completes an annual return (in January) relating to those children for whom it is responsible. It records the number of children for whom the authority maintains a statement of special educational needs as well as the kind of provision made for them, whether within the authority's area or elsewhere. In addition it also records those assessed during the previous calendar year and the number of statements issued as a result of those assessments.
Teachers employed by LAs (STATS 3)
transferred out of LA control in April 1992, while the further education institutions transferred in 1993. The teachers at these institutions no longer count as in service with the LAs). As a result the numbers are larger than those recorded on the PLASC returns where only teachers in post within schools are covered. This overall total is used to calculate the pupil teacher ratio overall shown in Table 1.3 which differs from that in Table 1.1.
3. Definitions
3.1 Coverage
The data in this release relates to all maintained and independent schools in Wales. Figures for local authorities do not include independent schools.
3.2 Glossary of terms used in both the release and the data files
Absenteeism - Pupil level absence data was collected from maintained primary and secondary schools for
the first time in 2007/08. Primary and secondary absenteeism data from special and independent schools are obtained from two annual surveys undertaken by the Welsh Government. The absence data relate to those pupils of statutory school age (5-15 at the start of the academic year) from the beginning of the academic year to the late May Bank Holiday for the secondary sector and for the whole academic year for the primary sector.
Overall absences comprise those which are authorised and unauthorised:
• An authorised absence is an absence with permission from a teacher or other authorised
representative of the school. This includes instances of absence for which satisfactory explanation has been provided (e.g. illness, family bereavement, religious observance, or foot and mouth disease restrictions in 2000/01).
• An unauthorised absence is an absence without permission from a teacher or other authorised representative of the school. This includes all unexplained or unjustified absences.
Note that pupils undertaking approved and supervised educational activities conducted away from the school (e.g. work experience or educational visits) are deemed to be present at the school.
Age of pupils - Throughout this release pupils' ages are quoted as at 31 August. This refers to the start of
the academic year and is a useful reference in that pupils normally transfer from maintained primary to secondary school, and move thereafter through the secondary school system, according to their age on 31 August. The statutory school leaving age is also in part related to the same definition. In addition, Section 2 contains some tables with numbers of children with ages at 31 December - for further details see ‘Under 5s’.
Average class size - This is derived from data collected on the schools census return and is calculated as
follows:
i.
in primary schools: the number of pupils in all registered classes divided by the total number of classes (nursery, ordinary, mixed and special classes) on the day of enumeration. Where a class has both full-time and part-full-time morning and afternoon pupils the size of the class is the number of full-full-time pupils plus either the morning or afternoon part-time pupils whichever is the greater.ii.
in secondary schools: the total number of pupils divided by the total number of classes. Both thenumber of pupils and classes refer to a specific period in the school timetable on the day of enumeration.
Compulsory school age -
The compulsory school age means any age between 5 and 16 years. Section 35 ofi.
a child whose 16th birthday falls in the period 1 September to 31 January inclusive may leave at the end of the Spring term (i.e. the following Easter).ii.
a child whose 16th birthday falls in the period 1 February to 31 August may leave on the Friday before
the last Monday in May.
iii.
Under section 8(4) of the Education Act 1996 a new single school leaving date was set for 1998 and allsubsequent years. This is the last Friday in June in the school year in which the child reaches age 16.
English as an Additional Language (EAL) - Details of pupils’ stages of EAL are surveyed annually by
specialist Ethnic Minority Achievement Services (EMAS) or EAL services within local authorities. Pupils learning EAL in schools, including those who are in receipt of support by the specialist EMAS or EAL Services, are categorised “A” to “E”. Pupils make progress in acquiring English as an additional language in different ways and at different rates. Progression from stage A to stage E can take up to 10 years and individuals are likely to show characteristics of more than one ‘stage’ at a time. A judgement is usually needed over which stage best describes an individual’s language development, taking into account age, ability and length of time learning English.
Please note that this data item is not intended to capture English fluency levels for Welsh first language speakers, but rather to identify the English language proficiency for additional language learners whose first languages are neither English nor Welsh.
Exclusions -
The data on exclusions are collected from LAs throughout the year on the ExclusionsMonitoring Forms. Exclusions relate to occurrences rather than pupils, i.e. a pupil excluded from two schools within a year would be recorded twice.
Foundation Phase - The Foundation Phase is a new approach to learning for children from 3-7 years of age.
It combines what we currently call Early Years Education (for 3 to 5-year-olds) and Key Stage 1 (5 to 7-year-olds) of the National Curriculum.
The Foundation Phase will be implemented over four years as follows:
1 September 2008 for all 3 to 4-year-olds in the Foundation Phase; 1 September 2009 for all 4 to 5-year-olds in the Foundation Phase; 1 September 2010 for all 5 to 6-year-olds in the Foundation Phase; 1 September 2011 for all 6 to 7-year-olds in the Foundation Phase. From these dates, the existing National Curriculum for Key Stage 1 is superseded.
Free meals - Under Section 512 of the Education Act 1996, as amended by Section 116 of the School
Standards and Framework Act 1998, LAs have a duty to provide free school meals to pupils entitled to free school meals if their families receive Income Support or Income Based Jobseeker’s Allowance or Support under Part VI of the Immigration and Asylum Act 1999 or the guarantee element of State Pension Credit. They are also eligible if their parents are in receipt of Income Related Employment and Support Allowance (IR). Employment and Support Allowance is an integrated contributory and income related allowance and replaced, for new claimants, Incapacity and Income Support, where it is paid on the grounds of incapacity and sickness. Children who receive Income Support or Income Based Jobseeker’s Allowance in their own right are also eligible to receive free school meals. Children whose families are in receipt of Child Tax Credit, providing they are not entitled to Working Tax Credit, and have an annual income, as assessed by HM Revenue & Customs that does not exceed £16,190 are also eligible for free school meals.
Free milk - Under Section 512 of the Education Act 1996, as amended by Section 116 of the School
Free School Breakfast Initiative - The overall aim of this initiative is to provide all pupils registered in primary schools in Wales, including those of primary age in special schools, with the opportunity of receiving a free healthy breakfast at school each day during the school week. The school breakfasts are optional; their principal focus is for those children who, for whatever reason, do not have this opportunity to have breakfast.
Full-time equivalent (FTE) -
i.
of pupils: each part-time pupil is counted as half of a pupilii.
of teachers/support staff: the full-time equivalent of part-time teachers/support staff expresses the teachers'/support staff service in hours as a proportion of a school week, normally 32.5 hours for maintained schools and 26 hours for independent schools.Governors - The figures come from the Schools’ Census. For the years prior to 1999/00 an element of
double counting is included. Where schools shared the same governing body the governors of the body were counted in every school of the group. Since January 2000 in accordance with the Schools Standard and Framework Act 1998, grouped governing bodies are not permitted. Information for special schools was collected for the first time in January 2001.
Grant maintained schools - Those schools which had attained grant maintained (GM) status as established
in the Education Reform Act, 1988 operated as charitable trusts, funded directly by the Welsh Government (formerly the Welsh Office). Grant maintained schools were recategorised following the introduction of a new school framework consisting of four categories: community, voluntary aided, voluntary controlled and foundation by the School Standards and Framework Act 1998. All maintained schools (including GM schools) were recategorised from 1 September 1999.
Independent schools - Schools which charge fees and may also be financed by individuals, companies or
charitable institutions. All independent schools in Wales have to register with the Welsh Government (formerly the Welsh Office).
Key Stages - The National Curriculum is applied to 4 key stages of pupil development. Broadly these are:
Pupils ages Year groups
Key Stage 1 5-7 1-2
Key Stage 2 7-11 3-6
Key Stage 3 11-14 7-9
Key Stage 4 14-16 10-11
Regular and systematic assessment of a pupil’s on-going progress throughout compulsory schooling is an essential complement to the National Curriculum.
LA maintained schools - Schools maintained by the local authorities. The authorities meet their
expenditure partly from council tax and partly from general grants made by the Welsh Government (formerly the Welsh Office). From 1 September 1999, all previous categories of school were replaced by four new categories (community, voluntary aided, voluntary controlled and foundation).
Nursery schools - Schools providing education primarily for children below compulsory school age
(i.e. under 5) on either a part-time or full-time basis.
Primary schools - Comprises 3 types of school: infants’ for children aged 5 to 7, junior for those aged 7 to 11
and combined junior and infants’ for both age groups. Many primary schools also provide nursery classes for children aged under 5.
Pupil Adult Ratio (PAR) - The pupil adult ratio is calculated by dividing the FTE of pupils on roll in
Pupil Support Staff Ratio - The pupil support staff ratio is calculated by dividing the FTE of pupils on roll in schools by the FTE of support staff employed in schools, excluding administrative staff.
Pupil Teacher Ratios (PTR) - The pupil teacher ratio is calculated by dividing the FTE of pupils on roll in
schools by the FTE of qualified teachers (Headteachers, Deputy Heads and other qualified teachers). There are 2 sources of information on the size of the teaching force and therefore 2 bases upon which PTRs may be calculated. The ratios are referred to as "PTR within schools" and "Overall PTR".
i. PTR within schools: The teacher count is derived from the school census return. The figures include any teachers temporarily absent, supply and relief teachers filling vacant posts, but exclude unfilled
vacancies. Teachers absent for long periods or seconded for other duties are excluded but their
replacements included. When calculating the PTR within schools, the number of teachers relates only to FTE qualified teachers on the establishment of the school.
ii. Overall PTR: The teacher count is derived from the STATS 3 return completed by each LA and grant maintained (GM) school. The figures derived from these forms are necessarily higher than those from the school census return as the STATS 3 forms cover those teachers on secondment, absent from school for long periods (together with those who are employed as supply teachers to temporarily replace them), peripatetic teachers, unqualified instructors and student teachers. The overall PTR derived using these teacher numbers is therefore lower than the PTR within schools which relates solely to qualified teachers on the school establishment. The overall PTR is largely used in a financial context.
Pupil Referral Units (PRUs) - Section 19 (1) of the Education Act 1996 requires LAs to make arrangements
for the provision of suitable education at schools or otherwise for children of compulsory school age who, for whatever reason of illness, exclusion from school or otherwise, may not for any period receive suitable education unless suitable arrangements are made for them. Section 19 (2) states that any school established to provide education for such children and which is not a county [community] or special school, shall be known as a “Pupil Referral Unit”.
Pupils present - This is derived from data collected on the schools census return.
i.
for full-time pupils in maintained schools: the number of pupils in attendance on the morning of the enumeration day.ii.
for part-time pupils in maintained schools: the number of pupils in attendance either on the morning or afternoon of the enumeration day.For maintained nursery, primary and special schools the sum of the full-time and part-time pupils in attendance are counted as pupils present.
Pupils with Special Educational Needs (SEN) - A child has special needs if he or she has learning
difficulties which requires special educational provision to be made for him or her. A learning difficulty means that the child has significantly greater difficulty in learning than most children of the same age or that the child has a disability that needs different educational facilities from those that the school generally provides for children. Pupils with SEN may have statements issued by the LA or may have their needs identified by the school. In the latter case they come under one of two further categories: School Action or School Action Plus.
i. Pupils with statements: Pupils for whom the LA maintains a statement of SEN under Part IV of the Education Act 1996. A statement may be issued by the LA after assessment of a child’s needs.
ii. School Action: When a class or subject teacher identifies that a pupil has SEN they provide interventions that are additional to or different from those provided as part of the school’s usual curriculum.
Secondary schools - These take pupils at 11 years old until statutory school leaving age and beyond. A school is classified as comprehensive when its admission arrangements are without reference to ability. Sixth form colleges are recorded for statistical purposes as “other” secondary schools up until April 1993 when they transferred from the LAs to the further education sector.
Sixth Form colleges - These left LA control and transferred to the further education sector in April 1993.
Since November 1994, they are referred to as Further Education Institutions (FEIs).
Special schools - Special schools, both day and boarding, provide education for children with SEN who
cannot be educated satisfactorily in ordinary schools. Maintained special schools are provided and run by LAs. In addition to special schools provision is made for pupils with SEN to attend special classes at mainstream schools. Some independent schools also provide education wholly or mainly for such pupils. The pupils and schools involved are not included with special schools but are included with mainstream or independent schools in the tables of this release.
Staying-on rates - These rates apply solely to the school population. They express the numbers of pupils
aged 16, 17 and 18 and over (at the start of the academic year) staying on in school voluntarily after
reaching the statutory school leaving age as percentages of each cohort 1, 2 or 3 years earlier. In areas of net inward migration of population such percentages may be inflated while net outward migration may lead to the percentages being understated. More importantly however is the increasing tendency in recent years for some pupils to go to further education to follow GCE courses and for some LAs to provide post-16 education in FEIs. For these reasons staying-on rates should be studied in conjunction with participation rates.
Teachers in schools - The figures for teachers, which are derived from the school census return, submitted
by individual schools at the same time as the counts of pupils, refer to qualified teachers only, in post at the date of the census, including staff temporarily absent, supply and relief teachers filling vacant posts, but excluding unfilled vacancies:
i. Qualified teachers are mainly those who have satisfactorily completed an approved course or who are in possession of certain acceptable qualifications.
ii. Other teaching staff includes:
• Student teachers (persons over the age of 18 who intend to proceed to training for qualified teacher status);
• Instructors (persons who have not obtained qualified teacher status but who are employed to give instruction in a specialist skill);
• Language assistants (foreign students on exchange schemes or persons resident in this country whose mother tongue is a foreign language and who are employed to give conversational lessons in this language);
• Unqualified teachers (persons whose appointment to the assistant staff of a nursery school or to the staff of a nursery class has been approved under Regulation 16(3)(c) of the Schools Regulations 1959).
Teachers in service - Information on teachers in service derives from an annual return (STATS 3) which
collects data on the total teaching force on the payroll of LAs in Wales. This data covers a wider population of teachers than those “within schools”.
Teachers on the payroll of LAs include:
• full-time teachers in regular service including those on secondment; • FTE of part-time teachers in regular service;
Other teachers include:
• full-time teachers in regular service including those on secondment; • FTE of part-time teachers in regular service;
• full-time teachers in occasional service including agency staff from January 1998; • FTE of licensed teachers and instructors.
Adult Education centres include:
• full-time teachers in regular service including those on secondment; • FTE of part-time teachers in regular service;
• FTE of hourly paid part-time teachers;
• FTE of all staff not paid on Burnham scales but who spend all or part of their time teaching.
Under 5s - Provision for under 5s is covered in section 2 where some tables show the estimated number of
pupils aged at 31 December, not as at 31 August, the date used throughout the rest of the publication. The attendance at schools of children under the age of 5 is voluntary and can be on a full-time or part-time basis.
Voluntary schools - These are established by voluntary bodies, mainly the religious denominations, but are
maintained by the LAs. The admission authority of a voluntary aided school is the governing body; in the case of a voluntary controlled school it is the LA.
Welsh Medium Schools - From 2008/09 primary and secondary schools were asked to report their Welsh
Medium Type, using the guidance in the Welsh Government’s information document 023-2007: ‘Defining schools according to Welsh medium provision’
See http://wales.gov.uk/topics/educationandskills/publications/guidance/definingschools?lang=en
i. Welsh medium primary schools
From January 2009, primary schools reporting the categories of Welsh Medium and Dual Stream have been shown as Welsh medium schools in this statistical release.
The methods of classification applied in previous years are detailed below:
From January 1995 – January 2008 the classification method described schools as:
Category A: if the school contains classes where Welsh is the main medium and if at least half pupils are in such classes;
Category B: either the school contains a class/classes where Welsh is the main medium but fewer than half the pupils are in such classes, or the school contains a class/classes where Welsh is used as a medium for teaching part of the curriculum.
For January 1994 and earlier the method described schools as:
Category A: either the school contained only classes taught mainly in Welsh, or the school contained classes taught mainly in Welsh but also had classes with Welsh taught as a second language or not taught at all.
Category B: either the school contained no classes taught mainly in Welsh but had classes taught partly in Welsh, or the school contained both such type of class and no other types of class.
ii. Welsh medium secondary schools
For January 2010, secondary schools reporting categories of Welsh Medium and Bilingual have been shown as Welsh medium schools in this statistical release.
Prior to 2010, Welsh medium secondary schools were defined as in the Education Act 2002, Section 105(7), if more than one half of the following subjects, namely religious education and the subjects (excluding English and Welsh) which are foundation subjects, are taught wholly or partly in Welsh:
Mathematics Technology Religious Education
Science Music Modern Foreign Languages
History Art
Geography Physical Education
Year groups - The National Curriculum year groups are as follows:-
Primary Secondary
Form . . . . . . 1 2 3 4 5 L6 U6
Year Group 1 2 3 4 5 6 7 8 9 10 11 12 13
Average age at the preceding August 5 6 7 8 9 10 11 12 13 14 15 16 17
4. Rounding and symbols
In tables where figures have been rounded to the nearest final digit, there may be an apparent discrepancy between the sum of the constituent items and the total shown.
The following symbols have been used throughout the publication: - percentages less than 0.05 but not zero
. not applicable .. not available ~ not yet available
* figure is less than 5, or is based on a figure less than 5.
5. Key Quality Information
This section provides a summary of information on this output against five dimensions of quality: Relevance, Accuracy, Timeliness and Punctuality, Accessibility and Clarity, and Comparability. It also covers specific issues relating to quality of 2011 data, and describes the quality management tool applied to this area of work. Between September and November 2010 we conducted a public consultation on our Education Statistics outputs, in which we asked for feedback on the quality of the outputs. A summary of responses has been published and is available here:
http://wales.gov.uk/consultations/statistics/education/?lang=en
5.1 Relevance
The statistics are used both within and outside the Welsh Government to monitor educational trends and as a baseline for further analysis of the underlying data. Some of the key users are:
• Ministers and the Members Research Service in the National Assembly for Wales; • The Department for Education and Skills in the Welsh Government;
[image:23.595.29.539.258.348.2]These statistics are used in a variety of ways. Some examples of these are: • General background and research;
• Inclusions in reports and briefings; • Advice to Ministers;
• The all-Wales education core data packs (the replacement for the National Pupil Database); • LA and school comparisons and benchmarks;
• To inform the education policy decision-making process in Wales including school reorganisation; • Development of a national banding system for Wales;
• To inform ESTYN during school inspections;
• The education domain of the Welsh Index of Multiple Deprivation; • To assist in research in educational attainment.
5.2 Accuracy
The Welsh Government works closely with schools and LAs in order to ensure all data are validated before tables are published. Data is collated into an electronic return and submitted to the Welsh Government through DEWi, a secure online data transfer system developed by the Welsh Government. Various stages of automated validation and sense-checking are built into the process to ensure a high quality of data.
5.3 Timeliness and Punctuality
DEWi was available for uploading files on 18 January 2011, with schools asked to submit data for every pupil on roll at the school on 18 January. Schools and LAs were then asked to validate their data within the validation period, which closed on 6 June.
5.4 Accessibilty and Clarity
This Statistical First Release is pre-announced and then published on the Statistics section of the Welsh Government website. It is accompanied by more detailed tables on StatsWales, a free to use service that allows visitors to view, manipulate, create and download data.
5.5 Comparability
This release shows final data at Wales and LA level for 2007– 2011 and updates the provisional figures previously released on 6 July 2011. After further validation, there are very small changes to the overall pupil numbers (in Carmarthenshire and Caerphilly), with the Wales total being revised to 466,172 (4 fewer than the provisional figure). Tables affected by this change were Tables 2, 3, 4, 5, 6, 9, 11, 12 and 14.
Also, one LA incorrectly coded their SEN pupils, and therefore Table 13 has now been revised.