Open Access
Research article
Birthweight, parental age, birth order and breast cancer risk in
African-American and white women: a population-based case–
control study
M Elizabeth Hodgson
1, Beth Newman
2and Robert C Millikan
31Department of Epidemiology, School of Public Health, University of North Carolina at Chapel Hill, Chapel Hill, North Carolina, USA 2School of Public Health, Queensland University of Technology, Kelvin Grove, Queensland, Australia
3Department of Epidemiology, School of Public Health, and Lineberger Comprehensive Cancer Center, School of Medicine, University of North Carolina, Chapel Hill, North Carolina, USA
Corresponding author: M Elizabeth Hodgson, ehodgson@email.unc.edu
Received: 28 Apr 2004 Revisions requested: 1 Jun 2004 Revisions received: 8 Jul 2004 Accepted: 9 Aug 2004 Published: 22 Sep 2004
Breast Cancer Res 2004, 6:R656-R667 (DOI 10.1186/bcr931)http://breast-cancer-research.com/content/6/6/R656 © 2004 Hodgson et al., licensee BioMed Central Ltd.
This is an Open Access article distributed under the terms of the Creative Commons Attribution License (http://creativecommons.org/licenses/by/ 2.0), which permits unrestricted use, distribution, and reproduction in any medium, provided the original work is cited.
Abstract
Introduction Much recent work has focused on hypotheses that very early life exposures influence adult cancer risk. For breast cancer it has been hypothesized that high in utero estrogen exposure may increase risk.
Methods We used data from the Carolina Breast Cancer Study, a population-based case–control study of incident breast cancer in North Carolina, to examine associations for three possible surrogates of high prenatal estrogen exposure: weight at birth, maternal age, and birth order. We also examined paternal age. Birthweight analyses were conducted for white and African-American women born in North Carolina on or after 1949 (196 cases, 167 controls). Maternal age was analyzed for US born participants younger than 49 years of age (280 cases, 236 controls).
Results There was a weak inverse association between birthweight in the highest tertile and breast cancer overall (odds ratio [OR] 0.7, 95% confidence interval [CI] 0.4–1.2), although associations differed by race (OR 0.5, 95% CI 0.2–1.0, and OR
1.0, 95% CI 0.5–2.1 for African-American and white women, respectively). For maternal age there was an approximately threefold increase in risk in women whose mothers were older than 22 years of age, relative to 19–22 years of age, when the women were born. After adjustment for maternal age, older paternal age increased risk in the oldest and youngest age categories (relative to 23–27 years of age at the woman's birth: OR 1.6, 95% CI 0.8–3.1 for age 15–22 years; OR 1.2, 95% CI 0.7–2.2 for age 28–34 years; and OR 1.5, 95% CI 0.7–3.2 for age 35–56 years). There was no association with older paternal age for white women alone. After adjustment for maternal age (265 cases, 224 controls), a birth order of fifth or higher relative to first had an inverse association with breast cancer for women younger than 49 years old (OR 0.6, 95% CI 0.3–1.3).
Conclusion Although the CIs are wide, these results lend support to the possibility that the prenatal period is important for subsequent breast cancer risk, but they do not support the estrogen hypothesis as a unifying theory for the influence of this period.
Keywords: African-American, birthweight, breast cancer, maternal age, prenatal
Introduction
Recent epidemiologic studies have investigated the possi-bility that very early life exposures increase adult cancer risk. Trichopoulos [1] postulated that a highly estrogenic intrauterine environment would create a 'fertile soil' for car-cinogenesis in breast tissue and lead to higher risk for breast cancer later in life. Because retrospective prenatal hormone measurements cannot be obtained for large num-bers of people, he and others proposed that birth and maternal characteristics be investigated as surrogates for a
highly estrogenic intrauterine environment. These birth characteristics include high birthweight, maternal age 20– 24 years at birth, and low birth rank. Much work during the past decade has been done on birthweight in particular. There is an apparent modest positive association between high birthweight and breast cancer that is stronger in younger women, which is consistent with the estrogen hypothesis. Data on other surrogates of intrauterine estro-gen levels have been less consistent [2].
R657
Despite an overall higher incidence of breast cancer in white women, incidence and mortality rates are higher in young African-American women than in young white women [3,4]. This crossover in incidence rates, occurring at about age 40 years for women diagnosed between 1950 and 1969, was documented in the Third National Cancer Survey [4]; SEER (Surveillance, Epidemiology and End Results) data from 1997 document a shift in the cross-over to approximately 45 years of age [3]. Consequently, it is important to investigate relationships between putative causes of breast cancer and breast cancer incidence in younger African-American women. To our knowledge no studies published to date have specifically addressed the relationships between prenatal or birth characteristics and breast cancer in African-American women.
The goal of this study was to characterize the relationships of birthweight, maternal age, paternal age, and birth order with breast cancer in African-American and white women in a population-based study. We analyzed data from a subset of women participating in the Carolina Breast Cancer Study (CBCS) [5], a population-based case–control study that over-sampled younger women and African-American women.
Methods
Study design and supplemental data collection
The CBCS (phase I) is a population-based, case–control study of incident invasive breast cancer conducted between May 1993 and December 1996 in 24 counties of central and eastern North Carolina [5]. Participants gave informed consent using forms approved by the Institutional Review Board of the University of North Carolina School of Medicine, which were in compliance with the Helsinki Dec-laration. Cases (n = 861) were women aged 18–74 years, who were mentally competent and resident in the study area at the time of selection with a first diagnosis of histo-logically confirmed primary invasive breast cancer. They were identified in cooperation with the North Carolina Cen-tral Cancer Registry [6] using a randomized recruitment protocol [7] to over-sample African-American women and women under 50 years of age. Potential controls were identified by North Carolina Division of Motor Vehicles (women aged 20–64 years) and/or Health Care Financing Administration (women aged 65–74 years) lists and had no previous or current history of breast cancer. Controls (n = 790) were frequency matched by race and 5-year age group to cases. Trained nurse interviewers collected infor-mation and obtained height and weight measurements dur-ing interviews conducted at the participant's home. To obtain birthweight and parental ages we requested birth records for all study participants born in the USA on or after 1 January 1948.
Maternal age was analyzed in the subset of women for whom birth records with maternal age were available (Table 1) and was categorized as 15–18 years, 19–22 years, 23– 27 years, or 28–44 years, based on homogeneity of risk apparent in smoothed lowess curves [8]. Paternal age was available for 92.7% of women with maternal age data, and was categorized as 15–22 years, 23–27 years, 28–34 years, or 35–56 years, by the same method. Maternal and paternal age distributions did not permit identical categorizations.
Birthweight analyses were restricted to women born in North Carolina (NC-born; Table 1). Of case and control birth records, 96% and 97%, respectively, were located and nearly all (97.0% and 94.9%, respectively) recorded birthweight. A restricted birthweight dataset was con-structed that excluded women who had any of the following indicators of a possibly poorly measured birthweight: non-institutional birth, birth attendant other than a physician, and a birthweight recorded only in pounds. Overall, birth-weight was recorded only in pounds more often for African-American than for white women (28% versus 7.4%). Afri-can-American women were more likely than white women to have been born at home, were less likely to have been delivered by a physician at home, and were less likely to have had a birthweight recorded in pounds and ounces under any birth circumstances. Hence, a disproportionate number of African-American women were excluded from the restricted dataset. Birthweights were converted from pounds and ounces to grams for analysis. Race-specific tertiles were derived from white or African-American controls.
Birth order was analyzed twice, first in the full CBCS data-set and then in the subdata-set of women for whom there was information on maternal age (Table 1). Birth order was self-reported and was a categorized as first, second to fourth, and fifth or higher.
Statistical analysis
classified themselves as non-white was under 1%, and so, for the purposes of this study, non-African-Americans were classified as white.
Age at menarche (≤12 years or >12 years), age at first full-term pregnancy (nulliparous, <26 years, ≥26 years), lacta-tion (nulliparous, ever breastfed, or never breastfed), parity (none, one, two, or three or more), BMI (≤25 kg/m2 or >25
kg/m2, calculated from nurse interviewers' measurements
of height and weight), first degree family history of breast cancer (positive if a mother, father, or full sibling had breast cancer), and menopausal status were considered potential confounders. Women younger than 50 years were consid-ered postmenopausal if they had undergone natural meno-pause, bilateral oophorectomy, or irradiation to the ovaries. Multivariable logistic models were used to adjust for poten-tial confounders [9]. A potenpoten-tial confounder was included in the model based on a >15% change in the β coefficient for any level of the birth characteristic relative to the refer-ent in either white or African-American women. Lowess curves were generated using Stata version 7.0 (Stata Cor-poration, College Station, TX, USA). All other analyses were done using SAS version 8.01.
Results
Racial distributions for analytic datasets are presented in Table 1. Overall, the proportion of African-American women was higher for the younger NC-born women (i.e. those eli-gible for the birthweight analysis) than for the full CBCS or for younger CBCS participants (born on or after 1 January 1948). Those eligible for the maternal and paternal age analyses were under 48 years of age at selection/diagno-sis. Consequently, the proportion of postmenopausal women was much lower in this group than in the full dataset (11% versus 55%), as was mean age at menopause (con-trols 39.2 ± 6.1 years versus 44.4 ± 7.3 years). There were somewhat higher proportions of women with first births at age greater than 26 years, no family history of breast
can-cer, household income above the study median, higher educational level, and nonrural childhoods. Only minor dif-ferences emerged between the women eligible for the parental age analyses and those for whom parental age was obtained. This subgroup of women was slightly more likely to have had rural childhoods and lower education. The birthweight analysis was restricted to younger NC-born women. These women reported, on average, only slightly lower educational level, more rural childhoods, lower household income, lower age at first birth, and higher BMI than did younger women overall.
No important differences in breast cancer risk factors emerged between those eligible for the birthweight study and those for whom birthweight was obtained. ORs for age at menarche, age at first pregnancy, and lactation were vir-tually identical in the full CBCS and all analytic datasets. Differences in ORs between the full CBCS dataset and the birthweight dataset were, as expected, due to age restric-tion in the latter. In the birthweight dataset, ORs for family history were slightly higher (OR 1.6, 95% CI 1.0–2.7 ver-sus OR 1.4, 95% CI 1.0–1.9), whereas ORs for the follow-ing were slightly lower: BMI greater than 25 kg/m2 (OR 0.6,
95% CI 0.4–0.8 versus OR 0.8, 95% CI 0.6–1.0), post-menopausal status (OR 0.7, 95% CI 0.4–1.5 versus OR 0.9, 95% CI 0.7–1.2), and parity of three or greater (OR 0.5, 95% CI 0.2–1.1 versus OR 0.8, 95% CI 0.6–1.1).
Risk factor distributions
The distributions of birthweight, parental age, and birth order are presented in Table 2. Birth records were unavail-able from some states, increasing the proportion of NC-born women in the maternal age dataset. The birthweight dataset was restricted to NC-born participants because of unavailability of birthweight on most out-of-state birth records. Ages at diagnosis/selection were similar in ana-lytic datasets and relevant subgroups of CBCS cases and controls. Maternal age, paternal age, and birth order were Cases and controls in Carolina Breast Cancer Study (CBCS) analytic datasets by race
African-American White
Analytic dataset Main exposure Cases (%) Controls (%) Cases (%) Controls (%)
CBCS, entire Birth order 335 (100.0) 332 (100.0) 526 (100.0) 458 (100.0)
CBCS, born 1948 or later 131 (39.1) 135 (40.7) 235 (44.7) 181 (39.5)
Maternal age dataset Birth order, Maternal age 107 (31.9) 116 (34.9) 173 (32.9) 121 (26.4)
Paternal age dataset Paternal age 95 (28.4) 100 (30.1) 171 (32.5) 118 (25.8)
CBCS, NC born 1949 or later 99 (29.6) 96 (28.9) 112 (21.3) 85 (18.6)
Birthweight, full dataset Birthweight 86 (25.7) 89 (26.8) 110 (20.9) 78 (17.0)
[image:3.612.51.564.114.274.2]R659
also similarly distributed in datasets including only younger women. As expected, the frequency of birth orders higher than fourth was lower among the younger women.
Birthweight
Tables 3 and 4 present ORs and 95% CIs for the associa-tion between birthweight categories and breast cancer in the full and restricted datasets, combined and by race, respectively. Overall, there was a weak inverse association Prenatal Factors in Carolina Breast Cancer Study (CBCS) Analytic Datasets
CBCS Analytic subgroups
CBCS, full dataset CBCS, born 1948+ Maternal age dataset Birthweight dataset
Cases Controls Cases Controls Cases Controls Cases Controls
n (%) n (%) n (%) n (%) n (%) n (%) n (%) n (%)
Number 861 790 366 316 280 237 196 167
Age at selection/diagnosis (years)
Mean ± SD 50.26 ± 11.93 51.83 ± 11.65 39.59 ± 5.29 40.65 ± 4.72 39.19 ± 5.43 40.68 ± 4.63 38.39 ± 5.29 39.95 ± 4.32
Median 48 49 41 42 40 42 39 41
Range 23–74 21–74 23–48 21–47 23–48 26–47 23–47 26–47
Birthplace
NC born 583 (67.7) 550 (69.6) 235 (64.2) 207 (65.5) 220 (78.6) 198 (83.5) 196 (100.0) 167 (100.0)
US born (outside NC) 261 (30.3) 218 (27.6) 121 (33.1) 98 (31.0) 60 (21.4) 39 (16.5) 0 (0.0) 0 (0.0)
Non-US born 17 (2.0) 22 (2.8) 10 (2.7) 11 (3.5) 0 (0.0) 0 (0.0) 0 (0.0) 0 (0.0)
Prenatal factors
Birthweight
Lower tertile NA NA NA NA NA NA 73 (37.2) 57 (34.1)
Central tertile 70 (35.7) 54 (32.3)
Upper tertile 53 (27.0) 56 (33.5)
Mean ± SD 3210.7 ± 526.1 3262.5 ± 550.3
Maternal age (years)
15–18 NA NA NA NA 31 (11.1) 31 (13.1) 21 (10.7) 22 (13.3)
19–22 51 (18.2) 80 (33.8) 34 (17.3) 53 (31.9)
23–27 87 (31.1) 49 (20.7) 60 (30.6) 38 (22.9)
28–44 111 (39.6) 77 (32.5) 81 (41.3) 53 (31.9)
Mean ± SD 26.46 ± 6.48 25.18 ± 6.66 26.63 ± 6.46) 25.34 ± 6.82
Paternal age (years)
15–22 NA NA NA NA 39 (14.7) 35 (16.1) 26 (14.1) 21 (14.0)
23–27 73 (27.5) 69 (31.8) 47 (25.4) 50 (33.3)
28–34 87 (32.8) 67 (30.9) 66 (35.7) 49 (32.7)
35–56 66 (24.9) 46 (21.2) 46 (24.9) 30 (20.0)
Mean ± SD 29.97 ± 7.10 29.54 ± 7.46 30.24 ± 7.06) 29.71 ± 7.48
Birth order (self-report)
First 297 (34.8) 268 (34.1) 117 (32.3) 108 (34.3) 88 (31.5) 80 (33.9) 56 (28.6) 53 (31.9)
Second-fourth 406 (47.5) 377 (48.0) 194 (53.6) 158 (50.2) 149 (53.4) 115 (48.7) 107 (54.6) 81 (48.8)
Fifth or higher 151 (17.7) 140 (17.8) 51 (14.1) 49 (15.6) 42 (15.1) 41 (17.4) 33 (16.8) 32 (19.3)
Mean ± SD 2.86 ± 2.30 2.87 ± 2.32 2.76 ± 2.12 2.74 ± 2.15 2.83 ± 2.22 2.84 ± 2.25 2.95 ± 2.22 3.01 ± 2.35
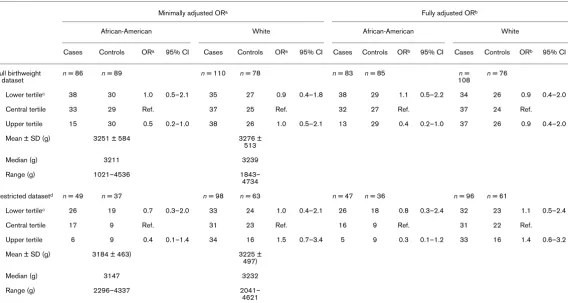
[image:4.612.68.553.115.660.2]between higher birthweight and breast cancer in the full dataset but not in the restricted dataset. Higher birthweight was inversely associated with breast cancer among African-American women in the full and restricted datasets, although CIs were wide. There was no association for higher birthweight in white women for the full dataset and a modest but statistically nonsignificant positive association for the restricted dataset. There was no association between lower birthweight and breast cancer for white or African-American women in the full birthweight dataset. As has historically been the case in North Carolina and else-where [10], mean and median birthweight and lower and upper limits of birthweight distributions among controls were higher for whites than for African-Americans. Neither prenatal characteristics nor adult BMI were strongly corre-lated with birthweight (data not shown).
Maternal and paternal age
ORs for maternal and paternal age and breast cancer are presented in Table 5. After adjustment, older maternal age (>22 years of age) increased ORs approximately threefold, whereas older paternal age (>27 years of age) was more weakly associated with breast cancer. Maternal and pater-nal ages, as categorized, were moderately correlated (Spearman correlation coefficient 0.73, 95% CI 0.69– 0.78). Parental ages were somewhat correlated with birth order (Spearman correlation coefficients 0.47, 95% CI
0.40–0.54 and 0.43, 95% CI 0.35–0.50 for maternal and paternal ages, respectively). After full adjustment, the OR was elevated and of borderline statistical significance for maternal age 15–18 years among African-American women but not among white women (Table 6). ORs for maternal age over 22 years were increased twofold to five-fold, with 95% CIs usually excluding the null, for both white and African-American women. The odds of breast cancer for all categories of maternal age were slightly stronger for first-born participants, although this was not statistically significant (data not shown).
After adjustment for maternal age, birth order, adult BMI, and household income, there was no association between paternal age and breast cancer among white women. For African-American women, ORs were elevated for both younger (15–22 years of age) and older (35–56 years of age) paternal ages, although CIs were wide. There was no substantial difference in results when the maternal/paternal age datasets were restricted to women born on or after 1 January 1949. Among controls, parental ages were distrib-uted similarly by race, with African-American participants having slightly higher mean maternal and paternal ages than whites.
Birthweight distributions and odds ratios for breast cancer in African-American and white women combined
Minimally adjusted ORa Fully adjusted ORb
Cases Controls ORa 95% CI Cases Controls ORb 95% CI
Full birthweight dataset n = 196 n = 167 n = 191 n = 161
Lower tertilec 73 57 0.9 0.6–1.6 72 55 1.0 0.6–1.7
Central tertile 70 54 Ref. 69 51 Ref.
Upper tertile 53 56 0.7 0.4–1.2 50 55 0.7 0.4–1.2
Mean ± SD (g) 3262 ± 550
Median (g) 3232
Range (g) 1021–4621
Restricted datasetd n = 147 n = 100 n = 143 n = 97
Lower tertilec 59 43 0.9 0.5–1.7 58 41 1.0 0.5–0.9
Central tertile 48 32 Ref. 47 31 Ref.
Upper tertile 40 25 1.0 0.5–2.1 38 25 0.9 0.4–1.9
Mean ± SD (g) 3210 ± 482
Median (g) 3232
Range (g) 2041–4621
[image:5.612.56.556.115.371.2]R661
Birth order
Results for analyses of birth order are shown in Tables 7 and 8. In the full CBCS dataset, birth order (categorized as first, second to fourth, or fifth or higher) was not associated with breast cancer, overall or by race. In the full CBCS, mean birth order was higher for African-Amer-icans than for whites; this pattern was stronger in younger CBCS participants. No potential confounders met the criteria for model inclusion. Finer categorization of birth order did not change the results. For younger women, adjustment for maternal age, adult BMI, and household income revealed a weak, statistically nonsignificant, inverse relationship between higher birth order and odds of breast cancer, which did not differ appreciably by race.
Discussion
We examined the relationships between breast cancer and birth-weight, parental age, and birth order among women younger than 49 years of age residing in North Carolina. Overall, there was a weak inverse association with higher birthweight, which was stronger in the full dataset than in the restricted dataset. For white women in the study there was no overall association between birthweight and breast cancer. Among white women born in medical facilities, birth-weight in the highest tertile was positively associated with breast cancer, but CIs were wide and included the null. Higher birthweight was inversely associated with breast cancer for African-American
women regardless of delivery setting, but again CIs were wide for all estimates. Most previous studies have reported weak to modest pos-itive associations between higher birthweight and breast cancer [11-22], with some showing a positive dose response [11,16-19]. The only previous report of an overall weak inverse association between higher birthweight and breast cancer was from an Asian population [23], although similar results were reported among older, white women [16,19]. Two studies have shown no association [24,25]. With the exception of the Asian case–control study [23], previous studies of birthweight have been done in exclusively or predominantly white populations: seven large record-based, nested case–control studies in Scandinavian cohorts [11,12,14,16,17,22,24]; five popu-lation-based, case–control studies in the USA [13,19,20,25,26]; one US cohort study [18]; and one cohort study [21] and a cross-sec-tional study [15] conducted in the UK. All previous studies of birth-weight and breast cancer included younger women; 10 presented results for premenopausal or younger women separately [13,14,16-21,23,26]. Associations were generally positive in younger women, with ORs ranging from 1.25 (95% CI 1.0–1.6) [17] to 3.5 (95% CI 1.3–9.4) [16] for birthweights of 4000 g or greater, as compared with the ORs of 1.4–1.5 for birthweight greater than 3458 g among younger white women with reliable birthweights observed in the present study. No previous studies have estimated ORs for African-American women.
Birthweight distributions and odds ratios for breast cancer among African-American and white women by race
Minimally adjusted ORa Fully adjusted ORb
African-American White African-American White
Cases Controls ORa 95% CI Cases Controls ORa 95% CI Cases Controls ORb 95% CI Cases Controls ORb 95% CI
Full birthweight dataset
n = 86 n = 89 n = 110 n = 78 n = 83 n = 85 n =
108
n = 76
Lower tertilec 38 30 1.0 0.5–2.1 35 27 0.9 0.4–1.8 38 29 1.1 0.5–2.2 34 26 0.9 0.4–2.0
Central tertile 33 29 Ref. 37 25 Ref. 32 27 Ref. 37 24 Ref.
Upper tertile 15 30 0.5 0.2–1.0 38 26 1.0 0.5–2.1 13 29 0.4 0.2–1.0 37 26 0.9 0.4–2.0
Mean ± SD (g) 3251 ± 584 3276 ± 513
Median (g) 3211 3239
Range (g) 1021–4536 1843– 4734
Restricted datasetd n = 49 n = 37 n = 98 n = 63 n = 47 n = 36 n = 96 n = 61
Lower tertilec 26 19 0.7 0.3–2.0 33 24 1.0 0.4–2.1 26 18 0.8 0.3–2.4 32 23 1.1 0.5–2.4
Central tertile 17 9 Ref. 31 23 Ref. 16 9 Ref. 31 22 Ref.
Upper tertile 6 9 0.4 0.1–1.4 34 16 1.5 0.7–3.4 5 9 0.3 0.1–1.2 33 16 1.4 0.6–3.2
Mean ± SD (g) 3184 ± 463) 3225 ± 497)
Median (g) 3147 3232
Range (g) 2296–4337 2041– 4621
[image:6.612.25.593.113.416.2]In the USA maternal report and self-report have been the most common sources of birthweight information, rather than birth records. Andersson and coworkers [27] con-ducted an analysis of agreement between self-reported birthweight and birth records. They found that, despite good overall agreement (Spearman correlation coefficient 0.76), 31% of self-reported birthweights differed from birth record data by 500 g or more, and that this level of misclas-sification led to both underestimation and overestimation of the magnitude and significance of various effect estimates. Moreover, nonresponse can be sizable (ranging from 12% [19] to 24% [28]) and may reflect bias toward healthier [29], more educated, and/or more communicative mothers. In the USA, birthweight was only routinely recorded on birth records of younger women, the group in which the associ-ation between birthweight and breast cancer appears to be strongest [2]. The two US studies that used birth records (conducted in Hawaii [26] and New York state [13]) employed a design similar to that of the present study – a population-based, case–control study using cases born in the state where they were recruited. Both observed mini-mal, statistically nonsignificant, increased risks for breast cancer among women in the highest tertile of birthweight relative to those in the central tertile. The present study is
intermediate in sample size between these two studies, which included 74 and 484 cases, respectively.
In addition to using birth records to decrease misclassifica-tion, we performed a separate birthweight analysis for the subset of women who were delivered by physicians in hos-pitals or doctors' clinics and had their birthweight recorded in pounds and ounces. During the 1950s, home birth and delivery by lay midwives was common practice in North Carolina, particularly among African-Americans and in rural areas, and this could have affected data collection [10]. Additionally, participants delivered in a medical setting comprise a subgroup of women more closely comparable to previous study participants than do women born at home. Results for white women from this subset were in agreement with previous literature, with a small positive association between birthweight and breast cancer, whereas birthweight remained inversely associated for African-American women in the restricted dataset with comparable delivery circumstances. Although analyses in this restricted group potentially reduce birthweight misclas-sification, results may have limited generalizability to less medically advantaged populations.
Parental age distributions and odds ratios for breast cancer among African-American and white women combined
Minimally adjusted ORa Fully adjusted ORb
Case Control OR 95% CI Case Control OR 95% CI
Maternal age (years)c n = 280 n = 236 n = 263 n = 235
15–18 31 31 1.8 0.9–3.4 30 29 1.8 0.9–3.5
19–22 (ref.) 51 80 Ref. 48 77 Ref.
23–27 87 49 3.0 1.8–5.0 85 48 3.5 2.0–5.9
28–44 111 77 2.5 1.6–4.0 100 81 3.0 1.8–5.2
Mean ± SD 26.5 ± 6.5 25.2 ± 6.7
Median 26 23
Range 17–43 15–43
Paternal age (years)d n = 266 n = 218 n = 251 n = 206
15–22 39 35 1.0 0.6–1.8 38 33 1.6 0.8–3.1
23–27 (refs) 73 70 Ref 69 65 Ref
28–34 87 67 1.3 0.8–2.1 83 62 1.2 0.7–2.2
35–56 67 46 1.6 0.9–2.6 61 46 1.5 0.7–3.2
Mean ± SD 30 ± 7.1) 29.5 ± 7.5)
Median 29 28
Range 17–53 15–56
[image:7.612.113.554.116.405.2]R663
Although the search strategy employed in this study limited non-locatable birth records to 3.6% of the study population, and records missing birthweight to 4.0% of locatable records (i.e. data available for 92% and 93% of eligible cases and controls, respectively), the missing records were predominantly those of African-American women who self-reported birth in the more rural counties of North Carolina.
The inverse associations between higher birthweight and breast cancer seen in this study could also partly be explained by selec-tion bias in the full CBCS dataset if either the case group under-represented the proportion of high birthweight women in the underlying case population or the control group under-repre-sented the proportion of normal weight births in the underlying population. Because birthweights in North Carolina have been increasing over time, more strongly in whites than in African Amer-icans [30], younger white women would be expected on average to have the highest birthweights, and this group is slightly over-represented rather than under-over-represented in the case popula-tion. Some under-representation of African-American women in the control population (36.5% response rate for younger
African-Americans) could have contributed to an upward bias in the con-trol birthweights.
In the context of a relatively disadvantaged population such as this one, a higher birthweight may be a surrogate for a different con-stellation of prenatal and postnatal influences than in a relatively advantaged population. Rather than viewing birthweight solely as an indicator of a highly estrogenic prenatal environment, or even specific physiologic processes, birthweight can also be viewed more globally as an indicator of the prepregnancy health of the mother [31,32]. In this context, it could be considered predictive of the general overall health of the daughter as well and perhaps of a decreased susceptibility to some etiologic agents. Socioeco-nomic status, based on study participants' self-reported current household income, was not found to be a confounder in this study, but it is probably a poor surrogate for complex environmen-tal influences such as early diet, physical activity, or childhood res-idence. If there is either a general or breast cancer specific survival advantage to having a higher birthweight, then one would expect to see an inverse association between birthweight and breast cancer among older women. This was found in one study of birthweight and breast cancer [19] but not in another [18], Parental age distributions and odds ratios for breast cancer among African-American and white women by race
Minimally adjusted ORa Fully adjusted ORb
African-American White African-American White
Case Control OR 95% CI Case Control OR 95% CI Case Control OR 95% CI Case Control OR 95% CI
Maternal age
(years)c n = 107 n = 116 n = 173 n = 120 n = 99 n = 118 n = 164 n = 117
15–18 19 17 2.3 0.9–5.5 12 14 1.1 0.5–2.9 18 15 2.7 1.0–7.0 12 14 1.0 0.4–2.7
19–22 (ref.)
18 33 Ref. 33 47 Ref. 17 33 Ref. 31 44 Ref.
23–27 28 28 1.9 0.9–4.3 59 21 4.2 2.1–8.3 27 28 2.4 1.0–5.4 58 20 4.8 2.3–9.8
28–44 42 38 2.2 1.1–4.6 69 39 2.7 1.5–4.9 37 42 3.3 1.4–7.4 63 39 2.8 1.4–5.4
Mean ± SD 26.4 ± 7.3 25.5 ± 7.0 26.5 ± 5.9 24.9 ± 6.3
Median 26 23 26 22
Range 15–43 16–38 16–43 15–44
Paternal age
(years)d n = 95 n = 100 n = 171 n = 118 n = 89 n = 94 n = 162 n = 112
15–22 16 15 1.6 0.6–3.9 23 20 0.7 0.3–1.5 16 14 2.7 1.0–7.3 22 19 1.1 0.5–2.5
23–27 (ref.)
22 30 Ref. 51 40 Ref. 20 27 Ref. 49 38 Ref.
28–34 23 28 1.3 0.6–2.8 64 39 1.3 0.8–2.4 22 26 1.3 0.5–3.4 61 36 1.2 0.6–2.4
35–56 34 27 1.9 0.9–4.0 33 19 1.4 0.7–2.8 31 27 2.1 0.8–5.8 30 19 1.1 0.4–2.9
Mean ± SD 30.9 ± 6 30.4 ± 8.0 29.5 ± 6.8 28.8 ± 6.9
Median 30 29 29 27
Range 18–52 19–54 17–53 15–56
[image:8.612.36.581.112.441.2]although an apparent protective effect of higher birthweight has been found for other chronic diseases [19,33]. Inas-much as birthweight is a good surrogate for higher intrau-terine estrogen levels, these data do not support the hypothesis that in utero estrogen exposure increases risk for breast cancer.
One limitation of our birthweight analysis is that, lacking an accurate measure of gestational age, it is not possible to interpret fully the association between lower birthweight and breast cancer. Although Andersson and coworkers [11] reported increases in risk associated with birthweight after adjustment for gestational age, particularly after addi-tional adjustment for age at menarche, evidence is incon-sistent for gestational age as a strong confounder [2,14]. In the birthweight analyses, power (the probability of correctly rejecting the null hypothesis) to detect an OR of 1.5 at the 95% confidence level was low for whites and African-Americans (0.33 and 0.61, respectively). Similarly, power to detect an OR of 0.5 was low for whites and African-Americans (0.25 and 0.50, respectively). Therefore chance cannot be ruled out as an explanation for the results. Although stratification allowed us to characterize the rela-tionships between these early life factors and breast cancer in African-American women, power to detect an overall effect was decreased. Because this is the only study to
date that presents data on African-American women, fur-ther research should be undertaken.
Older maternal age exhibited a moderate positive associa-tion with breast cancer in this study. Study participants whose mothers were aged 23 years or older at the partici-pant's birth had approximately twofold to fourfold higher odds of breast cancer than did women whose mothers were between 19 and 22 years of age. Although African-American women whose mothers were aged under 19 years also had elevated odds of breast cancer, the pattern did not differ appreciably between white and African-Amer-ican women. Although the magnitude of OR for women whose mothers were aged 23–27 years was greater than in previous studies, the findings were consistent with the majority of previous reports: weak positive associations with older maternal age [13,24-26,34-42], with stronger associations (approximate doubling in the oldest catego-ries) found for younger women [13,26,43]. Several studies, however, reported no association with older maternal age [12,17,19,43,44]. Innes and coworkers [13] reported a similar J-shaped relationship between maternal age and breast cancer for women diagnosed before age 33 years; the lowest risk was for those aged 20–24 years, with an approximate doubling of odds for women whose mothers were older than 35 years old at their birth. Collectively, these data do not support highest risk being associated Birth order distributions and odds ratios for breast cancer among white and African-American women combined
Minimally adjusted ORa Fully adjusted ORb
Case Control OR 95% CI Case Control OR 95% CI
Full CBCSc n = 854 n = 785 n = 854 n = 785
1st born (ref.) 297 268 Ref. 297 268 Ref.
2nd–4th born 406 377 0.9 0.7–1.1 406 377 0.9 0.7–1.1
5th–14th born 151 140 1.0 0.8–1.3 151 140 1.0 0.8–1.3
Mean ± SD 2.9 ± 2.3 2.9 ± 2.3
Median 2.0 2.0
Range 1–14 1–14
Born ≥1948d,e n = 362 n = 315 n = 164 n = 224
1st born (ref.) 117 108 Ref. 84 76 Ref.
2nd–4th born 194 158 1.1 0.8–1.6 144 109 0.9 0.6–1.4
≥5th born 51 49 1.0 0.6–1.7 37 39 0.6 0.3–1.3
Mean ± SD 2.8 ± 2.1 2.7 ± 1.2 2.8 ± 2.2 2.9 ± 2.3
Median 2.0 2.0 2.0 2.0
Range 1–14 1–14 1–14 1–14
1Adjusted for age, race, and sampling fractions. 2Adjusted for age, race, sampling fractions, and other covariates as specified. 3Additional covariates for fully adjusted OR: none. 4Additional covariates for fully adjusted OR: adult body mass index >25 kg/m2, household income
[image:9.612.57.560.113.378.2]R665
with maternal age 20–24 years, as predicted by the estrogen the-ory [1]. Recent evidence, however, indicates that the association between maternal age and levels of pregnancy estrogens may be weaker than was previously thought [45,46]. Alternatively, older oocytes may have sustained more genetic damage over time and/ or DNA repair may be deficient in older mothers [35,47].
The pattern of association between having an older father (older paternal age) and breast cancer was somewhat different for white and African-American women. After adjustment for maternal age and birth order, paternal age was not associated with breast can-cer for white women. This is consistent with previous reports for white women showing little to no effect of paternal age [34,38,41,42]. For African-American women in the present study, positive associations with breast cancer were seen for those with the youngest (age 15–22 years) and oldest (age 35–56 years) fathers at their birth, even after adjustment for maternal age and birth order. This is broadly consistent with the only previous study of paternal age to include African-Americans (10.1 % of partici-pants, 52 matched case–control pairs) [13]. In that study Innes and coworkers found an elevated risk associated with older pater-nal age, after adjustment for materpater-nal age and birth order (OR 1.3, 95% CI 0.9–1.7 for age 30–34 years; OR 1.2, 95% CI 0.8–1.7 for age 35–39 years; and OR 1.3, 95% CI 0.8–2.0 for age ≥40
years), and there was some suggestion of effect modification by race. Although speculative, the differing risk patterns for paternal age in white and African-American women may reflect differing exposures for white and African-American men at that time and place, which could have affected mutation rates.
Birth records with parental age could only be obtained for 76% of CBCS participants born in or after 1948, and were missing almost exclusively by participants' state of birth. Breast cancer mortality is generally higher in the midwest and northeast regions of the USA than in the southeast [48], and so if participants with higher birthweights from those areas were systematically excluded then bias toward the null would be expected. However, there was no regional pattern to the missing birth records; there-fore, this was unlikely to have introduced substantial bias. Paternal information was collected only when the mother was married. Although the proportion of unmarried parents is small, this could have introduced bias.
In women younger than 50 years of age, higher birth order exhib-ited a weak inverse association with breast cancer only after adjustment for maternal age. No association was seen in the full CBCS, which included women aged up to 74 years, although data were not available to adjust for maternal age. This is consist-Birth order distributions and odds ratios for breast cancer among white and African-American women by race
Minimally adjusted ORa Fully adjusted ORb
African-American White African-American White
Case Control OR 95% CI Case Control OR 95% CI Case Control OR 95% CI Case Control OR 95% CI
Full CBCSc n = 331 n = 329 n = 523 n = 456 n = 331 n = 329 n = 523 n = 456
1st born
(ref.) 106 103 Ref. 191 165 Ref. 106 103 Ref. 191 165 Ref.
2nd–4th born
142 151 0.8 0.6–1.2 264 226 1.0 0.7–1.3 142 151 0.8 0.6–1.2 264 226 1.0 0.7–1.3
≥5th born 83 75 1.0 0.7–1.5 68 65 1.0 0.7–1.5 83 75 1.0 0.7–1.5 68 65 1.0 0.7–1.5
Mean ± SD 3.6 ± 2.7 3.3 ± 2.7 2.6 ± 1.9 2.6 ± 2.0
Median 2.0 3.3 2.0 2.0
Range 1–14 1–14 1–12 1–11
Born ≥1948d,e n = 129 n = 134 n = 233 n = 181 n = 101 n = 109 n = 164 n = 115
1st born (ref.)
37 41 Ref. 80 67 Ref. 29 31 Ref. 55 45 Ref.
2nd–4th born
56 61 1.0 0.5–1.7 138 97 1.2 0.8–1.9 46 50 0.7 0.4–1.5 98 59 1.0 0.6–1.8
≥5th born 36 32 1.2 0.6–2.3 15 17 0.7 0.3–1.6 26 28 0.7 0.3–1.6 11 11 0.5 0.2–1.5
Mean ± SD 3.6 ± 2.7) 3.3 ± 2.6) 2.3 ± 1.5) 2.3 ± 1.6)
Median 3.0 2.5 2.0 2.0
Range 1–14 1–14 1–10 1–11
1Adjusted for age and sampling fractions. 2Adjusted for age, sampling fractions, and other covariates as specified. 3Additional covariates for fully adjusted OR: none. 4Additional
covariates for fully adjusted OR: adult body mass index >25 kg/m2, household income ≥$30,000 and maternal age. 5Restricted to participants born on or after 1 January 1948. CBCS,
[image:10.612.37.581.112.411.2]ent with the majority of previous studies, which have shown either a weak inverse association with breast cancer [19,26,36,49] or no association [22,24,37]. A weak posi-tive relationship (OR 1.05, 95% CI 1.01–1.10 per 1 unit increase in birth order) was found by Hemminki and Mutanen [50]. Few studies were able to adjust for maternal age. Because pregnancy estrogens appear to be highest in first pregnancies and decline in successive pregnancies [51,52], these results lend some support to the theory that prenatal estrogen exposure may influence breast cancer later in life. Birth order was self-reported and may have been misclassified. Although the number of previous mater-nal pregnancies could be a better measure of prenatal estrogen exposure than live birth order, we could not assess this because of poor data quality on the birth records.
Younger African-American women are at higher risk for breast cancer than younger white women [3,4]. Birth-weight, patterns of parental age at birth, and birth order continue to vary by race [53]. Our study has several impor-tant strengths. Use of birth records as the source of birth-weight information improved accuracy of the exposure measurement, eliminated recall bias caused by self-report, and reduced possible selection bias from maternal report. Similarly, birth records improved data quality for parental age. Using a population-based case–control study made it possible to evaluate a wider range of adult-life risk factors as potential confounders and/or effect modifiers than is generally possible in a registry-based study.
Conclusion
Taken as a whole, the results for birthweight, parental age, and birth order from the present study do not support the estrogen exposure hypothesis as a unifying theory for pre-natal influence on adult breast cancer. This emphasizes the importance of further investigating the influence of prenatal factors on breast cancer risk, particularly in multiple popu-lations. Additional hypotheses must be pursued, including the association between birthweight and other hormonal exposures such as insulin-like growth factor I, and between maternal age and endogenous and exogenous mutagenic exposures. Methodologic difficulties involved in investigat-ing prenatal exposures in nonwhite and/or disadvantaged populations are not trivial; nonetheless, this type of investi-gation must be done to fully understand life course proc-esses that can culminate in breast cancer among women of any background.
Author contributions
MEH, BN and RCM participated in the interpretation of results and writing of the manuscript. MEH performed data collection, data entry, and statistical analyses.
Competing interests
The authors declare that they have no competing interests.
Acknowledgements
The CBCS was supported in part by the Program of Research Excel-lence (SPORE) in Breast Cancer (NIH/NCI P50-CA58223) and con-ducted through UNC-Chapel Hill and the Lineberger Comprehensive Cancer Center. M Elizabeth Hodgson was supported by a National Can-cer Institute training grant for canCan-cer epidemiology at the University of North Carolina-Chapel Hill School of Public Health. The authors thank Sandra L Deming, Thao Vo, Vani Vannappagari, Olga L Sarmiento (Uni-versity of North Carolina at Chapel Hill, Department of Epidemiology), and Patricia Plummer (CBCS nurse interviewer) for insightful discus-sions and Dianne Vann (North Carolina Central Cancer Registry, Department of Environment Health and Natural Resources) for invalua-ble assistance collecting birth records.
References
1. Trichopoulos D: Hypothesis: does breast cancer originate in utero?Lancet 1990, 335:939-940.
2. Potischman N, Troisi R: In-utero and early life exposures in rela-tion to risk of breast cancer.Cancer Causes Control 1999, 10:561-573.
3. Hall IJ, Newman B, Millikan RC, Moorman PG: Body size and breast cancer risk in black women and white women: the Carolina Breast Cancer Study. Am J Epidemiol 2000, 151:754-764.
4. Janerich DT, Hoff MB: Evidence for a crossover in breast cancer risk factors.Am J Epidemiol 1982, 116:737-742.
5. Newman B, Moorman PG, Millikan R, Qaqish BF, Geradts J, Aldrich TE, Liu ET: The Carolina Breast Cancer Study: integrat-ing population-based epidemiology and molecular biology. Breast Cancer Res Treat 1995, 35:51-60.
6. Aldrich TE, Vann D, Moorman PG, Newman B: Rapid reporting of cancer incidence in a population-based study of breast can-cer: one constructive use of a central cancer registry.Breast Cancer Res Treat 1995, 35:61-64.
7. Weinberg CR, Sandler DP: Randomized recruitment in case-control studies.Am J Epidemiol 1991, 134:421-432.
8. Selvin S: Smoothing sequential data. In Epidemiological Analy-sis, A Case-Oriented Approach Oxford: Oxford University Press; 2001:243-247.
9. Kleinbaum DG: Logistic Regression: A Self Learning Text New York: Springer; 1994.
10. Dunn HL: Vital Statistics of the United States 1954. Vol I: Mar-riage, Divorce, Natality, Fetal Mortality and Infant Mortality Data. Tables 18 and 28 Washington, DC: US Government Printing Office; 1956.
11. Andersson SW, Bengtsson C, Hallberg L, Lapidus L, Niklasson A, Wallgren A, Hulthen L: Cancer risk in Swedish women: the rela-tion to size at birth.Br J Cancer 2001, 84:1193-1198. 12. Hilakivi-Clarke L, Forsen T, Eriksson JG, Luoto R, Tuomilehto J,
Osmond C, Barker DJ: Tallness and overweight during child-hood have opposing effects on breast cancer risk.Br J Cancer 2001, 85:1680-1684.
13. Innes K, Byers T, Schymura M: Birth characteristics and subse-quent risk for breast cancer in very young women. Am J Epidemiol 2000, 152:1121-1128.
14. Kaijser M, Akre O, Cnattingius S, Ekbom A: Preterm birth, birth weight, and subsequent risk of female breast cancer. Br J Cancer 2003, 89:1664-1666.
15. Lawlor DA, Okasha M, Gunnell D, Smith GD, Ebrahim S: Associ-ations of adult measures of childhood growth with breast can-cer: findings from the British Women's Heart and Health Study. Br J Cancer 2003, 89:81-87.
16. McCormack VA, dos Santos Silva I, De Stavola BL, Mohsen R, Leon DA, Lithell HO: Fetal growth and subsequent risk of breast cancer: results from long term follow up of Swedish cohort.BMJ 2003, 326:248.
R667
Hunter DJ, Colditz GA, Hankinson SE, Speizer FE, Willett WC: Birthweight as a risk factor for breast cancer.Lancet 1996, 348:1542-1546.
19. Sanderson M, Williams MA, Malone KE, Stanford JL, Emanuel I, White E, Daling JR: Perinatal factors and risk of breast cancer. Epidemiology 1996, 7:34-37.
20. Sanderson M, Williams MA, Daling JR, Holt VL, Malone KE, Self SG, Moore DE: Maternal factors and breast cancer risk among young women.Paediatr Perinat Epidemiol 1998, 12:397-407. 21. Stavola BL, Hardy R, Kuh D, Silva IS, Wadsworth M, Swerdlow AJ:
Birthweight, childhood growth and risk of breast cancer in a British cohort.Br J Cancer 2000, 83:964-968.
22. Vatten LJ, Maehle BO, Lund N, Tretli S, Hsieh CC, Trichopoulos D, Stuver SO: Birth weight as a predictor of breast cancer: a case-control study in Norway.Br J Cancer 2002, 86:89-91. 23. Sanderson M, Shu XO, Jin F, Dai Q, Ruan Z, Gao YT, Zheng W:
Weight at birth and adolescence and premenopausal breast cancer risk in a low-risk population. Br J Cancer 2002, 86:84-88.
24. Ekbom A, Hsieh CC, Lipworth L, Adami HQ, Trichopoulos D: Intrauterine environment and breast cancer risk in women: a population-based study.J Natl Cancer Inst 1997, 89:71-76. 25. Titus-Ernstoff L, Egan KM, Newcomb PA, Ding J, Trentham-Dietz A,
Greenberg ER, Baron JA, Trichopoulos D, Willett WC: Early life factors in relation to breast cancer risk in postmenopausal women.Cancer Epidemiol Biomarkers Prev 2002, 11:207-210. 26. Le Marchand L, Kolonel LN, Myers BC, Mi MP: Birth
characteris-tics of premenopausal women with breast cancer.Br J Cancer 1988, 57:437-439.
27. Andersson SW, Niklasson A, Lapidus L, Hallberg L, Bengtsson C, Hulthen L: Poor agreement between self-reported birth weight and birth weight from original records in adult women.Am J Epidemiol 2000, 152:609-616.
28. Sanderson M, Williams MA, Daling JR, Holt VL, Malone KE, Self SG, Moore DE: Maternal factors and breast cancer risk among young women.Paediatr Perinat Epidemiol 1998, 12:397-407. 29. Allen DS, Ellison GT, dos Santos Silva I, De Stavola BL, Fentiman
IS: Determinants of the availability and accuracy of self-reported birth weight in middle-aged and elderly women.Am J Epidemiol 2002, 155:379-384.
30. National Center for Health Statistics: Vital Statistics of the United States 1980. Vol I: Natality. Tables 1–39, 1–41, and 1–77 Hyat-tsville, MD: National Center for Health Statistics; 1984.
31. Geronimus AT: The weathering hypothesis and the health of African-American women and infants: evidence and speculations.Ethn Dis 1992, 2:207-221.
32. Pallotto EK, Collins JWJ, David RJ: Enigma of maternal race and infant birth weight: a population-based study of US-born Black and Caribbean-born Black women. Am J Epidemiol 2000, 151:1080-1085.
33. Rich-Edwards JW, Colditz GA, Stampfer MJ, Willett WC, Gillman MW, Hennekens CH, Speizer FE, Manson JE: Birthweight and the risk for type 2 diabetes mellitus in adult women.Ann Intern Med 1999, 130:278-284.
34. Colditz GA, Willett WC, Stampfer MJ, Hennekens CH, Rosner B, Speizer FE: Parental age at birth and risk of breast cancer in daughters: a prospective study among US women. Cancer Causes Control 1991, 2:31-36.
35. Hemminki K, Kyyronen P: Parental age and risk of sporadic and familial cancer in offspring: implications for germ cell mutagenesis.Epidemiology 1999, 10:747-751.
36. Hsieh CC, Tzonou A, Trichopoulos D: Birth order and breast can-cer risk.Cancer Causes Control 1991, 2:95-98.
37. Janerich DT, Hayden CL, Thompson WD, Selenskas SL, Mettlin C: Epidemiologic evidence of perinatal influence in the etiology of adult cancers.J Clin Epidemiol 1989, 42:151-157.
38. Janerich DT, Thompson WD, Mineau GP: Maternal pattern of reproduction and risk of breast cancer in daughters: results from the Utah Population Database.J Natl Cancer Inst 1994, 86:1634-1639.
39. Thompson WD, Janerich DT: Maternal age at birth and risk of breast cancer in daughters.Epidemiology 1990, 1:101-106. 40. Rothman KJ, MacMahon B, Lin TM, Lowe CR, Mirra AP, Ravnihar
B, Salber EJ, Trichopoulos D, Yuasa S: Maternal age and birth rank of women with breast cancer.J Natl Cancer Inst 1980, 65:719-722.
tion to risk of breast cancer.Cancer Epidemiol Biomarkers Prev 1997, 6:151-154.
42. Zhang Y, Cupples LA, Rosenberg L, Colton T, Kreger BE: Paren-tal ages at birth in relation to a daughter's risk of breast cancer among female participants in the Framingham Study (United States).Cancer Causes Control 1995, 6:23-29.
43. Weiss HA, Potischman NA, Brinton LA, Brogan D, Coates RJ, Gammon MD, Malone KE, Schoenberg JB: Prenatal and perina-tal risk factors for breast cancer in young women. Epidemiol-ogy 1997, 8:181-187.
44. Baron JA, Vessey M, McPherson K, Yeates D: Maternal age and breast cancer risk.J Natl Cancer Inst 1984, 72:1307-1309. 45. Kaijser M, Jacobsen G, Granath F, Cnattingius S, Ekbom A:
Mater-nal age, anthropometrics and pregnancy oestriol.Paediatr Peri-nat Epidemiol 2002, 16:149-153.
46. Troisi R, Potischman N, Roberts J, Siiteri P, Daftary A, Sims C, Hoover RN: Associations of maternal and umbilical cord hor-mone concentrations with maternal, gestational and neonatal factors (United States). Cancer Causes Control 2003, 14:347-355.
47. van Noord PA: An alternative, non-intrauterine hypothesis, based on maternal mitochondrial oocyte inheritance, to explain inconsistent findings of birth weight on (breast) cancer risk.Br J Cancer 2003, 88:1817-1818.
48. National Cancer Institute: Breast Cancer Mortality by US State, 1970–1994. SEER Registry 20 [http://www3.cancer.gov/atlas plus/]. (last accessed 17 February 2004)
49. Janerich DT, Thompson WD, Mineau GP: Maternal pattern of reproduction and risk of breast cancer in daughters: results from the Utah Population Database.J Natl Cancer Inst 1994, 86:1634-1639.
50. Hemminki K, Mutanen P: Birth order, family size, and the risk of cancer in young and middle-aged adults.Br J Cancer 2001, 84:1466-1471.
51. Bernstein L, Depue RH, Ross RK, Judd HL, Pike MC, Henderson BE: Higher maternal levels of free estradiol in first compared to second pregnancy: early gestational differences.J Natl Can-cer Inst 1986, 76:1035-1039.
52. Bernstein L, Lipworth L, Ross RK, Trichopoulos D: Correlation of estrogen levels between successive pregnancies. Am J Epidemiol 1995, 142:625-628.