Richard Weller, IGER, Andrew Jackson, IRS
Organic
Dairy
Farming
Canolfan Organig Cymru
Organic Centre Wales
June 2006
Contents
Introduction 2
Part 1: The experience of IGER Ty Gwyn 3
1. Background 3
2. Nutrient budgets and soil fertility 4
2.1 Whole-farm nutrient budgets 4
2.2 Maintaining soil fertility 5
3. Field practices and cropping options 5
3.1 Establishing leys and other crops at Ty Gwyn 5
3.2 Forage production 6
3.3 Grazing strategy 7
3.4 Silage 8
3.5 Forage quality 9
3.6 Cereal crops for the production of grain and straw at Ty Gwyn 11
4. The management and performance of the organic dairy cow 12
4.1 Feeding the dairy cow 13
4.2 Changes in the organic feed standards 13
4.3 Calving season options 13
4.4 Herd performance and breed selection 14
4.5 Herd health 16
5. Acknowledgements 17
6. References 17
7. Suggested further reading: 17
Part 2: The financial performance of organic dairy farms 18
1. Background 18
2. Whole farm incomes 18
2.1 Welsh Farm Business Survey data 18
2.2 Organic Dairy Farm Incomes in England and Wales 2003/04 – 2004/05 19
3. Dairy gross margins 21
4. Costs of production 23
5. Conclusions 24
6. Abbreviations 24
Part 3: Case Studies 25
1. Nick & Matthew Fordham 25
1.1 Farm profile 25
1.2 Cropping strategy 25
1.3 Herd performance 26
1.4 Herd health and fertility 26
1.5 Nutrient budgets 26
1.6 Future plans 26
2. Bill & Sarah Ridge 27
2.1 Farm Profile 27
2.2 Cropping strategy 27
2.3 Herd performance 28
2.4 Herd health and fertility 28
2.5 Nutrient budgets 28
Introduction
“Organic Dairy Farming” is the first of a series organic farming guides commissioned by Organic Centre Wales1.
The information provided addresses the issues relevant to the individual sector, acknowledging the questions
that are frequently directed to the Centre’s ‘Helpline’. In delivering this objective we provide a useful guide to
the individual development farms but additionally a useful document for those with an interest in organic
production and points the way to those who wish to look in greater depth at the issues raised.
This guide is in three interrelated parts. The first part, written principally by Richard Weller of IGER2, deals
primarily with technical issues of grassland and dairy herd management, and provides practical information for
dairy farmers on key factors influencing the performance of the system and also provides options for changing
to alternative strategies. It draws heavily on studies at carried out at IGER’s organic dairy farm, Ty Gwyn, which
have been conducted over a number of years and funded by a number of awards. Ty Gwyn is a Farming Connect
Organic Development Farm and is frequently used to demonstrate good practice.
Part 2 is a review of the financial performance of dairy farming in Wales is provided by Andrew Jackson, of the
Institute of Rural Sciences, University of Wales Aberystwyth. It is based mainly on two DEFRA funded studies:
• Data for organic farms extracted from the main Farm Business Survey in Wales
• A four year project focusing specifically on organic farms, drawing on all Farm Business Survey data
collected for organic farms across England and Wales as well as independently collected data
From these data, it is possible to derive whole farm income data, gross margin and cost of production data to
give an overview of the economics of organic dairy farming in Wales for the latest recorded financial periods
(2004/05)
The third and final part consists of 2 farmer case studies, which put many of the issues discussed in parts 1
and 2 in the context of individual farm businesses. We are grateful for the co-operation of the Fordham and
Ridge families.
1 Organic Centre Wales (OCW) is a partnership of IGER, ADAS Wales, Soil Association, Elm Farm Research Centre and the University of Wales, Aberystwyth and provides information and support for producers, consumers, businesses
Part 1: The experience of IGER Ty Gwyn
Richard Weller - IGER
1. Background
The Ty Gwyn organic dairy farm was established in 1992 and is currently managed to Soil Association
standards. The farm is part of the IGER Trawsgoed research farm and located at 50-80 m above sea level with
an annual rainfall of 1,200 mm. The Grade 3 land has soils ranging from shallow gritty loam soil with a low
available water capacity to deep silty-clay loam soil with higher water retention. Before conversion to organic
management the forage for both grazing and conservation had been based primarily on the production from
perennial ryegrass swards grown with high inputs of fertiliser nitrogen. Crop rotations have now been
established on 80% of the land with permanent pastures maintained on the other 20%. With the exception of
lime which is applied when the soil pH values decline below 5.5, no organic fertilisers have been applied since
1991. In addition to the farming activities on 84 ha, wildlife habitats are provided by 12 ha of woodland and the
1,795 m of hedgerows that have been planted in recent years.
During the winter period the Holstein-Friesian dairy cows are housed in cubicle sheds and the young stock in
straw-bedded yards. In recent years the cows have been inseminated with semen from bulls that have a high
proportion of Friesian genetics. The aim is to breed cows that are more adapted to high-forage diets and also to
increase the longevity of the cows. With the exception of hay that is fed to the young calves, silage is the main
forage fed during the winter to both the dairy cows and young stock.
Since 1992 the research studies at Ty Gwyn have been primarily funded by Defra with additional funding also
obtained from both EU projects and the Farming Connect scheme. In addition to the research studies that have
been conducted, the farm has also been used for Open Days, technical meetings and as a teaching facility for
students.
Currently two contrasting organic dairy systems are being studied at Ty Gwyn. The first is an extensive system
based on self sufficiency and the growing of both the forage and concentrate feeds within the system with the
objective of improving sustainability by achieving a better farm-gate nutrient balance. The second system is
based on home-grown forage and purchased concentrates, with the nutritive quality of the diet meeting the
cow’s requirement and ensuring milk persistency is maintained during the lactation to maximise milk output per
hectare. The results from the two systems and their influence on the management of the farm are discussed in
the sections below.
Organic dairy farming is a complete system from the maintenance of soil fertility through to the marketing of
quality milk products to meet the consumer’s demands. When considering the options for changing any
management practices on the farm the results from Ty Gwyn have shown the importance of evaluating the
whole system rather than looking at only part of the system, as the key system drivers are inter-dependent. For
example in a self-sufficient system increasing the proportion of land allocated to grain rather than forage
production will increase the quantity of concentrate feeds available for the dairy herd but also have a negative
affect on the availability of nutrients for crop production, particularly the quantity of N available via fixation. In a
2. Nutrient budgets and soil fertility
2.1 Whole-farm nutrient budgets
A key objective in the Ty Gwyn systems is to efficiently utilise the available on-farm nutrients for both crop and
milk production and the source of concentrates has a major influence on the whole-farm nutrient budgets. As
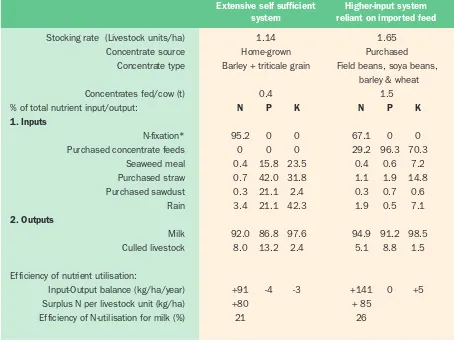
shown in Table 1 the annual surplus of nutrients increases sharply when concentrate feeds are purchased and
fed at a rate of >1.0 t/ha while growing all the feed for the dairy herd (concentrates + forage) on the farm leads
to an annual deficit in both P and K. Purchasing straw also leads to a significant input of K on to the farm. In a
self sufficient system the fixation of N by legumes can contribute up to 95% of the total N-input compared with
only a 67.1% input when significant quantities of concentrate feeds are imported on to the farm. The efficiency
of N-utilisation for milk production was higher (26 v 21%) when concentrates were fed at a higher rate (1.5 v 0.4
tonnes/cow) due to the increased milk yield per cow and a greater portion of the diet being used for milk
[image:5.595.70.524.325.666.2]production.
Table 1. The annual whole-farm nutrient budgets for two contrasting organic dairy systems
(not including young stock).
* Calculated from published fixation rates of 40 (red clover) and 54 kg per tonne DM (white clover) Stocking rate (Livestock units/ha)
Concentrate source
Concentrate type
Concentrates fed/cow (t)
% of total nutrient input/output:
1. Inputs
N-fixation*
Purchased concentrate feeds
Seaweed meal Purchased straw Purchased sawdust Rain 2. Outputs Milk Culled livestock
Efficiency of nutrient utilisation:
Input-Output balance (kg/ha/year)
Surplus N per livestock unit (kg/ha)
Efficiency of N-utilisation for milk (%)
1.65
Purchased
Field beans, soya beans,
barley & wheat
1.5
N P K
67.1 0 0
29.2 96.3 70.3
0.4 0.6 7.2
1.1 1.9 14.8
0.3 0.7 0.6
1.9 0.5 7.1
94.9 91.2 98.5
5.1 8.8 1.5
+141 0 +5
+ 85
26 1.14
Home-grown
Barley + triticale grain
0.4
N P K
95.2 0 0
0 0 0
0.4 15.8 23.5
0.7 42.0 31.8
0.3 21.1 2.4
3.4 21.1 42.3
92.0 86.8 97.6
8.0 13.2 2.4
+91 -4 -3
+80
21
Extensive self sufficient system
2.2 Maintaining soil fertility
Maintaining soil fertility is essential to ensure sufficient nutrients are available for crop production. The main
source of nitrogen within the system is from N-fixation by white clover in both the 5-year leys and permanent
pastures, with additional N-fixation from the red clover plants in short-term leys. The primary strategy for
maintaining the soil P and K indices is to apply the bulk of the slurry to the fields that are cut for silage with
slurry applied both before and after first silage cut. One application of the remaining slurry and farmyard
manure is applied to the perennial ryegrass/white clover leys and permanent pastures that are continuously
grazed throughout the growing season. Soil fertility remains high in the leys that are continually grazed providing
the swards are not overgrazed and a good grass to clover ratio is maintained.
3. Field practices and cropping options
3.1 Establishing leys and other crops at Ty Gwyn
New leys are normally established either in the March-April period or after first cut silage has been taken in late
May. Sowing spring barley as a nurse crop for establishing many of the early sown grass/clover leys leads to a
reduction in the length of the non-productive period between the final harvest/grazing of the previous crop and
the availability of feed from the succeeding crop. Barley is sown at a seed rate of either 150 or 200 kg/ha, with
the lower rate used when the crop is undersown with a grass/clover ley and the higher rate used when the crop
is grown for grain and straw production. In 15 weeks after sowing spring barley produces yields of up to 12.0 t
DM of whole crop and unlike taller growing cereal crops (i.e. oats, triticale) the risk of cereal plants shading the
emerging grass and clover plants is lower. No weeding of the cereal crops post-emergence has been necessary
at Ty Gwyn as the number of weeds germinating each year have been low. Therefore, both the barley nurse crop
and grass/legume seed mixture are sown at the same time rather than at successive sowing dates when the
grass/clover seed is sown after the barley crop has germinated.
An important consideration when new medium-term perennial ryegrass/white clover leys are established is to
ensure an adequate seed rate of up to 35 kg/ha is sown. The establishment of dense swards prevents dock
populations increasing from being a minor problem in the fields to one that affects both the growth and yield of
the grass and legume plants. In many of the seed mixtures intermediate perennial ryegrass varieties with good
ground cover rating (AberGold) and high-sugar content (AberDart) are now being included.
In the Ty Gwyn self sufficient system the following crop rotation has been established:
• Year 1-3 Short-term ley of either (a) Italian ryegrass/hybrid ryegrass/red clover or (b) pure red clover
• Year 4 Winter triticale for grain and straw production
• Year 5 Winter barley for grain and straw production
• Years 6-10 Perennial ryegrass/white clover/herbs
In the system where the concentrate feeds are purchased a crop rotation for producing only forage has been
found to be expensive in relation to forage production costs, fossil energy inputs and the loss of production
while crops are being established. Therefore, the crop rotation is now being replaced by the establishment of
different multi-species long-term leys. The management strategy for the leys is based on three silage cuts per
annum in Years 1-2 followed by primarily grazing the leys in Years 3-10. While perennial ryegrass and white
clover provide the basic constituents in the seed mixture other species have been included with hybrid ryegrass
3.2 Forage production
The standards for organic production require at least 60% forage in the total diet. Forage production for the
dairy herd needs to achieve high yields for both grazing and conservation while aiming for good quality to meet
the cow’s nutrient requirement, especially during the critical early lactation period. The production costs of
different forages also need to be determined to ensure milk production costs are minimised.
Therefore, when different forage crops and mixtures are evaluated at Ty Gwyn the total yield, cost of production
and the nutritive value per tonne DM are determined. Additional factors to be considered are the impact of a
new crop or mixture on the nutrient availability within the whole system and the potential requirement for
additional labour or specialist machinery for sowing, harvesting and storing the crop (e.g. fodder beet
production).
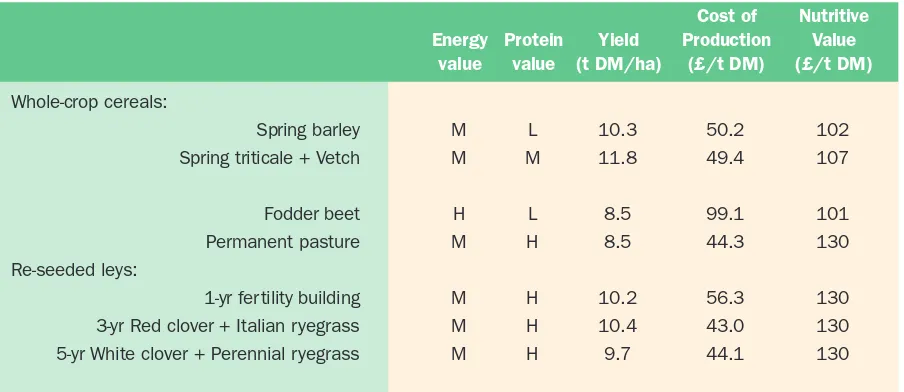
Table 2 shows the comparative cost and nutritive value of different forage crops and mixtures grown at Ty Gwyn.
Included in the calculations are the costs for rent, seed, cultivations, slurry applications, liming and harvesting.
The nutritive value (£/t DM) for each forage has been calculated using the equivalent unit cost of feed energy
(MJ of ME/kg DM) and protein (kg protein/t DM) of purchased organic feeds. The cheapest forage is produced
from grass/clover leys, with the increased cultivations costs but higher yield of the 3-year ley leading to similar
costs per tonne of DM to those of both the lower yielding re-seeded white clover/perennial ryegrass ley and
permanent pasture.
Fodder beet is a high energy forage and an ideal feed for organic dairy herds, with the potential to increase the
energy density of the total diet. However, the high cost of seed, requirement for a number of inter-row
cultivations and the low yield led to high production costs when the crop was grown at Ty Gwyn. The annual
fertility building ley is expensive to grow but produces high yields within a shorter time span than many other
forage crops and has the flexibility to either provide forage or be ploughed in to improve soil fertility for the
[image:7.595.75.527.472.668.2]succeeding crop.
Table 2. Costs of forage production at Ty Gwyn and the nutritive value per tonne of DM.
L, M & H = Low, moderate and high Whole-crop cereals:
Spring barley
Spring triticale + Vetch
Fodder beet
Permanent pasture
Re-seeded leys:
1-yr fertility building
3-yr Red clover + Italian ryegrass
5-yr White clover + Perennial ryegrass
M L 10.3 50.2 102
M M 11.8 49.4 107
H L 8.5 99.1 101
M H 8.5 44.3 130
M H 10.2 56.3 130
M H 10.4 43.0 130
M H 9.7 44.1 130
Cost of Nutritive Energy Protein Yield Production Value
3.3 Grazing strategy
Grazed herbage is the cheapest feed for the dairy cow and a key aim for many organic farmers is to maximise
milk production during the grazing season. To ensure sufficient herbage is continually available at Ty Gwyn the
total area of grass/clover leys and permanent pastures is allocated for grazing and conservation in a ratio of
1:2 (spring), 1:1 (early summer) and 2:1 (late summer). In the autumn all the fields are grazed by the dairy
cows and followers, with sheep lightly grazing the fields only during the November-December period as grazing
after this time reduces the quantity of herbage available for grazing in the following spring. In drier years when
herbage growth is slow in mid-summer big-bale silage is fed as a buffer feed. The grazing period is normally
from April to the end of October but is influenced by both the grass growth and quantity of rainfall in the early
spring and autumn periods.
During the grazing season some concentrate feeds are fed to the higher yielding cows at Ty Gwyn. Other studies
have shown there is an increase in milk yield when grazed herbage is supplemented with concentrates for cows
producing >25 kg/day. Stocking density is an important factor during the grazing season with an increase in
density leading to a higher milk output/ha but lower milk yield/cow. During periods of frequent rainfall there is
better resistance to the potential damage from poaching when dense rather than more open swards are grazed,
irrespective of whether the swards are permanent pastures or well established re-seeded leys of perennial
ryegrass and white clover.
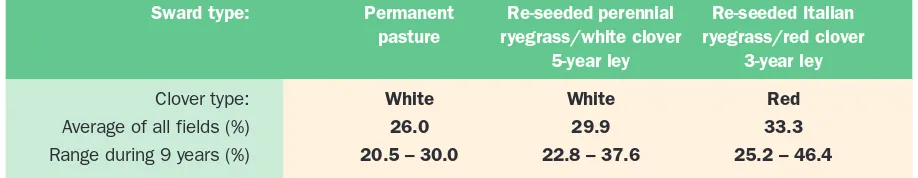
A balanced grazing sward has an average of 25-35% white clover in the total herbage yield. However the average
clover content often varies between seasons due for example to different weather patterns, changes in the
stocking density or the effects of the previous season when a high clover content will increase the availability of
N and stimulate grass growth in the following growing season. Table 3 shows both the average and range of
[image:8.595.68.527.453.542.2]clover % in the permanent pastures and re-seeded leys at Ty Gwyn during a 9-year period.
Table 3. The clover content of the permanent pastures and leys at Ty Gwyn (9-year period).
The dock populations in the field at Ty Gwyn have not increased since the farm was converted. In the more
open short-term leys taking three cuts of silage prevents any viable seed production by the dock plants, with the
grazing swards topped after each grazing rotation has been completed.
To avoid the risk of problems from gastrointestinal parasites in the growing cattle a clean grazing policy is
practiced with all young stock grazed on separate fields from the adult cattle. As the heifers calve at 2-years of
age quality herbage is essential for these animals during the grazing season to ensure satisfactory growth rates
are recorded. When herbage growth is slow (i.e. during dry periods) or quality low (e.g. lush autumn growth) the
feeding of a concentrate supplement is essential to ensure satisfactory growth rates are maintained. Clover type:
Average of all fields (%)
Range during 9 years (%)
White White Red
26.0 29.9 33.3
20.5 – 30.0 22.8 – 37.6 25.2 – 46.4
Permanent Re-seeded perennial Re-seeded Italian pasture ryegrass/white clover ryegrass/red clover
3.4 Silage
The primary objective at Ty Gwyn is to conserve enough silage in the clamps for the 180-day winter period and
depending on the quantity of concentrates to be fed a total of 2.5-3.25 tonnes of silage DM is normally required
per cow. In addition some big-bale silage is made for feeding in the winter period and to provide a buffer feed
when required during the grazing period. Feeding silage during the grazing season to compensate for inadequate
herbage growth ensures milk persistency is maintained, leading to better total lactation yields.
Herbage from the leys is conserved as silage in May, July and September. An 8-week re-growth period is
essential to allow the leys to recover and produce adequate yields at each cut. The evaluation of different
cutting heights has shown that the highest re-growth yields are recorded when the cutting height is at least 10
cm above ground level as this allows the plants to maintain a reserve of carbohydrates that can be used during
the re-growth period. Cutting lower than 10 cm can reduce yields by up to 22%. An inoculant is applied to all the
herbage prior to ensiling to ensure good fermentation is achieved, with adequate rolling and sealing of the
clamps important to minimise waste. At the end of most winters there is normally a reserve stock of clamp
silage left to provide an insurance against a poorer growing season that leads to less total silage for feeding in
the following winter.
The production of 9-15 t DM/ha from short-term 2-3 year leys based on Italian ryegrass, hybrid ryegrass and
red clover make a valuable contribution to both the total forage requirements for the year and the building up of
soil fertility for the succeeding crop. The red clover plants also contribute nitrogen to the swards via fixation and
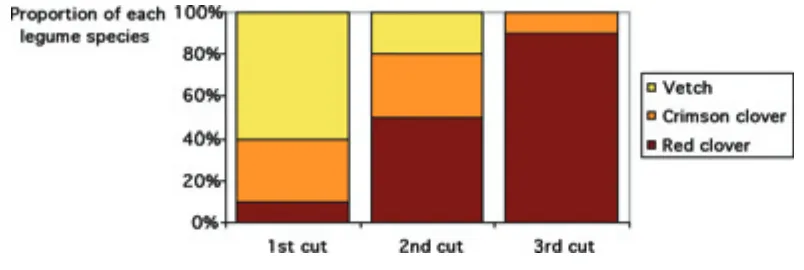
provide extra protein feed. In short-term leys the low protein content in first cut silage can be increased by
sowing Italian ryegrass with three legumes (vetch, crimson clover and red clover) rather than red clover as the
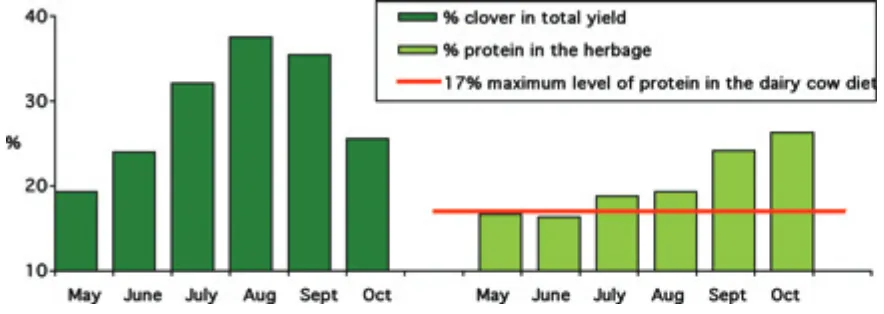
sole legume species. As shown in Figure 1 vetch is the primary legume in May with crimson clover also making
a valuable contribution to the total yield of legumes. By the third cut red clover is the primary legume. This type
of ley produces 5 t DM in 13 weeks after sowing and is a valuable forage source when a long winter leads to a
depletion of the reserve silage stock. While this type of ley is normally grown as a one year crop and leads to
relatively high forage production costs, the results at Ty Gwyn have shown good yields can be achieved in the
[image:9.595.99.501.512.647.2]second year from the remaining red clover and Italian ryegrass plants.
Figure 1. The temporal change in the contribution of legumes to a short-term ley based on Italian ryegrass.
Red clover is also grown as a monoculture in the self sufficient system at Ty Gwyn and the 16-20% protein
content of the red clover increases the protein content of the winter diets and balances the low protein
(10-11%) of the barley and triticale grain. Whether red clover is sown in a mixture or as a monoculture, the leys are
primarily grown for conservation and only grazed in the autumn period. A break of seven years between red
clover leys ensures the potential problem of stem eelworm is avoided. Alsike clover has the potential to tolerate
more acidic and lower fertility conditions than red clover and is also more resistant to stem eelworm. Although
alsike has been successfully established in some of the mixtures at Ty Gwyn, the yield from a pure stand of
Silage is also made from whole-crop cereals, with spring barley sown to provide a higher DM silage (35+%) for
feeding in the winter period with the barley crop cut when the grain reaches the hard-dough stage of ripening.
Whole-crop cereal crops (barley, oats, triticale or wheat) can be readily grown on many farms and as shown in
Table 4 the digestibility of the whole-crop cereals can be improved by raising the cutting height from 10 to 20 or
30 cm above the ground. While this reduces the total yield of the crop, in years when ample quantities of
grass/clover silage are available the increase in the cutting height of the cereal crop provides high quality forage
for feeding in the winter period, particularly if the DM and quality of the grass/clover silage is low. The aerobic
stability of whole-crop cereal silage is often lower than grass silage, therefore the crop should preferably be
ensiled in a long, narrow clamp and once open fed out at a fairly rapid rate. An alternative option is to ensile
[image:10.595.72.523.263.341.2]the whole crop as a layer in a clamp of grass/clover silage.
Table 4. The effect of increasing the cutting height on both the yield and quality of whole-crop cereals.
When the crop is not undersown the quality of the whole-crop forage is improved by sowing a cereal/legume
mixture as the protein content of legumes (18+%) is markedly higher than the protein content found in cereal
plants. As protein is the expensive part of the dairy cow ration the addition of legumes is beneficial in reducing
the quantity of protein that is required from the concentrates in the ration. Successful spring-sown
cereal/legume mixtures have been grown at Ty Gwyn from barley/vetch and oat/vetch mixtures. Triticale/vetch
mixtures have also provided high yields but the later growth of spring triticale, compared with the taller vetch
plants, increases the risk of the crop being more prone to lodging if heavy rain occurs prior to harvesting.
3.5 Forage quality
A range of grass/clover mixtures are grown at Ty Gwyn, from short-term leys based on Italian ryegrass/red
clover to medium-term perennial ryegrass/white clover leys and permanent pastures. Analysis of samples from
these different mixtures has shown that difference in quality between the different swards are mainly
attributable to the stage of growth of both the grass and clover plants and also the ratio of grass to legume in
[image:10.595.77.519.617.774.2]the total yield. Increasing plant maturity leads to a fall in both energy and protein content.
Figure 2. Changes during the growing season in the proportion of clover in the sward and the protein content
of the mixed herbage of grass + white clover. Spring barley (Year 1)
Spring barley (Year 2)
Spring oats
71.9 73.2 75.0 100 92.3 83.6 36.3
69.8 73.5 77.5 100 91.4 81.5 41.4
55.0 57.1 59.1 100 90.4 80.4 37.2
Digestibility % Loss of DM yield (%) Crop 10 20 30 10 20 30 DM%
Cutting height
In both re-seeded leys and permanent pastures the major change during the growing season is the changing
protein content of the sward as the growing season progresses. As shown in Figure 2 the average white clover
content in a sward increases from spring until mid summer and then decline. The increasing clover in the sward
leads to progressively higher protein contents in both the grass and white clover plants. From late June onwards
the increasing protein leads to excess nitrogen in the diet of the dairy cow and poor efficiency of nitrogen
utilisation by the dairy cow unless the diet is supplemented with a high energy/low protein feed (e.g. cereal
grain). In some individual swards the clover content can increase to over 65% by mid summer.
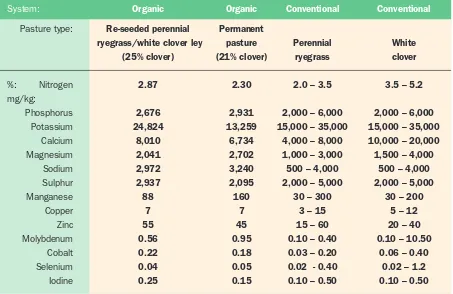
In Table 5 the mineral concentrations of the herbage from two organic fields at Ty Gwyn have been compared
with published mineral ranges for grass and white clover herbage grown on conventional farms (Whitehead,
2000). All the mineral concentrations from the Ty Gwyn field are within the ranges published for conventional
[image:11.595.73.526.291.585.2]herbage, with a number of minerals having concentrations at the lower end of the range values.
Table 5. A comparison of the mineral composition of organic fields with published conventional values.
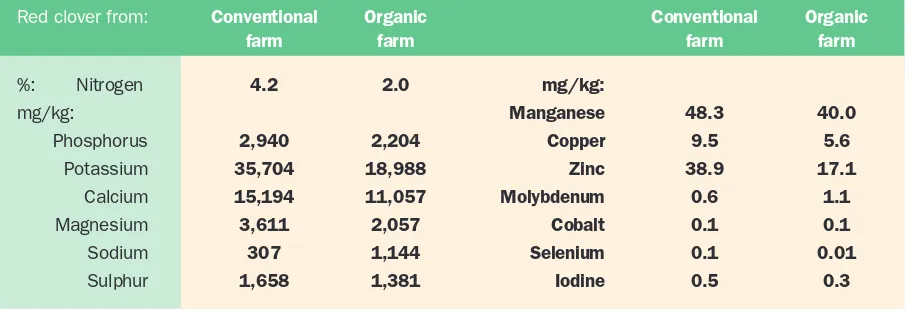
The difference between the mineral concentration in red clover crops grown on adjacent conventional and
organic dairy farms is shown in Table 6. The red clover was from the first silage cut taken in early June. As
shown by the high potassium value the conventional red clover sward was grown on an intensive dairy farm with
a high stocking rate and the crop received significantly higher applications of slurry pre-cutting than the organic
red clover sward. The calcium, magnesium and zinc concentrations were also higher but sodium markedly lower
in the conventionally grown red clover. The composition of the slurry from the two farms was different as the
conventional farm purchased all the concentrate feeds (1.8 t/cow) and fed a mineral supplement to the cows
compared with home-grown concentrates (0.4 t/cow) and seaweed meal on the Ty Gwyn organic self sufficient
system
Pasture type:
%: Nitrogen
mg/kg:
Phosphorus
Potassium
Calcium
Magnesium
Sodium
Sulphur
Manganese
Copper
Zinc
Molybdenum
Cobalt
Selenium
Iodine
Re-seeded perennial Permanent
ryegrass/white clover ley pasture Perennial White
(25% clover) (21% clover) ryegrass clover
2.87 2.30 2.0 – 3.5 3.5 – 5.2
2,676 2,931 2,000 – 6,000 2,000 – 6,000
24,824 13,259 15,000 – 35,000 15,000 – 35,000
8,010 6,734 4,000 – 8,000 10,000 – 20,000
2,041 2,702 1,000 – 3,000 1,500 – 4,000
2,972 3,240 500 – 4,000 500 – 4,000
2,937 2,095 2,000 – 5,000 2,000 – 5,000
88 160 30 – 300 30 – 200
7 7 3 – 15 5 – 12
55 45 15 – 60 20 – 40
0.56 0.95 0.10 – 0.40 0.10 – 10.50
0.22 0.18 0.03 – 0.20 0.06 – 0.40
0.04 0.05 0.02 - 0.40 0.02 – 1.2
0.25 0.15 0.10 – 0.50 0.10 – 0.50
Organic Organic Conventional Conventional
Table 6. A comparison between the mineral concentration of red clover plants grown on conventional and
organic farms.
3.6 Cereal crops for the production of grain and straw at Ty Gwyn
Both barley and triticale have been grown as grain crops at a seed rate of 200 kg/ha with soil fertility primarily
provided from the previous grass/clover leys. Following an application of slurry or farmyard manure before
ploughing, winter triticale is grown in the first year followed by a crop of winter barley in the second year.
Growing two cereal crops in succession is only viable if the soil fertility of the fields has been improved by the
preceding crop. The barley ripens in August and allows a grass/clover ley to be sown and become well
established before the winter period. A typical range in the grain yields from the cereal crops are 2.33-3.07
(spring barley), 3.78-4.45 (winter barley) and 4.27-5.49 t/ha (winter triticale). Analysis of the triticale grain has
shown the average digestibility, starch and protein concentrations to be higher than those found in the barley
grain: 91.3 v 87.5, 64.8 v 58.9 and 11.9 v 11.1%.
Although oats have been successfully included in the dairy cow diets problems have occurred in the growing of
the crop as Ty Gwyn is located in a grassland area with few other cereal crops grown in the locality. Large
numbers of rooks have caused extensive damage to the crop at sowing and also when the crop reaches the
grain ripening stage. Barley crops are less attractive to rooks than oats but damage still occurs in the 3-4 week
period before combining when the cereal is grown during drier seasons and the rooks are desperate for food.
Minimal damage has occurred with triticale crops.
Crimped grain is an alternative option for some farms and at Ty Gwyn crimping provided a quality feed that was
palatable to the cows. Cereal crops for crimping are cut 3-4 weeks earlier than for normal dry grain and the
earlier harvest is beneficial for winter cereals as there is still time to establish another crop before the start of
the winter period. %: Nitrogen
mg/kg:
Phosphorus
Potassium
Calcium
Magnesium
Sodium
Sulphur
4.2 2.0 mg/kg:
Manganese 48.3 40.0
2,940 2,204 Copper 9.5 5.6
35,704 18,988 Zinc 38.9 17.1
15,194 11,057 Molybdenum 0.6 1.1
3,611 2,057 Cobalt 0.1 0.1
307 1,144 Selenium 0.1 0.01
1,658 1,381 Iodine 0.5 0.3
Conventional Organic Conventional Organic farm farm farm farm
4. The management and performance
of the organic dairy cow
4.1 Feeding the dairy cow
A negative energy balance occurs with many dairy cows during the first few weeks of lactation as milk
production increases at a faster rate than feed intake. Organic diets are based on feeding a minimum of 60%
forage in the total diet and the results from trials at Ty Gwyn have shown that the biggest challenge is to
[image:13.595.110.473.265.384.2]provide sufficient energy for the cows during the early and mid-lactation periods.
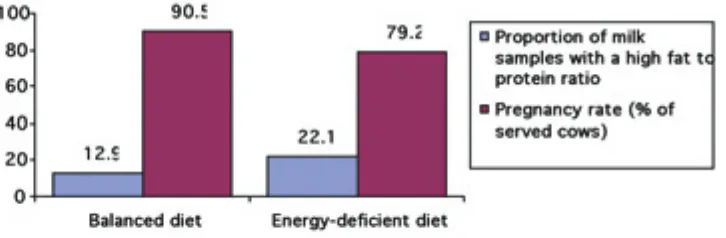
Figure 3. The importance of energy in the diet to maintain good milk quality and efficient reproductive
performance.
Work in Austria and Denmark also supports the view that energy is the main limiting factor in herd performance.
Therefore, it is important to produce high-quality forage that will minimise the energy deficit during this period.
As shown in Figure 3 a balanced diet leads to fewer monthly milk samples having both low protein values and a
high fat to protein ratio, with reproductive performance is also significantly improved. Sub-clinical ketosis has
been identified as a problem in herds where the energy diet is low and the milk fat to protein ratio high.
Feed protein supply in dairy cow diets can also be erratic during the year. In May 60% of the annual silage
requirements for Ty Gwyn is made from first cut, providing high quantities of silage but with protein contents
<15% due to the later spring growth of legumes compared with grasses. The option of delaying taking first-cut
silage can improve the protein content of the silage but also increases the risk of poor herbage re-growth and
low silage stocks in dry seasons. Higher proteins at second and third cuts (16-20%) and the growing of pure red
clover swards both increase the protein content of the total silage stocks and compensate for the lower protein
content in the May-cut silage.
Total annual feed intake for the dairy cow is 6-6.5 tonnes DM and in the self sufficient system at Ty Gwyn the
between-season variations in climatic conditions have a marked influence on the sustainability of the system.
With 17% of the total land area allocated to growing grain crops to produce 0.4-0.7 t of grain/cow, there is a
requirement to reduce the stocking density to below 1.2 cows/ha to ensure sufficient forage (i.e. 5.3-6.1 t
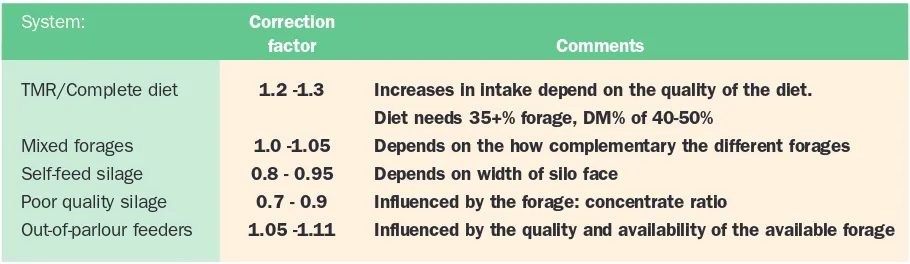
DM/cow) is available annually for grazing and conserving as silage. Silage intake in the winter period can vary
and is not always correlated to silage quality as the type of feeding system has an effect on the quantity of feed
consumed by the cow. Table 7 includes the correction factors published by Chamberlain & Wilkinson (1998) and
Table 7. The potential effect of the winter feeding system on feed intake.
The mineral content of a ration is important for the dairy cow and seaweed meal is added to the silage-based
diets at Ty Gwyn during the winter period. To increase the quantity of minerals in the diet chicory, plantain, salad
burnet and yarrow have been included in many of the 5-year leys based on perennial ryegrass and white clover.
Compared with grass and white clover plants both the chicory and plantain plants have higher mineral
concentrations, however, their contribution to the diet is limited by their failure to persist when grown in a
mixture with the grass and clover. The alternative option of establishing herb strips reduces the competition
from the grass and clover plants but also increases the risk of dock populations causing problems as the
swards are more open and the herb species less able to compete against the more aggressive dock plants.
When diets for the dairy cow are formulated energy, protein and minerals are often the primary factors to be
balanced. However, the quantity of fibre on the diet is also important. The dairy cow requires a minimum of
35-40% fibre in the diet. In a grazing sward grass plants have an adequate fibre content of 40-45%, but the fibre
content of white clover is <25%. When cows graze clover-rich but low fibre swards the fat content of the milk
can decline to 3.6% unless long-fibre forage is also offered to the cows.
4.2 Changes in the organic feed standards
The removal of the non-organic feed allowance will increase the cost of milk production for many Welsh farmers.
For farms able to grow combinable crops (e.g. crimped grain) the option of producing home-grown concentrates
may be financially viable. However, for those farming under less favourable climatic conditions and dependent
on purchased concentrate feeds (e.g. high-protein feeds, sugar beet) the options are limited. For these farms
some of the cropping options outlined above may increase the energy and protein quality of the forage
component of the diets and reduce the quantity of concentrates required to balance the diets.
Feeding 100% forage diets is an option being considered on some farms to avoid any increase in feed costs but
removing concentrate feeds completely from the diet raises four key points:
• The variability in quality is greater in forages than concentrate feeds
• Will an all-forage diet of high quality provide sufficient energy and protein for the cow in early lactation ?
• Will the cow consume enough forage (e.g. on winter silage-based diets) ?
• Yield per cow is likely to be lower and overhead costs per kg of milk higher
4.3 Calving season options
The month of calving can have a marked effect on both the performance of the herd and milk production costs. TMR/Complete diet
Mixed forages
Self-feed silage
Poor quality silage
Out-of-parlour feeders
1.2 -1.3
1.0 -1.05
0.8 - 0.95
0.7 - 0.9
1.05 -1.11
Increases in intake depend on the quality of the diet.
Diet needs 35+% forage, DM% of 40-50%
Depends on the how complementary the different forages
Depends on width of silo face
Influenced by the forage: concentrate ratio
Influenced by the quality and availability of the available forage
Correction
factor Comments
seasonality/dual pricing scheme that is implemented by the milk buyer as there may be a substantial reduction
in the price of milk being produced in the spring/early summer period.
Block calving when 90% of cows calve within a short period (e.g. 8 weeks) requires the feeding of high-energy
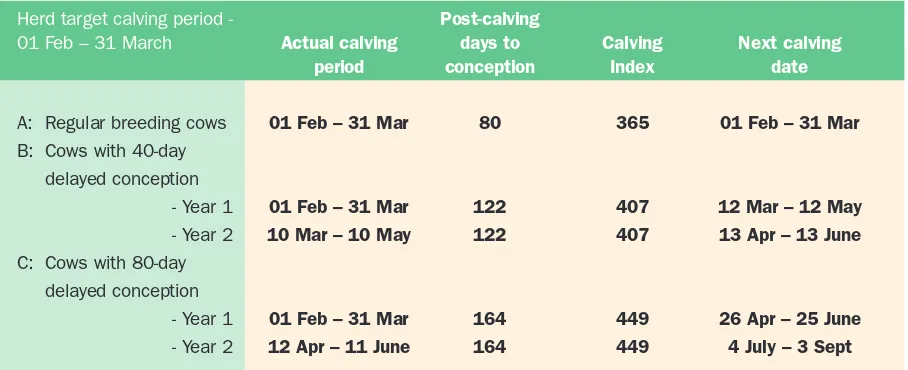
diets in early lactation, good oestrus detection and high conception rates in early lactation. Table 8 shows the
effects on a spring block-calving herd when conception is delayed by 42 and 84 days (i.e. 2 and 4 oestrus
cycles), with a failure to conceive within the target period leading to a longer calving interval and critically for
some producers a different milk production profile. Over a 2-year period the accumulated effect of delayed
conception significantly changes the calving pattern from the pre-turnout period to late summer when peak yield
will not be reached until the August/September period. Delayed conception also reduces the herd average
yield/cow/day and potentially increases feed cost for those cows calving in the late summer period when the
[image:15.595.72.526.290.475.2]availability of grazed herbage is lower.
Table 8. The effect of delayed conception on both the calving period during the year and calving interval.
Suitable calving season options when milk buyers require a level monthly production of milk are year-round
calving or two block calving periods in the spring and autumn, however, the latter option may complicate the
management of the farm. Both these options also provide a more consistent milk quality profile throughout the
year. Year-round calving leads to a more even workload during the year but cows calving from mid-summer until
the end of the grazing season may produce low yields unless the declining availability and quality of the grazed
herbage is supplemented with extra feed (e.g. concentrates, high-quality forage).
4.4 Herd performance and breed selection
Table 9 shows the results from the two Ty Gwyn systems with the Holstein-Friesian cows efficiently converting
forage into milk when very high forage diets are fed. Increasing the level of concentrate inputs from 0.08 to
0.26 kg/litre of milk led to a significant increase in yield but sharply reduced the quantity of milk being produced
from forage.
A: Regular breeding cows
B: Cows with 40-day
delayed conception
- Year 1
- Year 2
C: Cows with 80-day
delayed conception
- Year 1
- Year 2
01 Feb – 31 Mar 80 365 01 Feb – 31 Mar
01 Feb – 31 Mar 122 407 12 Mar – 12 May
10 Mar – 10 May 122 407 13 Apr – 13 June
01 Feb – 31 Mar 164 449 26 Apr – 25 June
12 Apr – 11 June 164 449 4 July – 3 Sept
Post-calving
Actual calving days to Calving Next calving period conception Index date
Table 9. The performance of cows fed different levels of concentrate feeds during lactation.
Irrespective of the quantity of concentrates fed the average productive life of cows in both the Ty Gwyn systems
is low compared with the Friesian cows that were in the original herd. The main reasons for cows being culled
are infertility and lameness, with some cows also culled due to persistently high cell counts. To extend the
longevity of the two herds the cows are now inseminated with semen from bulls with a high proportion of
Friesian genetics. Alternative options under consideration are crossing the cows with another breed (e.g. Jersey)
to gain the advantages of heterosis or changing to an alternative native breed.
As the milk yield from cows of a similar bodyweight declines a higher proportion of the total feed intake is used
for maintenance rather than milk production (Figure 4) and these lower-yielding cows are less efficient
converters of feed into milk. However, a comparison between large-framed Holstein cows and Jersey cows with
a smaller feed requirement for maintenance has shown both breeds to have similar feed-into-milk conversion
rates. In addition the reduced feed conversion efficiency of lower yielding cows is often balanced by a reduction
in health and fertility problems and also increased longevity, which reduces both the culling rate and herd
replacement costs. Compared with high genetic merit Holstein cows, other lower yielding breeds and cross
breeds have the potential when fed high-forage diets to produce quality milk, breed regularly and maintain the
appropriate body condition during lactation without the requirement for significant quantities of concentrates in
the diet.
The cost per litre increases sharply as culling rates increase and the number of replacements required annually
for the herd increases. Milk income is also likely to be lower when a heifer replaces a mature cow in the herd.
In addition to producing milk and becoming pregnant, a heifer calving at 2-years old will also grow during the
lactation period. At Ty Gwyn the total lactation yield of first-lactation heifers has been between 75-79% of the
yield produced by the mature cows in the herd, leading to a potential loss of milk income of £236-337/cow.
Figure 4. The relationship between milk yield per cow and the efficiency of feed conversion (Haiger, 2000)
and also the cost implications of different culling rates. Concentrates fed/litre of milk (kg)
305-day milk yield/cow (kg)
Yield of milk fat + protein (kg)
% of milk produced from forage
Efficiency of feed conversion into milk
(MJ of milk per MJ of feed)
0.26
6,967
458
46.5
0.41 0.08
5,867
396
83.1
0.37
Extensive self sufficient system
[image:16.595.84.501.639.779.2]4.5 Herd health
The incidence of different health events varies markedly between herds and is influenced primarily by
differences between farms in standards of livestock husbandry, environmental conditions (e.g. length of the
winter housing period; straw yards or cubicle housing) and the suitability of the type of cow for an individual
system. The maintenance of a closed herd also minimises the risk of disease problems in the herd.
Compared with many conventional herds the number of cases of both lameness and clinical mastitis has been
found to be lower at Ty Gwyn. The lower incidence of lameness recorded at Ty Gwyn and in other organic herds
is attributed to the feeding of diets that are higher in forage content and lower in protein content.
As long-acting antibiotics are not used at the end of the lactation a key challenge for some herds is to ensure
the level of somatic cell counts in the milk remain low, especially if clinical mastitis from Staphylococcus aureusoccurs in the herd. Good parlour hygiene, the grouping and milking of high-cell count cows last and the
culling of cows with persistent high cell counts all contribute to reducing the average cell count in the herd.
The level of cell counts in the milk is important as high cell counts lead to:
• Lower milk production per cow
• Reduced shelf life of liquid milk
• Reduced milk casein and fat content
• Longer clotting times, reduced curd firmness and up to 10% lower yields during cheese making
• Poorer fermentation during yoghurt making
A number of alternative therapies have been tried at Ty Gwyn with some success in temporarily lowering cell
count levels but no longer-term benefits have been recorded. The winter housing of cows in straw yards rather
than cubicles can lead to an increased incidence of mastitis but depends on the management strategy of the
straw yards, including the frequency of adding fresh straw, time period between the removal of manure from the
yard, bedding area per cow and type and cleanliness of the cubicles.
Mineral supplementation from seaweed meal and rock salt in the winter silage-based diets and the mineral
contribution from different plant species during the grazing season ensure mineral supply is normally adequate
for the cows at Ty Gwyn. No cases of hypomagnesaemia have been recorded at Ty Gwyn and with the exception
of both selenium and iodine shortage during two grazing seasons, the incidence of health problems related to
5. Acknowledgements
Since the conversion of the farm Peter Bowling has been responsible for undertaking both the sampling
routines and the collection and collation of data from the farm. The input of all the farm staff involved in the
different tasks at Ty Gwyn, including the field operations and the feeding of the dairy cattle, is acknowledged
with special thanks to Huw Morris and Alun Lloyd for managing the Ty Gwyn herd.
6. References
Chamberlain A T & Wilkinson J.M (1996). Feeding the dairy cow. Published by Chalcombe Publications, Lincoln,
UK. 241 pages
Haiger A (2000) Lifetime dairy performance as breeding aim. Proceedings of the 13th IFOAM Scientific
Conference‘The world grows organic’. Eds – Alfoldi T., Lockeretz W. & Niggli U. pp.316-319.Basel, Switzerland.
Whitehead D C (2000) Nutrient elements in grassland: Soil-Plant-Animal relationships. Published by CABI
Publishing, Wallingford. 384 pages.
7. Suggested further reading:
British Grassland Society (2004) Organic farming: Science and practice for profitable livestock and cropping.
BGS Occasional Symposium No.37. Joint BGS/AB/COR 2004 Conference.
Nicholas P K, Padel S, Cuttle S P, Fowler S M, Hovi M, Lampkin N H & Weller R F (2004) Organic dairy
production: A review. Biological Agriculture and Horticulture22: 217-249.
Underwood E J & Suttle N F (1999) The mineral nutrition of livestock. Published by CABI Publishing,
Wallingford. 614 pages.
Weller R F & Cooper A (2001) Seasonal changes in crude protein concentration of white clover/perennial
ryegrass swards grown without fertiliser N in an organic farming system. Grass and Forage Science. 56:92-95.
Weller R F & Bowling P J (2004) The performance and nutrient use efficiency of two contrasting systems of
Part 2: The financial performance of organic dairy farms
1. Background
The organic milk market has been changeable over the past five years. Poor conventional prices in 1999/2000
saw many producers convert to organic production to realise higher premiums for organic milk. However, the
demand for organic milk was lower than the increasing supply as a large number of farmers achieved organic
status in 2001/02 leading to a fall in price. Subsequent price reductions occurred as organic milk was sold
onto the conventional liquid market, which in turn, was faced with falling producer prices. Nevertheless, the
organic milk market has strengthened and improved significantly since autumn 2004 with some producers
receiving up to 26 ppl for their organic milk. The more buoyant market situation for organic dairy farmers is
much needed, especially as the previous years have seen tougher times for those organic producers that
converted to organic production in search of better farm incomes.
To understand further the financial performance of organic dairy farming, there are two key sources of financial
performance data available for organic dairy farms in Wales, one from organic farms extracted from the main
Farm Business Survey in Wales and the other from a DEFRA funded four year project that specifically surveys
the financial performance of organic farms and is an amalgamation of all Farm Business Survey data collected
for organic farms across England and Wales as well as independently collected data, again using farm business
survey methodology. From these data, it is possible to derive whole farm income data, gross margin and cost of
production data to give an overview of the economics of organic dairy farming in Wales for the latest recorded
financial periods.
2. Whole farm incomes
2.1 Welsh Farm Business Survey data
Data from two samples of organic dairy farms were extracted from the main Farm Business Survey data in
Wales for the financial periods 2003/04 to 2004/05 (Table 1). The results for all farms (mainly conventional) in
the survey are shown alongside the organic farm data to provide a comparison. For both financial years, the
conventional farms performed better on a wholefarm and net farm income basis overall compared to the
organic farms.
The results show that the organic farms performed similarly from 2003/04 to 2004/05 achieving net farm
incomes of £215/ha and £212/ha, respectively. As the farms are not based on identical samples, it is not
possible to make comparisons between these datasets. However, it should be noted that in 2003/04, the
conventional farms stocked at 2.2 LSU/ha and carried 143 dairy cows compared to a stocking rate of 1.7
LSU/ha and 99 dairy cows for the organic farms. Conversely in 2004/05, the organic farms were stocked at
2.0 LSU/ha and carried 156 cows on average compared to the main survey farms, which were stocked at 2.1
LSU/ha with 132 dairy cows milked on farm.
A key reason for poor organic farm performance shown by these two datasets is due to the low premium
received for organic milk in comparison to the conventional milk price at less than a penny per litre for both
financial periods. As cows managed within organic systems tend to produce less milk per cow, at a lower
stocking rate, and are fed more expensive organic concentrates, poorer farm performance is to be expected
without a premium for organic milk that matches the extra costs associated with organic farming systems.
Previous studies have indicated that a premium of ca. 5 ppl is needed for organic farmers to achieve similar
results to conventional – in these samples, an additional 4 ppl would have added £214 and £286 to net farm
Table 1. Average net farm income for organic and conventional alldairy farms (FBS 2003, 2004)
2.2 Organic Dairy Farm Incomes in England and Wales 2003/04 – 2004/05
Identical samples of organic dairy farms were monitored during the financial periods 2003/04 to 2004/053.
This financial data was recorded using Farm Business Survey methodology. In total, a sample of 14 lowland and
five LFA organic dairy farms in England and Wales were derived from this dataset.
2.21 Lowland dairy farms (identical farm samples)
For this farm type, the identical sample of organic farms were based in England and Wales where one farm was
located in Northern England, six in the South West region and two from Central and Eastern England and five in
Wales. From this sample of organic farms, net farm incomes decreased from £357/ha in 2003/04 to £262/ha
in 2004/05. Milk prices decreased marginally during this period. A key aim of this research is to match
conventional farm data from the main Farm Business Survey data to derive comparable conventional farm data
for each organic farm. In 2004/05, the organic farms performed better with net farm income 13% higher for
organic farms in 2004/05 compared to £232/ha for conventional farms. Nevertheless, it should be noted that
during this financial period, the organic farms managed 25% more cows on a greater area in comparison to the
comparable conventional farms. Moreover, the organic farms increased their herd size by 10% from 2003/04 to
2004/05 and incorporated more area into their total farm area overall. In contrast, the comparable farm size
and herd size remained similar between these financial periods. As a result, stocking rates increased slightly for
organic farms from 1.4 to 1.5 LSU/ha in contrast to the comparable farms which decreased slightly from 1.7 to
1.6 LSU/ha.
Number in survey 9 46 9 58
Milk yield (l/cow) 5233 6445 5326 6190
Milk price (ppl) 19.55 18.22 19.14 18.24
No. of dairy cows 99 143 156 132
Size (ha) 93 102 114 94
Values (£/ha)
Dairy output 1098 1674 1400 1609
Other output 339 448 383 450
Total outputs 1436 2122 1783 2059
Feeds 305 478 381 441
Other livestock costs 111 182 170 193
Crop costs 31 138 61 123
Whole farm margin 990 1324 1171 1301
Labour 259 328 328 320
Machinery 164 213 199 211
Other fixed costs 352 450 431 474
Total inputs 1222 1788 1571 1763
Net Farm Income 215 334 212 295
2003/04 2004/05
The identical dataset for the lowland organic dairy farms indicates that costs increased for all cost categories in
2004/05 with the exception of feed costs on a per hectare basis. However, homegrown concentrate useage did
increase on a £ per farm basis, which effectively offset some of the reduction in purchased feed costs.
In terms of business stability, the organic farms maintained a positive return on both tenants and all associated
farming capital of 8.4% and 4.5%, respectively. However despite a positive return, the external liability status for
the identical farm sample increased slightly overall with the average overdraft facility increasing from £34,451
to £43,830 from 2003/04 to 2004/05 indicating that there were insufficient returns at the current milk price
[image:21.595.72.524.247.548.2]level to reduce liabilities whilst enabling capital investment into the business.
Table 2. Average net farm income for organic and conventional lowland dairy farms (UWA, 2006)
* Comparable conventional farms selected on the basis of similar resource endowments to individual organic
farms
2.22 LFA dairy farms (identical farm samples)
For this farm type, it was possible to derive financial data for an identical sample of five organic dairy farms,
where one farm was located in Northern England with the remaining four located in Wales (Table 3.). Here, net
farm incomes increased slightly from 2003/04 to 2004/05 to £178/ha from £173/ha. Milk prices decreased
marginally during this period. In 2004/05, the conventional farms performed better on a net farm income basis
than the organic farms by 24% at £220/ha with 40% more cows on a smaller farm area in comparison to the
organic farms by 12%. Stocking rates increased slightly for organic farms from 1.5 to 1.6 LSU/ha and remained
at 1.7 LSU/ha for the comparable farms during these financial periods.
In general, costs increased for all cost categories in 2004/05 for the organic farms with the exception of other
livestock costs which decreased slightly on a per hectare basis. Outputs increased slightly for both dairy and
other output categories. Similarly, costs increased for the comparable conventional farms.
Number in survey 14 14
Milk yield (l/cow) 5892 6074 5901 6087
Milk price (ppl) 20.3 17.8 20.5 17.9
No. of dairy cows 126 113 139 111
Size (ha) 124 113 130 116
Values (£/ha)
Dairy output 1187 1111 1204 1095
Other output 518 676 439 653
Total outputs 1705 1786 1643 1749
Feeds 281 342 252 308
Other livestock costs 152 159 174 167
Crop costs 50 173 52 140
Whole farm margin 1221 1111 1164 1134
Labour 205 235 218 227
Machinery 267 279 279 277
Other fixed costs 392 387 406 399
Total inputs 1347 1575 1381 1517
Net Farm Income 357 211 262 232
2003/04 2004/05
A key difference between the lowland and LFA organic dairy farm datasets is the difference in milk price
received. It would appear that more lowland farms were able to sell a greater proportion of their milk to the
organic market to achieve an average milk price of 20.5 ppl in 2004/05 compared with 18.7 ppl for the LFA
identical organic farm sample. As a result, the effect on business stability for the LFA organic dairy farms is
negative in terms of achieving zero or negative returns on capital associated with the farm business, whilst the
comparable farms for this farm type were able to derive a positive return on both tenants and all associated
farming capital, albeit at a low rate of 2.4% and 1.3%, respectively. With a poor return on capital invested, the
[image:22.595.74.522.233.535.2]external liability status for the identical organic farm sample remained unchanged for this financial period.
Table 3. Average net farm income for organic and conventional LFA dairy farms (UWA, 2006)
* Comparable conventional farms selected on the basis of similar resource endowments to individual organic
farms
3. Dairy gross margins
The gross margin performance for dairy herds is improved under conventional management than for those
herds managed organically at present according to the latest 2004/05 Farm Business Survey data derived from
farms located in Wales only. In 2003/04, gross margins were similar under both organic and conventional
production as organic farms were able to command a better premium on organic milk at 19.55 ppl compared to
19.14 ppl in 2004/05. As a result, the erosion of the price premium for this sample of organic farms in
comparison to dairy gross margins from the main survey farms has resulted in lower gross margins achieved
Number in survey 5 5
Milk yield (l/cow) 5040 5361 4929 5543
Milk price (ppl) 18.8 16.6 18.7 16.4
No. of dairy cows 70 113 79 111
Size (ha) 91 83 92 82
Values (£/ha)
Dairy output 777 753 831 784
Other output 440 537 508 567
Total outputs 1217 1290 1338 1350
Feeds 223 269 257 253
Other livestock costs 84 113 77 128
Crop costs 19 85 26 85
Whole farm margin 892 823 977 885
Labour 132 107 147 111
Machinery 243 202 284 230
Other fixed costs 344 291 368 324
Total inputs 1045 1068 1160 1130
Net Farm Income 173 222 178 220
2003/04 2004/05
This trend is replicated in the latest Organic Farm Income report covering the 2003/04 and 2004/05 financial
periods4. Here, gross margin data including forage costs for organic farms was £810/cow in 2003/04 with
milk yields averaging 5,699 litres per cow with the average organic milk price recorded at 21.05 ppl whereas in
2004/05, the gross margin (including forage costs) value fell to £738/cow with milk yields averaging at 5,240
litres per cow and milk price falling to 19.35 ppl on average. These datasets are not based on identical
samples. This equates to slightly better gross margin performance in comparison to the conventional FBS gross
margins shown below.
A simple sensitivity analysis to determine the effect of an increase in organic milk price to 26 ppl was carried
out using the Welsh Farm Business survey organic dairy gross margin data. At this level of price premium, the
gross margin excluding forage is significantly higher than the current gross margin level. For instance in
2004/05, the organic dairy gross margin could be expected to be in the region of £1068/cow, which is 52%
[image:23.595.77.524.304.607.2]higher than at the current level of gross margin per cow achieved on farm.
Table 3. Organic and conventional dairy gross margins (Source: Farm Business Survey, UWA)
Sample No. 9 81 9 65
Milk yield (litres/cow) 5,233 6,431 5,326 6,188
Milk price (ppl) 19.55 18.06 19.14 18.15
Values (£/cow)
Financial output 1,028 1,160 1,058 1,165
Purchased feed 207 241 200 231
Other costs 95 122 155 155
Total variable costs 302 363 354 386
Gross margin 726 797 703 780
at conventional prices 648 - 650
-with organic premium (26 ppl) 1064 - 1068
-Forage costs 68 96 75 88.86
GM inc forage (£/cow) 659 700 628 691
Assumed stocking rate* 1.6 2.2 1.6 2.2
GM inc forage (£/ha) 1054 1541 1005 1520
with organic premium (26ppl)
GM inc forage (£/ha) 1702 - 1707
-2003/04 2004/05
Organic Conv Organic Conv
4. Costs of production
The cost of producing a litre of organic milk is an important consideration for the financial performance of
organic dairy farms. The Welsh Farm Business Survey has recorded the cost of production for organic milk at
14.64 ppl, with the top 5 (low cost group) producing milk at 13.67 ppl in 2003/04 (Table 4). It is important to
note that these costs exclude imputed costs such as family labour, imputed rent (rental equivalent) and interest
on tenant’s capital. In addition, fixed costs are split on a livestock unit basis. For calculating milk costs, the
livestock proportion relates to the dairy cows alone and excludes youngstock or heifers in rear. As a result, fixed
costs of production associated with the dairy enterprise can be diluted. Using the same methodology for
calculating costs of milk production, but with the inclusion of imputed costs, these being: family labour, imputed
rent (applicable for owner-occupied land) and interest on tenants capital (notional interest value excluding actual
interest paid); the results from the DEFRA organic farm income survey indicate that the total cost of production
for milk in 2003/04 was 20.92 ppl and 19.69 ppl for the top 5 group. For the whole group, the price received
[image:24.595.74.523.325.769.2]for milk was marginally below the cost of production.
Table 4. Organic and Conventional dairy gross margins (Source: Farm Business Survey, UWA)
Milk production costs Welsh FBS Organic farms DEFRA organic survey (E&W)
- pence per litre All farms Top 5 All farms Top 5
2003/04 2003/04
Number of farms 9 5 10 5
Feed 3.95 3.88 3.91 3.36
Veterinary and medicines 0.41 0.45 0.45 0.34
Other livestock costs 1.41 1.59 1.65 1.42
Forage 1.17 1.12 0.92 1.01
Total variable costs 6.94 7.04 6.94 6.13
Herd replacement 0.88 0.57 0.62 0.78
Labour 1.83 1.27 1.36 0.70
Power and machinery 1.92 1.88 2.35 1.97
Buildings 0.77 0.67 0.50 0.90
General farm costs 1.59 1.46 2.12 1.91
Rent 0.50 0.64 0.92 1.06
Finance 0.21 0.14 0.65 0.45
Total overhead costs 6.82 6.06 7.90 7.00
Total costs 14.64 13.67 15.46 13.90
Margin 4.34 6.41 6.73 8.44
Margin over concentrates ppl 15.68 15.74 16.92 17.81
Milk price received (p/litre) 19.55 19.62 20.84 21.17
5. Conclusions
There is now significantly more data available to determine the financial performance of organic dairy farming in
Wales. The latest data based on the financial periods from 2003/04 to 2004/05 indicates that the profitability
of organic dairy farming at that time was marginal in comparison to conventional milk production. The Welsh
Farm Business Survey data indicates that conventional dairy farming was more profitable than organic dairy
farming; however, the organic milk price premium received was negligible for this sample. The identical organic
farm sample based on farms located across England and Wales indicates slightly better net farm incomes
compared to conventional farms, but this was based on managing more cows on a greater area and receiving a
greater milk price premium of 2.6 ppl above conventional price. Organic dairy farming in less favoured areas
(LFA’s) appeared economically unsustainable at the then organic milk price of 18.7 ppl for this farm sample.
With the recent strong increases in demand and prices for organic milk, this situation is likely to be transformed
in 2005/6 for those producers with access to organic outlets.
The dairy gross margins derived from the Welsh Farm Business Survey indicate that conventional farmers were
able to achieve better gross margins than organic farmers in 2004/05 at £691 per cow compared to £628 per
organically managed cow. This is potentially a serious concern for organic farmers as they stock less than
conventional farmers due to operating without the use of artificial fertilisers. Consequently, organic farmers
could expect to derive less income per hectare based on achieving lower gross margins per cow in comparison
to conventional farming. The dairy gross margin data derived from the DEFRA organic study indicates that the
organic gross margins per cow were better in comparison to the conventional FBS data. A sensitivity analysis to
observe the effect of increasing milk price in the changing organic milk market indicates much improved gross
margins.
The cost of production data highlights the key issue associated with poorer performance of organic dairy
farming in comparison to conventional farming. Although the Welsh Farm Business Survey data indicated that
costs of production of 14.64 ppl were below the average milk price received at 19.55 ppl, the organic farm
income survey data (funded by DEFRA) indicates that the costs of production for organic milk production were in
the region of 20.92ppl compared to an average milk price received of 20.84 ppl.
In summary, the organic data derived from the Farm Business Survey and the Organic Farm Income report
funded by DEFRA indicates mixed results in determining the performance of organic dairy farming. As to be
expected, the profitability of organic dairy farming can be rewarding in a more buoyant organic milk market,
which has been reported since autumn 2004. However, the effect on profitability compared to conventional
dairy farming in an oversupplied market as observed between 2001/02 to 2004/05 can be fairly marginal as
the associated costs of producing organic milk can barely be met within the confines of the conventional milk
price. Therefore, it is reasonable to suggest that in the absence of a strong market for organic milk, conversion
to organic farming is not a solution to the financial problems faced by conventional producers.
6. Abbreviations
LSU/ha – livestock units per hectare
ppl – pence per litre
FBS – Farm Business Survey
The full Organic Farm Income reports are published on the DEFRA and Organic Centre Wales websites. Farm
Business Survey data is available via the Institute of Rural Sciences website.
Part 3: Case Studies
1. Nick & Matthew Fordham
1.1 Farm profile
Location: Dolgoch Farm, Brongest, Carmarthenshire.
Size of farm:100ha
Herd:100 dairy cows with the average cow having 75% Friesan + 25% Holstein genetics. The future breeding
policy is to move to smaller British Friesian cows
The farm was converted in 1998 and is in a lower rainfall area of Wales (33.35” or 850 mm). The soil type is
medium loam on 90% of the farm, with light clay on the other 10%. The farm is registered with the Soil
Association and in the Tir Gofal scheme. Since the farm was converted to organic management there has been
an increase in both the number of plant species and butterflies that have been identified on the farm. The farm
is regularly visited by parties of school pupils.
1.2 Cropping strategy
The pastures and crops grown on the farm include perennial ryegrass + white clover medium-term leys (>55% of
the land area), permanent pastures, oats + peas for whole-crop silage and oats for combining. Growing a
mixture of oats and peas produces higher quality whole-crop silage compared with growing oats alone,
particularly extra feed protein. Growing oats for combining within the crop rotation provides valuable feed for the
dairy herd and also efficiently utilises the fertility from the previous grass and clover ley.
During the period of silage making a contractor cuts and rows-up the swathes, with Nick and Matthew carting
and ensiling the crops. Good fermentation is achieved when the different crops are ensiled and quality silage
regularly made on the farm without the need to apply additives prior to ensiling. Weeds are not a major problem
on the farm with a Lazy Dog used to remove any thistles and any small areas of docks are cleared after