Iron status and factors influencing iron status of Solomon Islands women living in New Zealand : a thesis presented in the partial fulfillment of the requirements for the degree of Masters of Science (Human Nutrition), Massey University, Albany, New Zeala
247
0
0
Full text
(2) IRON. STATUS. AND. FACTORS. INFLUENCING. IRON. STATUS OF SOLOMON ISLANDS WOMEN LIVING IN NEW ZEALAND. A THESIS PRESENTED IN THE PARTIAL FULFILLMENT OF THE REQUIREMENTS FOR THE DEGREE OF MASTERS OF SCIENCE (HUMAN NUTRITION). MASSEY UNIVERSITY, ALBANY, NEW ZEALAND. ROSEMARY I’ILU KAFA 2012.
(3) All rights reserved. No part of this thesis may be reproduced without permission in writing from the author.. i.
(4) Abstract Iron deficiency is a global problem among women of reproductive age, particularly in developing countries. A recent survey from the Solomon Islands reported that 44% of women of reproductive aged were anaemic. Currently nothing is known about the iron status of women from the Solomon Islands living in New Zealand (NZ). Aim: This study aims to assess and compare iron status and factors influencing iron status of Solomon Islands with Caucasian women living in and around Auckland, NZ. Methods: This was a cross-sectional study comparing 40 Solomon Islands women with 80 age-matched Caucasian women living in and around Auckland. Serum ferritin (SF), C-reactive protein (CRP) and haemoglobin (Hb) were analyzed. Iron status was defined as: iron replete (SF > 20 µg/L + Hb > 120 g/L), iron deficiency (ID) (SF < 20 µg/L + Hb > 120 g/L) and iron deficiency anaemia (IDA) (SF < 20 µg/L + Hb < 120 g/L). Participants with CRP >10 mg/L were excluded from this study. Dietary assessment was conducted using a computerised iron food frequency questionnaire including questions on dietary habits, purposely to assess foods affecting iron status. In addition, a 24-hour dietary recall was used to assess the average daily nutrient intake of Solomon Islands women. Demographic and body composition data were also collected together with data on other factors affecting iron status such as blood loss and general health history. Results: No significant difference in the prevalence of low iron stores + IDA was found in Solomon Islands and Caucasian women (17 vs. 23%, p=0.478). The frequency of red meat, prepared meat and offal, and all white meat consumption did not differ between the two groups (p=0.187).. There was a significant difference in fish/seafood consumption (p=0.001),. Solomon Islands women consumed fish/seafood more frequently than Caucasian women. Solomon Islands women also consumed medium-high vitamin C fruits more frequently (p=0.002) and dairy products less frequently (p=0.001) than Caucasian women.. No. significant difference (p=0.872) was identified in the frequency of intake of beverages ii.
(5) containing polyphenol between the two groups. But the analysis of individual beverages showed that Solomon Islands women more frequently consumed black tea compared to Caucasian women, the similar practice was identified from the dietary habit assessment where 40% of Solomon Islands women drank black tea an hour before or after evening meals. Fewer Solomon Islands women consumed multivitamins/minerals than Caucasian women (12.8% vs. 66.7% respectively) and none of the Solomon Islands women reported taking dietary supplements compared to 44% Caucasian women. In regards to menstrual blood loss, although there was no significant difference between the two groups in overall menstrual blood loss units, Caucasian women reported on average 1 day longer menstrual period than Solomon Islands women. A small number of women in each group had previously donated blood, but in every case it had taken place more than 6 months prior to this study. Contraceptive use was significantly lower among Solomon Islands women compared to Caucasian women (p=0.001). Body mass index and waist circumferences were significantly higher (p=0.001 and p=0.001 respectively) in the Solomon Islands women compared to the Caucasian women. Conclusion: The iron status of Solomon Islands and Caucasian women did not differ, but there was variability between groups in the intake of foods and behaviours that are known to influence iron status.. This study found both protective and non-protective factors for ID among. Solomon Islands women, although the correlation of those factors with iron status were not able to be assessed due to a relatively small sample size and low prevalence of ID/IDA. This study therefore concludes that ID was not a concern for Solomon Islands women living in NZ, and that the prevalence was lower in this group than in women living in the Solomon Islands. This is possibly the result of adapting to different dietary habits and behaviours, increased accessibility to animal sources of iron, and high intakes of vitamin C-rich foods in their host country.. iii.
(6) Acknowledgement It is an honour for me to express my deepest gratitude to all the participants, families and the Solomon Island communities in Auckland and Hamilton for the abundant support offered during the course of this research; this thesis would not have been possible without your participation and support. Big TAGIO lo iu fala evri wantok. I am indebted to my supervisors Dr. Cath Conlon, Dr. Rozanne Kruger and Associate Professor Welma Stonehouse, whose encouragement, guidance and tireless support from the beginning to the end of this thesis gave me the courage and motivation to complete this work. Also for helping me to gain an in depth understanding and interest in this important research topic, with the knowledge and skills I am confident to contribute effectively to improve maternal and child health in the Solomon Islands. Not forgetting, the Phlebotomists for giving their time on the weekends to collect blood samples and all those who contributed to this study, I am grateful for all of you. To Massey University and the New Zealand development aid programme, thank you for the financial assistance towards this study. Lastly, I owe my deepest gratitude to my family who have been with me throughout this entire journey. It was not always easy but we have endured it together to the end. For this, I have the pleasure to dedicate this thesis to my two wonderful children Zaneta Furioa Kafa (daughter) and Shalom Daniel Kafa (son) for their patience and understanding though it was hard to comprehend at times and above all, I would like to give all glory to GOD for without whom I would not be able to get to the end of this journey.. iv.
(7) Research team The research reported in this thesis was planned and executed by a team of researchers. The contribution of each team member is described in the table below. Rosemary Kafa. Study proposal, ethics application, development of study protocols, participant recruitment, data collection, data processing, statistical analysis and thesis writing. Dr. Cath Conlon (Main supervisor). Supervised and assisted with study proposal, ethics application, development of questionnaires, development of study protocols, data collection, blood processing, supervised and review of the final thesis. Dr. Rozanne Kruger (Co-supervisor). Supervised and assisted with study proposal, ethics application, development of study protocols, development of questionnaires, training in dietary assessment, data collection, dietary data analysis, supervised and review of the final thesis. Associate Professor Welma Stonehouse (Co- Supervised and assisted with study proposal, supervisor) ethics application, data collection, blood processing, data processing, statistical analysis, supervised and review of the final thesis. Simon Bennett. Phlebotomist. Avril Balmer. Phlebotomist. Carlos Miranda. Blood processing. Regina Wypch. Assistance with measurements. Cheryl Gammon. Assistance with statistical data analysis. Kathryn Beck. Compilation of Caucasian women’s databases and assistance with calculation of menstrual blood loss. Michelle Ingram. Language editing. body. composition. v.
(8) Table of content Abstract………… ...................................................................................................................... ii Acknowledgement ................................................................................................................... iv Table of content ....................................................................................................................... vi List of Figures ......................................................................................................................... xii List of Tables .......................................................................................................................... xiv Abbreviations ......................................................................................................................... xvi Chapter 1: Introduction .......................................................................................................... 1 1.1. Economic situation of the Solomon Islands ..................................................................... 3 1.2. Pacific Island Countries migration pattern ....................................................................... 3 1.3. Traditional Solomon Islands diet .......................................................................................... 3 1.4. Problem statement .......................................................................................................... 4 1.5. Aim of the study ............................................................................................................... 6 1.6. Structure of thesis ............................................................................................................ 6 Chapter 2: Literature review .................................................................................................. 9 2.1. Introduction...................................................................................................................... 9 2.2.. Iron and its functions .......................................................................................................9. 2.2.1. Iron regulation ...............................................................................................................12 2.2.2. Iron absorption ..............................................................................................................12 2.2.3. Recycling of iron ............................................................................................................14 2.2.4. Iron transportation ......................................................................................................... 15 2.2.5. Iron storage ................................................................................................................... 15 2.2.6. Iron losses ..................................................................................................................... 16 2.2.7. Functions of iron ............................................................................................................16 2.2.8. Oxygen transport ........................................................................................................... 16 2.2.9. Energy production ......................................................................................................... 16 vi.
(9) 2.2.10. Iron in enzymes .......................................................................................................... 17 2.2.11.Cognitive development................................................................................................. 18 2.2.12. Iron and Immunity ....................................................................................................... 20 2.3. Daily iron requirements for non-pregnant, non-lactating women of reproductive age .... 20 2.3.1. Dietary sources of iron .................................................................................................. 20 2.4. Iron deficiency ............................................................................................................... 23 2.5. Consequences of iron deficiency and iron deficiency anaemia in women ..................... 25 2.6. Causes of iron deficiency and iron deficiency anaemia ................................................. 27 2.6.1. Dietary factors influencing iron status ........................................................................... 27 2.6.2. Enhancers of iron absorption ........................................................................................ 27 2.6.3. Inhibitors of iron absorption ........................................................................................... 29 2.6.4. Blood Loss .................................................................................................................... 31 2.6.5. Other factors influencing iron status of Pacific Islands women ..................................... 33 2.6.6. Overweight/obesity and ID ........................................................................................... 33 2.7. Prevalence of ID and IDA in developed and developing countries ................................. 34 2.7.1. Prevalence of ID and IDA in developed countries ......................................................... 36 2.7.2. Prevalence of ID and IDA in developing countires………………………………………...36 2.8. Nutritional situation among immigrants in developed countries ..................................... 38 2.9. Demographic profile of the Pacific Islanders in NZ ........................................................ 40 2.9.1. Socio-economic and health situation of Pacific Islanders in NZ .................................... 40 2.10. Health and nutrition of women in the Solomon Islands .................................................. 41 2.11. Importance of the study for the Solomon Islanders in living in New Zealand................. 41 Chapter 3: Methodology ....................................................................................................... 43 3.1. Study design .................................................................................................................. 43 3.2. Recruitment ................................................................................................................... 43 3.2.1. Participant selection for the Solomon Islands women cohort ........................................ 44 vii.
(10) 3.2.2. Participant selection for the Caucasian women cohort ................................................. 44 3.3. During the visit ............................................................................................................... 45 3.4. Study approval and funding support .............................................................................. 47 3.5. Measurements used in this study................................................................................... 47 3.5.1. Demographic questionnaire .......................................................................................... 48 3.5.2. Dietary Assessment ...................................................................................................... 48 3.5.3. Iron food frequency questionnaire ................................................................................ 48 3.5.4. Dietary habit questionnaire ........................................................................................... 49 3.5.5. Single 24-hour dietary recall interview .......................................................................... 50 3.5.6. General health and lifestyle questionnaire .................................................................... 51 3.5.7. Blood Loss .................................................................................................................... 52 3.5.8. Body composition measurements ................................................................................. 54 3.5.9. Blood sample collection and processing ....................................................................... 58 3.5.10. Biochemical analysis................................................................................................... 59 3.6. Data processing and statistical analysis ........................................................................ 61 Chapter 4: Results ................................................................................................................ 63 4.1. Characteristics of participants ........................................................................................ 63 4.2. Body composition........................................................................................................... 65 4.3. Iron status ...................................................................................................................... 67 4.4: Factors influencing iron status of the participants .......................................................... 68 4.5. Lifestyle and dietary practices ........................................................................................ 70 4.6. Dietary Assessment ....................................................................................................... 72 4.6.1. Results from the iron food frequency questionnaire ...................................................... 72 4.6.2. Dietary Habits ............................................................................................................... 74 4.6.3. 24-hour dietary recall .................................................................................................... 82 Chapter 5: Discussion .......................................................................................................... 85 viii.
(11) 5.1. Characteristics of Solomon Islands women ................................................................... 85 5.2. Iron status and influencing iron status of Solomon Islands’ and Caucasian women ...... 85 5.2.1. Prevalence of iron deficiency and iron deficiency anaemia ........................................... 86 5.2.2. Protective dietary factors for adequate iron status ........................................................ 86 5.2.3. Non- protective dietary factors for adequate iron status ................................................ 89 5.2.4. Dietary habits influencing iron status ............................................................................ 91 5.3. Other factors influencing iron status............................................................................... 93 5.3.1. Blood loss ..................................................................................................................... 93 5.3.2. Contraceptive use ......................................................................................................... 93 5.3.3. Past history of iron deficiency/anaemia......................................................................... 94 5.3.4. Chronic diseases .......................................................................................................... 94 5.3.5. Body Mass Index .......................................................................................................... 95 5.4. Iron status of Solomon Islands women living in New Zealand and Solomon Islands ..... 95 Chapter 6: Summary, conclusion & recommendation ....................................................... 99 6.1. Summary ....................................................................................................................... 99 6.2. Conclusion ................................................................................................................... 100 6.3. Recommendation .........................................................................................................100 References ........................................................................................................................... 101 Appendices ......................................................................................................................... 123 Appendix – A......................................................................................................................... 123 Appendix – B ........................................................................................................................ 129 Appendix – C ........................................................................................................................ 131 Appendix – D ........................................................................................................................ 149 Appendix – E ........................................................................................................................ 153 Appendix – F......................................................................................................................... 157 Appendix – G ........................................................................................................................ 159 ix.
(12) Appendix – H ........................................................................................................................ 161 Appendix – I .......................................................................................................................... 165 Appendix – J ......................................................................................................................... 175 Appendix – K ........................................................................................................................ 183 Appendix – L ......................................................................................................................... 188 Appendix – M ........................................................................................................................ 196 Appendix – N ........................................................................................................................ 201 Appendix – O ........................................................................................................................ 206 Appendix – P ........................................................................................................................ 214 Appendix – Q ........................................................................................................................ 220 Appendix – R ........................................................................................................................ 224. x.
(13) xi.
(14) List of Figures Figure 1.1: Map of Solomon Islands ......................................................................................... 2 Figure 2.1: Haemoglobin molecule from a red blood cell ........................................................ 11 Figure 2.2: Iron absorption in the duodenal cell and the iron transferrin cycle ........................ 13 Figure 2.3: Iron regulation and recycling in the body .............................................................. 15 Figure 2. 4: Developmental stages of iron deficiency.............................................................. 23 Figure 3.1: Study setting and procedures ............................................................................... 46 Figure 4.1: Percentage of Solomon Islands and Caucasian women classified as overweight/obese, normal BMI or underweight .................................................... 66 Figure 4.2: Proportion of Solomon Islands and Caucasian women who were iron replete or iron deficient and anaemic ................................................................................... 68. xii.
(15) xiii.
(16) List of Tables Table 2.1: Major iron pools and distribution in adults .............................................................. 10 Table 2.2: Iron compounds in oxidative metabolism and energy production ........................... 17 Table 2.3: Effects of ID on neurochemical functions ............................................................... 19 Table 2.4: Dietary sources with moderately high to high iron content ..................................... 21 Table 2.5: Prevalence of ID and IDA in European countries ................................................... 35 Table 2.6: Prevalence of anaemia among women of reproductive age from some of the Pacific Islands’ countries ....................................................................................... 37 Table 3.1: Absorbencies for pads and tampons used to estimate the menstrual blood loss ... 53 Table 3.2: BMI cut off values and classification ....................................................................... 56 Table 3.3: Categories and cut off values for total body fat percentage for female ................... 58 Table 3.4: Haemoglobin values and its classifications for iron status ...................................... 60 Table 3.5: Serum ferritin reference intervals for women aged 15 – 40 plus years................... 60 Table 4.1: Demographic characteristics of Solomon Islands and Caucasian women ............. 64 Table 4.2: Anthropometric measurement and percentage body fat results for Solomon Islands and Caucasian women.............................................................................. 65 Table 4.3: Haemoglobin and serum ferritin concentrations of Solomon Islands and Caucasian women ................................................................................................. 67 Table 4.4: Factors influencing iron status of Solomon Islands and Caucasian women ........... 69 Table 4.5: Responses to different dietary practices of Solomon Islands and Caucasian women ................................................................................................................... 71 Table 4.6: Frequency of intake of groups of foods influencing iron status per week ............... 73 Table 4.7: Daily intake of servings of fruits, vegetables and meat by Solomon Islands and Caucasian women ................................................................................................. 75 Table 4.8: Frequency of meals consumed during the day ....................................................... 77 Table 4.9: Percentage of participants who usually drink beverage 1 hour before or after meal time ....................................................................................................................... 78 xiv.
(17) Table 4.10: The five top drinks usually consumed by the Solomon Islands and Caucasian women upto 1 hour before and after meals .......................................................... 79 Table 4.11: The five top foods/drinks frequently consumed at each meal during the day ....... 81 Table 4.12: Average daily nutrient intake of the Solomon Islands women from the 24-hour dietary recall .......................................................................................................... 83. xv.
(18) Abbreviations. Abs. Absorbency. AGP. α1 – acid glycoprotein. AHA. American Heart Association. AMDR. Acceptable macronutrient distribution range. ASIWA. Aotearoa Solomon Islands wantoks’ association. APPs. Acute phase proteins. BLU. Blood loss unit. BMI. Body mass index. CIHAT. Computerised iron habits assessment tool. Cm. Centrimetre. CO2. Carbon dioxide. CRP. C – reactive protein. D1. Dopamine receptor 1. D2. Dopamine receptor 2. DA. Dopamine. DALYs. Disability adjusted life years. Dcytb. Duodenal cytochrome b. DHS. Demographic health survey. DMT1. Divalent metal transporter 1. DNA. Deoxyribonucleic acid. FADH2. Flavin Adenine Dinucleotide. FeFFQ. Iron food frequency questionnaire. Fe 2+. Iron ferrous. Fe. 3+. Iron ferric. FPN. Ferroportin. g. gram. GABA. γ aminobutyric acid. GAD. Glutamate decarboxylase. GBD. Global burden of disease xvi.
(19) GDP. Gross domestic product. Hb. Haemoglobin. HCP1. Haem carrier protein 1. HD. Number of ‘heavy’ days during an average period. HP. Number of pads on a ‘heavy’ day. HT. Number of tampons on a ‘heavy’ day. Ht. Height. 5-HT. 5-Hydroxytryptophan. IANZ. International Accreditation New Zealand. ID. Iron deficiency. IDA. Iron deficiency anaemia. IDE. Iron deficiency erythropoiesis. IREs. Iron responsive elements. IRPs. Iron regulatory proteins. ISAK. International society for the Advancement of Kin anthropometry. IUD. Intrauterine device. IUD. Intrauterine foetal demise. Kcal. Kilocalorie. Kg. Kilogram. KiWI. Kiwi women iron study. KJ. Kilo joule. L. Litre. LBW. Low birth weight. LD. Number of ‘light’ days during an average period. LP. Number of pads on a ‘light’ day. LT. Number of tampons on a ‘light’ days. NA. Not assessed. NM. Not measured. m2. Metre square. MCV. Mean cell volume. mg. Milligram. µg. Microgram xvii.
(20) MID. Mild iron deficiency. MoHNZ. Ministry of Health New Zealand. MoHSI. Ministry of Health Solomon Islands. MUFA. Mono unsaturated fatty acids. NADH. Nicotinamide adenine dinucleotide plus Hydrogen. NNS. National nutrition survey. NZ. New Zealand. NZ NCEA L3. New Zealand national education achievement level 3. O2. Oxygen. p. Probability. PKU. Phenylketonuria. PI. Pacific Islands. PUFA. Poly unsaturated fatty acids. RDI. Recommended daily intake. SD. Standard deviation. SDT. Suggested dietary target. SF. Serum ferritin. SFA. Saturated fatty acids. SI. Solomon Islands. SLS. Sodium lauryl sulphate –Hb. SOP. Standard operation protocols. SPC. Secretariat of the Pacific community. SPSS. Statistical package for social science. TBI. Transferrin bound iron. TfR1. Transferrin receptor 1. UK. United Kingdom. UN. United Nations. UNDP. United Nations development programme. UNICEF. United Nations international children’s fund. US. United States. USA. United State of America. WHO. World health organization xviii.
(21) WISE. Women iron status and education. Wt. Weight. xix.
(22) Chapter 1: Introduction Around two billion people are affected by iron deficiency (ID) globally (Zimmermann & Hurrell, 2007; WHO, 2004) but it is most common in women of reproductive age in developing countries (World Health Organization (WHO), 2001). According to WHO (2004), Iron deficiency is a state in which there is insufficient iron to maintain the normal physiological function of tissues such as the blood, brain, and muscles. Iron deficiency can exist in the absence of anaemia if it has not lasted long enough or if it has not been severe enough to cause the haemoglobin (Hb) concentration to fall below the threshold for the specific sex and age group. While there is no available information on the prevalence of ID in Solomon Islands women, the first National Nutrition Survey in the Solomon Islands identified 23% of reproductive aged women as having anaemia (Solomon Islands Ministry of Health (MoHSI), 1990). Anaemia is an advance stage or third stage in the progress of ID with Hb < 120 g/L. In the more recent Health and Demographic Survey of 2006/07, the prevalence of anaemia had increased to 44.3% (Secretariat of the Pacific Community (SPC), 2009b) which is a 21% increase from the last 1989/90 survey. This shows an increasing trend in the prevalence of anaemia among women of reproductive age in the Solomon Islands. The current available data only represent anaemia and therefore, iron deficiency is also likely to be a significant problem in this population. As ID is one of the eminent risk factors for disability, maternal and perinatal mortality globally (Zimmermann & Hurrell, 2007; Stoltzfus, 2003), widespread ID among Solomon Islands women would have far-reaching implications for the health of the Solomon Islands population. Solomon Islands is one of the developing Pacific Island nations situated 1800 kilometres north-east of Australia. It has a total land area of 28,900 square kilometres scattered over 1.3 million square kilometres of the Pacific Ocean (Figure 1.1).. The six main islands are. Guadalcanal, Malaita, Choiseul, San Cristobal, Santa Isabel and New Georgia, and there are hundreds of smaller, uninhabited islands (WHO, 2008). While IDA has been identified in women throughout the islands, it is most prevalent on the more densely populalated islands. 1.
(23) such as Guadalcanal (55%), Malaita (45%), Western province (41%) and in the capital city, Honiara (49%) (SPC, 2009b).. Source: http://www.thecommonwealth.org/YearbookHomeInternal Figure 1.1: Map of Solomon Islands The population of the Solomon Islands was projected to be 542,287 in 2011, with an annual population growth rate of 4.4% between 1999 and 2005 (Solomon Islands Statistics Office, 2006). The Solomon Islands population increased since the 1999 national population census record from 404,511 to 552,438 an estimated figure from July 2006, with 42% of the total population younger than 15 years of age (WHO, 2008). As it has a youthful population, the Solomon Islands is likely to face increasing challenges with IDA, especially as young girls reach reproductive age.. Also, it is predicted that the Solomon Islands will continue to. experience high population growth in the future (SPC, 2009b), which will further escalate the risks of IDA in women of reproductive age. According to WHO (2008), the estimated life 2.
(24) expectancy of Solomon Islanders at birth was 63.4 years (62.6 years for males and 64.3 years for females). More than 80% of the population of the Solomon Islands lives in rural areas. Traditional communal living is the norm in villages, and subsistence farming and fishing are the means of survival with surplus produce as a source of income for the family (Secretariat of the Pacific Community (SPC), 2008; National Planning Solomon Islands Government, 2002). 1.1.. Economic situation of the Solomon Islands. The cash economy of Solomon Islands is largely based on timber, fish, copra, cocoa, palm oil and gold (Commonwealth of Australia, 2004; SPC, 2008). The gross domestic product (GDP) growth rate slowly increased from 6.4% in 2008 to 7.1% in 2010, despite a decline (– 2%) in 2009 (Wasuka, 2011). It is likely that, the current economic situation of the Solomon Islands has been affected by the global recession, which has contributed to high food prices and therefore affected food choices. In this regard, the country’s economic status has the potential to impact the nutritional status of more affluent and low income groups in the urban population. This is supported by the identification of the high percentage (49%) of anaemic women in the capital city (Honiara) and other areas where urbanization has occurred and people are exposed to more affluent foods and lifestyles (SPC, 2009b).. 1.2.. Pacific Island Countries migration pattern. The Pacific Islands is made up of 20,000 to 30,000 islands and comprises 22 states. The indigenous populations are from Melanesia (black islands), Micronesia (small islands) and Polynesia (many islands) (Fitzpatrick-Nietschmann, 1983). In Melanesia, internal migration is common, while Polynesians have widespread international emigration and Micronesians undertake both internal and international migration (Connell & Brown, 1995). The population of Pacific people in NZ comprises groups with diverse cultures and several different languages, although there are also numerous similarities.. The largest group is Samoan. (49%), followed by Cook Islanders (22%), Tongans (19%), Niuean (8%) and other minority groups, including Solomon Islanders (Tukuitonga, 2011).. Solomon Islanders, from a. Melanesian Pacific country, form a small growing population in NZ.. The first record of. Solomon Islanders coming into NZ was in the 1951 national census with a population of 20, which increased to 184 in the 1996 census, 507 in 2001 and 522 in 2006 (Walrond, 2009).. 3.
(25) 1.3.. Traditional Solomon Islands diet. Historically, Solomon Islanders were hunters and gatherers whose survival was dependent on cultivation of the sea, rivers, forest and land.. The traditional Solomon Island diet. predominantly consists of root vegetables, coconut, fresh fish and green leaves (Coyne, 2000). Common root crops are taro, yams, sweet potato and cassava (Liloqula, Saelea & Levela, 1980). Local green leaves cooked in coconut cream are more frequently eaten with root crops than animal protein sources (Coyne, 2000). This diet is poor in sources of iron, especially meat, which may be a significant factor contributing to the high prevalence of IDA in Solomon Islands women. Many changes to the traditional Solomon Islands diet have occurred over several decades ago (Coyne, 2000). Imported foods such as rice, flour, noodles, sugar, tea, salt and canned fish and/or meat are becoming increasingly consumed by many Solomon Islanders, particularly urban dwellers (Coyne, 2000). These dietary changes may have contributed to the increased rates of Western disease patterns that are now seen in the Solomon Islands; the major causes of mortality from 1990 to 2005 were cancer, cardiovascular diseases, malaria, respiratory infections and neonatal causes in infants (WHO, 2008; MoHSI, 2007).. 1.4.. Problem statement. It is likely that the small Solomon Islands immigrant population in NZ will increase over the coming years, and will form another of this country’s significant Pacific Island ethnic groups. The lower rate of IDA in NZ compared to the Solomon Islands raises questions about the iron status of Solomon Island women living in NZ, and whether their iron status may have been affected by emigrating to NZ. However, there is currently no information about the iron status of women from the Solomon Islands living in NZ. Studies on Pacific Islanders in NZ did not represent the minority Pacific Island groups such as Solomon Islanders. This is the first study to address whether ID is a problem among Solomon Islands women who are living outside of their native country, and to assess the factors that contribute to their iron status. Therefore, this research will provide baseline information on the iron status of Solomon Islands women living in NZ. It will also provide important information 4.
(26) for designing future interventions, should ID be found to be a concern in this population group. A group of age-matched Caucasian women will be included in this study to allow comparisons of iron status and factors contributing to ID and IDA. Information acquired from each group will be useful to understand the dietary intake of the two groups involved and their influences on iron status.. 5.
(27) 1.5.. Aim of the study. To assess the iron status of Solomon Islands women aged 18 – 45 years living in and around Auckland, and to compare the results with a sample of age-matched Caucasian women from the same location. Objectives: 1.. To determine iron status for both groups through assessing haemoglobin (Hb), serum ferritin (SF) and C-reactive protein (CRP) concentrations as biomarkers.. 2.. To assess the following factors influencing iron status of Solomon Islands women and compare with age-matched Caucasian women living in and around Auckland. ‐ To assess dietary factors influencing iron status through a computerised iron food frequency questionnaire (FeFFQ) including a questionnaire on dietary habits ‐. To assess nutrient intake of the Solomon Islands women through a single 24 hour dietary recall interview. ‐ To assess blood loss using an adapted computerised blood loss questionnaire ‐ To assess the health history and lifestyle practices of the participants in relation to iron status ‐ To assess BMI, waist circumference using standard anthropometric measures and percentage of body fat using BODPOD 1.6.. Structure of thesis. This report comprises six chapters. Each chapter will be briefly introduced in this section to highlight the composition of this report. Chapter one: Introduction This chapter gives a brief description of the magnitude of ID/IDA, the classification of iron status, overview of the Solomon Islands, rationale, aims and objectives of this study. Chapter two: Literature Review This chapter reviews information and evidence relating to iron, ID, IDA, factors influencing the iron status of women of reproductive age and the effects of IDA on women’s health and pregnancy outcomes.. This information comes from a range of sources, including peer6.
(28) reviewed experimental and observational studies, population-based surveys, review papers and textbooks. Chapter three: Methodology This section describes the study design, sample population and different standardised methodologies that were used to collect data for this study. These methodologies include biochemical analyses for the identification of iron status; body composition measurements; and questionnaires on demographic data, diet and other factors influencing iron status such as blood loss and the general health and lifestyle of the participants. Chapter four: Results This chapter describes the participant’s, demographic characteristics, the prevalence of ID and IDA within the samples, different factors (such as dietary) that influence iron status and general health and lifestyle practices. Results are presented in tables and figures. Chapter five: Discussion The section discusses the results in the context of the wider literature, providing comparisons with other relevant research. Chapter six: Summary, Conclusions & Recommendations This chapter summarises the main findings of this study, outlines the concluding statements and provides recommendations based on the study results.. 7.
(29) 8.
(30) Chapter 2: Literature review 2.1.. Introduction. Iron deficiency can severely compromise women’s health and pregnancy outcomes, and is therefore a significant health problem. The Global Burden of Disease (GBD) 2000 project reported that ID ranks ninth among 26 major factors that contribute to global disease rates (Stoltzfus, 2003) and is considered to be one of the eminent risk factors for disability, maternal and perinatal mortality (Zimmermann & Hurrell, 2007; Stoltzfus, 2003).. Iron deficiency. anaemia (IDA) is more prevalent in women and children of developing countries than of developed countries (McLean et al., 2008). The number of non-pregnant women reported to have IDA was 468 million globally (de Benoist et al., 2008). Furthermore, IDA contributes to 115,000 maternal deaths per year and 0.4% of total global disability-adjusted life years (DALYs) (Black et al., 2008). These figures demonstrate that ID and IDA can have serious consequences for women of reproductive age if not identified and treated early. This literature review will describe different forms of iron and its functions, recommended iron requirements for non-pregnant women, dietary sources of iron, ID and IDA and their causes and consequences, and factors that can influence the iron status of women in both developed and developing countries. Evidence will be drawn from human and animal studies on ID and IDA from developed and developing countries. Nutritional issues that affect immigrants from undeveloped countries living in Western countries, including NZ, will also be explored. This literature review will also include the profile of Pacific Islanders in NZ, as some of the issues have the potential to influence the iron status of Solomon Islands women living in NZ. Lastly, the review will describe the nutritional issues faced by Solomon Islands women in their native country, which led to the rationale behind this study. 2.2.. Iron and its functions. Iron, a trace mineral, was identified as an essential nutrient over a century ago and presents as ferric (Fe3+) and ferrous (Fe2+) forms. Since then, many advances have been made in the study of iron metabolism and ID, but further understanding of its absorption mechanisms is still needed (Bernuzzi & Recalcati, 2006). Although the body only requires small amounts of iron, 9.
(31) it is an essential nutrient for human health. Iron has a distinctive characteristic: it is positively charged, allowing it to lose and gain electrons and therefore alternate between its oxidized Fe3+ and Fe2+ forms (Papanikolaou & Pantopoulos, 2005; Dunn, Rahmanto & Richardson, 2006).. Another essential character of iron is its ability to bind to negatively charged. components such as oxygen, nitrogen and sulphur, which significantly contributes to the functionality of iron within the body (Beard, 2001; King, 1996). It is vital that adequate iron levels are maintained to the degree that they meet physiological needs, but they should not be so high as to cause iron toxicity and oxygen radicals that harm cellular constituents (Papanikolaou & Pantopoulos, 2005; Miret, Simpson & Mckie, 2003). The human body has two major iron body pools: functional iron in Hb, myoglobin and enzymes, and stored iron in ferritin, hemosiderin, and transferrin (Table 2.1) (Edison, Bajel & Chandy, 2008; Mahan & Escott-Stump, 2004). Adequate iron in each pool enables iron to engage in crucial cellular metabolic processes within the human body and facilitate proper physiological functioning (Clark, 2008; Hunt, 2005). Table 2.1: Major iron pools and distribution in adults (Gropper, Smith & Groff, 2009) Major iron pools. Women (mg/kg). Men (mg/kg). Haemoglobin. 28. 31. Myoglobin. 4. 5. Haem enzymes. 1. 1. Non-haem enzymes. 2. 1. 0.05. 0.05. 4. 12. 39.05. 50.05. Functional iron. Transport iron Transferrin Storage iron Ferritin and hemosiderin Total iron. Source: Adapted from Gropper, Smith & Groff (2009). Functional body iron is primarily found in haem protein complexes in Hb within circulating red blood cells, as well as in myoglobin of muscle tissues (Anderson & Vulpe, 2009; Beard, 2001). Both Hb and myoglobin aid iron transportation (Munoz, Villar & Garcia-Erce, 2009). Haemoglobin is the most important haem protein, consisting of four globin chains each binding 10.
(32) a haem molecule (Figure 2.1). The structure of Hb enables it to hold four iron atoms, which means it can efficiently transport more than one oxygen atom at a time to tissues (Lynch, 2003).. Source: (Mader, 1997). Figure 2.1: Haemoglobin molecule from a red blood cell (Mader, 1997) To carry oxygen to the tissues, iron binds with metalloproteins (Andrews & Schmidt, 2007). This occurs via the transfer of electrons to and from the iron atom as it varies between the different states of oxidation. Iron operates as a shuttle by binding with oxygen from the environment and delivering it to the tissues (Thompson et al., 2011; Aisen, Enns, & WesslingResnick, 2001). Myoglobin is another functional haem molecule with a similar structure to Hb. It is found within muscles, but unlike Hb, its single globin chain and haem complex means it is only capable of transporting a small amount of oxygen per molecule. Myoglobin’s role is to store oxygen and ensure sufficient delivery from erythrocytes to cellular mitochondria in the muscle cytoplasm 11.
(33) (Schechter, 2008; Lynch, 2003).. Myoglobin makes up 10% of the body’s functional iron. (Lynch, 2003). 2.2.1. Iron regulation Iron is an indispensable nutrient for life, yet excess iron may cause toxicity in the body and can result in cardiac problems and cancer (Gropper et al., 2009; Papanikolaou & Pantopoulos, 2005).. Therefore, physiological regulatory mechanisms are in place to maintain an ideal. concentration of iron in the cells. The genes required for co-ordinating these mechanisms are regulated by iron responsive elements (IREs) and iron regulatory proteins (IRPs) (Recalcati, Minotti & Cairo, 2010).. This homeostasis process primarily occurs through absorption,. transport, storage and excretion of iron (Andrews & Schmidt, 2007; Dunn et al., 2006). 2.2.2. Iron absorption There are two major types of iron in the diet, haem and non-haem iron (Lynch, 2003; Sharp & Srai, 2007). The mechanisms required for iron absorption are different for each form, but both involve a multistep process beginning with uptake of iron from the intestinal lumen and transport across the basolateral membrane to the plasma (Geissler & Singh, 2011; Sharp & Srai, 2007) as shown in figure 2.2. Prior to haem iron absorption, it needs to be hydrolysed from the globin portion of the haemoglobin or myoglobin, which requires the presence of gastric secretions such as hydrochloric acid and proteases in the stomach and the small intestine (Edison et al., 2008; Miret et al., 2003). Ferrireductases are the major players in the reduction process of Fe3+ to Fe2+ iron in the duodenum (Frazer & Anderson, 2005; Papanikolaou & Pantopoulos, 2005; Pantopoulos, 2004). Ascorbic acid has shown to be an influential factor necessary for the reductase activity (Hurrell & Egli, 2010; Trinder et al., 2002; Bothwell, 1995). In its reduced state, ferrous iron is bound to divalent metal transporter 1 (DMT1), which acts as a proton symporter by allowing iron to cross the luminal membrane of the duodenum and be absorbed (Gropper et al., 2009; Zimmermann & Hurrell, 2007; Dunn et al., 2006). In the cytoplasm, iron is either stored as ferritin or released into the serum for circulation (Drakesmith & Prentice, 2008; Papanikolaou & Pantopoulos, 2005).. Figure 2.2 illustrates the iron. 12.
(34) absorption process, but the actual mechanism of haem iron absorption is yet to be identified (Trinder et al., 2002).. Source: Drakesmith & Prentice (2008) Figure 2.2: Iron absorption in the duodenal cell and the iron transferrin cycle (Drakesmith & Prentice, 2008) The absorption of dietary iron as Fe3+ begins with uptake from the intestinal lumen (Figure 2.2). It is then reduced from Fe3+ to Fe2+ by ferrireductase duodenal cytochrome b (Dcytb) and transported into the cytoplasm via DMT1. Haem iron from food is absorbed via haem carrier protein 1 (HCP1), where it is converted to Fe2+ by oxygenase 1 (HO) (Drakesmith & Prentice, 2008; Zimmermann & Hurrell, 2007; Frazer & Anderson, 2005). Iron is released from enterocytes via ferroportin (FPN) under the action of ferric oxidase hephaestin, after which it binds to transferrin and is transported to tissues (Drakesmith & Prentice, 2008).. 13.
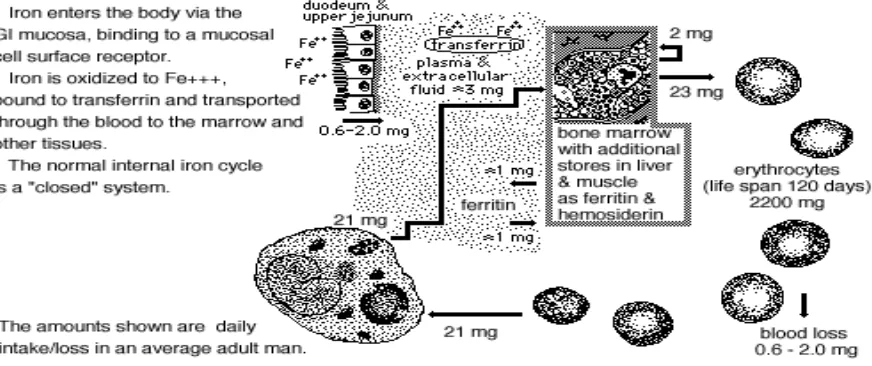
(35) Iron transferrin has a strong affinity for transferrin receptor 1 (TfR1) at extracellular pH 7.5. Once inside the endosome, a pH of 6.2 causes ferric iron to be discharged from transferrin. It is then reduced by ferri- and cupric-reductases to Fe2+ iron and transferred to the cytoplasm by DMT1 (see Figure 2.2) (Drakesmith & Prentice, 2008; Mckie et al., 2001).. Plasma. transferrin is then incorporated into haemoglobin for erythropoiesis and release back into the circulation (Drakesmith & Prentice, 2008; Zimmermann & Hurrell, 2007).. The regulation of iron absorption can be influenced by certain factors such as the amount of iron consumed, the rate of erythropoiesis, hypoxia, pregnancy and inflammation, as well as dietary factors such as ligands and iron chelators that may inhibit or reduce its absorption (Thompson et al., 2011; Frazer et al., 2005; Miret et al., 2003; Bothwell, 1995). The amount of plasma iron absorbed by the enterocytes is equal to levels in the body; therefore the iron level of these cells reflects the body stores. Crypt cells express TfR1 which facilitates the uptake of transferrin bound iron (TBI) (Arneson & Brickell 2007; Trinder et al., 2002). 2.2.3. Recycling of iron The normal human body contains 3 to 4 grams of iron, of which 75% is present as active metabolic compounds and about 10% remains as reservoir (Lynch, 2003; Miret et al., 2003; Bothwell, 1995). When the dietary iron supply is low or the body has undergone large losses, iron is mobilised from storage to maintain adequate blood levels. Once iron balance has been restored, the body will gradually boost the iron stores to ensure optimal reserves are available in times of demand. About 90% of daily iron needs are obtained from endogenous sources, whereby older red blood cells are broken down and recycled back into the iron pool (Figure 2.3) (Hurrell & Egli, 2010). The remaining 10% of iron comes from the diet as haem iron from animal sources and non-haem iron from plant sources (Hurrell & Egli, 2010; Harvey et al., 2000).. 14.
(36) Figure 2.3: Iron regulation and recycling in the body Source: School of Medicine, University of Virginia, (n.d.).. 2.2.4. Iron transportation Iron is transported from the iron pool through enterocyte membranes by FPN, an important iron carrier that aids the regulation of intestinal iron absorption and release (Frazer, et al., 2005). In the interstitial fluid, iron is in its ferrous form, which may be rapidly converted to ferric form by hepaetin or ceruloplasmin in the blood. Ferric iron must bind with transferrin in order to reach the cells, and each transferrin molecule can bind a maximum of two Fe3+ (Thompson et al., 2011; Papanikolaou & Pantopoulos, 2005; Dunn et al., 2003). Transferrin is a glycoprotein, the principal iron transporter in the blood. It is synthesised in the liver and has a life span of 8 to 12 days (Wick, Pinggera & Lehmann, 1994). 2.2.5. Iron storage There are two forms of stored iron, ferritin and haemosiderin. Stored iron is supplied to the body iron when it is needed (Papanikolaou & Pantopoulos, 2005). Iron storage sites in the body are the liver, bone marrow and spleen (Fleming & Britton, 2006). Iron is normally stored as ferritin, whereas haemosiderin storage usually occurs during iron overload. If there is an iron overload and the excess iron still remains as haemosiderin in the heart and liver, serious complications can occur and there is a significant risk of organ damage (Papanikolaou & Pantopoulos, 2005). Normally, women store between 300 - 1000 mg of iron, which is less. 15.
(37) than the 500 - 1500 mg usually stored by men (Thompson et al., 2011; Bothwell, 1995). Amounts of stored iron outside of these ranges can be treated as an abnormality. 2.2.6. Iron losses The major route of iron loss is via the turnover of gut enterocytes, which involves gut cells being discarded into the intestinal lumen every three to six days (Figure 2.3). Ferritin stores in the enterocytes are also cycled back to the lumen (Figure 2.2 & 2.3).. Iron regulation is. controlled in such a way that it drastically decreases the likelihood of excess iron infiltrating the system, regardless of its source (Thompson et al., 2011).. The body also loses iron. through urine, faeces, sweat, menses and pathological loss (Miret et al., 2003; Bothwell, 1995). 2.2.7. Functions of iron Iron has been referred to as a precious metal due to its numerous biological roles (Bernuzzi & Recalcati, 2006). Iron is a co-factor in many enzyme systems, energy generation proteins and deoxyribonucleic acid (DNA) synthesis, as well as being an important component of Hb and myoglobin which transport and metabolise oxygen (Ma et al., 2011; Bernuzzi & Recalcati, 2006; Minihane & Rimbach, 2002; Lombard, Chua & O’Toole, 1997). Iron is crucial for the daily production of approximately 200 billion erythrocytes, which occurs in bone marrow (Thompson et al., 2011). 2.2.8. Oxygen transport Oxygen is necessary for the survival of all living creatures (Dunn, et al., 2006). This highlights the critical role of Hb, which transports oxygen throughout the body and requires iron to do so (Minihane & Rimbach, 2002). The efficient transport of oxygen also requires an optimal pH environment; Hb and oxygen are thought to bind more easily in an acidic environment (Means, 2012; Jensen, 2004; Nikinmaa, 1997). When pH rises, such as in the presence of CO2, oxygen binds less frequently to Hb and more is released into the cells for utilization (Means, 2012; King, 1996). 2.2.9. Energy production Iron plays a role in energy metabolism as part of its many vital roles in the body. Iron is a component of cytochromes, which are electron-carrying respiratory chain proteins that are 16.
(38) responsible for energy production and associated with the metabolism of macronutrients (Minihane & Rimbach; 2002; Frazer & Anderson, 2005). Inadequate iron levels may affect cytochrome function resulting in decreased energy production, especially during periods of increased energy requirements. Table 2.2 shows the iron compounds involved in oxidative metabolism and energy production (Mahan & Escott-Stump, 2004; Haas & Brownlie, 2001). Table 2.2: Iron compounds in oxidative metabolism and energy production Name of protein. Functional site. Major biological functions in energy production. Haemoglobin. Red blood cell. Oxygen transport. Myoglobin. Cytoplasm of muscle cells. Facilitate diffusion of oxygen towards the mitochondria. Oxidative enzymes such as; Dehydrogenase. Mitochondria inner membrane and matrix. Oxidation of substrate (acetyl-CoA) to produce NADH and FADH2. Respiratory chain proteins such as cytochromes. Mitochondria inner membrane. Electron (electrochemical energy) transfer from O2 molecule to NADH or FADH2. Note: NADH-Nicotinamide adenine dinucleotide plus Hydrogen FADH2-Flavin adenine dinucleotide (hydroquinone form) Sources: Haas & Brownlie (2001).. 2.2.10.. Iron in enzymes. Iron plays an important role in some of the key enzymes in the tricarboxylic acid (TCA) cycle, as well as enzymes involved in amino acid and lipid metabolism (Tong & Rouault, 2006). Iron is also part of the antioxidant enzyme system that combats free radicals. However, excess amounts of iron in the body can be pro-oxidative (Rouault, 2006; Mahan & Escott-Stump, 2004; Minihane & Rimbach, 2002). Iron is a co-factor for ribonucleotide reductase, an important enzyme for DNA synthesis. Although DNA enzymes comprise very little of the total body iron (Pinero & Connor, 2000), ID has been found to inhibit both DNA synthesis and cell division, leading to severe consequences (Kawabata et al., 2000; Mahan & Escott-Stump, 2004).. 17.
(39) A review of experimental studies showed that ribonucleotide reductase from calf thymus has an activity span of only 10 minutes when iron is removed (Thelander, Eriksson & Akerman, 1980) and there was a marked decline in the levels of DNA in the thymus and spleen of iron deficient rats compared to well-nourished rats (Kochanowski & Sherman, 1985).. The. importance of iron for DNA synthesis has been further confirmed by studies in humans which show that deferoxamine, a chelator of iron, inhibits DNA production in T- and B-lymphocytes. When deferoxamine was removed, iron levels were restored and DNA production resumed (Lederman et al., 1984). 2.2.11.. Cognitive development. The brain has a huge demand for iron because of its high energy requirements. Iron is a critical factor for normal cognitive development and neurological functioning, due to its roles as a co-factor for tyrosine hydroxylase (norepinephrine), tryptophan hydroxylase (serotonin) and dopamine (DA), which are necessary for neurotransmitter synthesis (Beard, 2003; Pinero & Connor, 2000). A decline in brain iron levels as a result of poor dietary intake is correlated with a reduced concentration of D2 and D1 receptors which in turn distorts DA neurotransmission in striatum leading to poor cognitive function (Beard, 2003). Several studies have shown that ID reduces neuronal metabolism in all brain regions, and hampers the myelination process and affects the development of neurotransmitters thus impairing the brain functions (de Ungria et al., 2000; Lozoff, 2011). Table 2.3 shows the adverse effects of ID on the functions of some important neurochemicals in the brain and the damage that could occur during the brain development.. It also indicates that some of the setbacks caused by ID during brain. development were permanent while other damages could be corrected with early and appropriate treatment (Yager & Hartfield, 2002).. 18.
(40) Table 2.3: Effects of ID on neurochemical functions Neurochemical. Metabolic Effect. Clinical Effect. Reversibility. GABA. +/- GABA decreases GAD, GABA-T. Impaired neurotransmitter regulation of hypothalamichypophyseal hormones involved in behavioural regulation. Irreversible in gestational ID. Dopamine. Decreased D2 receptor binding sites Increased phenylalanine secondary to decreased phenylalanine hydroxylase activity Decreased 5-HT via decreased tryptophan or tyrosine hydroxylase activity or decreased 5-HT via decreased degradation by aldehyde oxidase. Decreased motor activity and learning processes. Irreversible. Decreased learning secondary to “PKU-like” effect. Reversible. Impairs neurodevelopment or increases drowsiness, decreases attention and learning due to serotonergic effect. Irreversible or reversible. Phenylalanine. Serotonin. Abbrev; GABA- γ aminobutyric acid. 5- HT - 5-Hydroxytryptophan. GAD- Glutamate decarboxylase. PKU – Phenylketonuria.. Source: Adapted from Yager & Hartfield, (2002).. This information supports the importance of adequate iron levels in women of reproductive age, even before pregnancy. In a blinded, placebo-controlled intervention study involving cognitive assessment and iron supplementation in women of reproductive age, women without ID/IDA performed better in cognitive assessments and were able to complete tasks faster than the IDA group. After 16 weeks of supplementation, a five to seven-fold improvement in their cognitive tasks performance was seen in women with increased SF, and women whose Hb levels had improved completed cognitive tasks more quickly (Murray-Kolb & Beard, 2007). Similarly, Conlon et al. (2009) reported a positive correlation between ID without anaemia and 19.
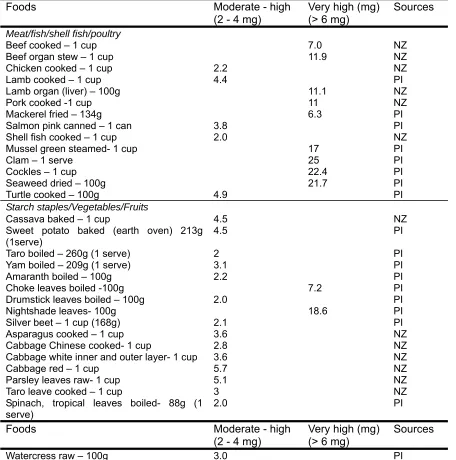
(41) reduced working memory and processing speed in female students (n=52) who did not speak English as their first language compared to those with normal iron status (n=42). This shows that the impact of ID/IDA on cognition is not limited to the developing brain alone (Murray-Kolb & Beard, 2007), and adequate iron levels are necessary for healthy cognitive function into adulthood. 2.2.12.. Iron and Immunity. Iron can influence the course of infection in two ways. Firstly, iron is a critical component of many immunological proteins, such as the enzymes responsible for peroxide and nitrous oxide generation that support proper functioning of the immune cells (Beard, 2001). Therefore, immune function can be compromised in a state of ID. A reduction in both T-lymphocyte numbers and T-lymphocyte blastogenesis and mitogenesis in various mitogens has also been observed in ID, and both were corrected with repletion of iron (British Nutrition Foundation, 1995). This demonstrates that iron is an important part of the immune response to infection. 2.3.. Daily iron requirements for non-pregnant, non-lactating women of reproductive age According to the Australia and NZ Nutrient Reference Values (MoHNZ, 2006), women of reproductive age need about 18 mg of iron per day to meet physiological needs and replenish iron losses. Women’s iron requirements are higher than the recommendation according to their physiological needs for instance during pregnancy and lactation (Picciano, 2003; Bothwell, 2000; Hallberg & Rossander-Hulten, 1991). 2.3.1. Dietary sources of iron Dietary iron is found in both animal and plant sources. Haem iron from animal foods is of high biological value compared to non-haem iron from plant and animal sources. The best sources of iron are animal organs (liver, kidney and heart) and meat and seafood (lean meat, poultry, fish and oysters as well as egg yolk). Other sources are plant foods such as dried beans and vegetables, dried fruits, dark molasses, whole grain, enriched breads, and cereals (Mahan & Escott-Stump, 2004).. The major sources of iron in NZ are bread, breakfast cereals,. vegetables, grains and pasta, potato, kumara and taro, bread based dishes and non-alcoholic drinks (MoHNZ, 2011). documented.. Dietary sources of iron in the Solomon Islands are not well. However, cooked cassava leaves, wing bean leaves, kangkong (Ipomoea 20.
(42) aquatic) or swamp cabbage and fern are reported to be high in iron (French, 2010). However, cassava and wing bean leaves are not commonly consumed by Solomon Islanders although these are available in the Solomon Islands (anecdotal source). Table 2.4 presents iron food sources that are commonly consumed in NZ and the Pacific Islands according to the food composition tables from NZ and from the Pacific Islands (MoHNZ, 2006; Food Agriculture Organization, 2004). The food items were placed under their iron content categories as moderate-high and very high adapted from Beck et al. (2011). Table 2.4: Dietary sources with moderately high to high iron content Foods Meat/fish/shell fish/poultry Beef cooked – 1 cup Beef organ stew – 1 cup Chicken cooked – 1 cup Lamb cooked – 1 cup Lamb organ (liver) – 100g Pork cooked -1 cup Mackerel fried – 134g Salmon pink canned – 1 can Shell fish cooked – 1 cup Mussel green steamed- 1 cup Clam – 1 serve Cockles – 1 cup Seaweed dried – 100g Turtle cooked – 100g Starch staples/Vegetables/Fruits Cassava baked – 1 cup Sweet potato baked (earth oven) 213g (1serve) Taro boiled – 260g (1 serve) Yam boiled – 209g (1 serve) Amaranth boiled – 100g Choke leaves boiled -100g Drumstick leaves boiled – 100g Nightshade leaves- 100g Silver beet – 1 cup (168g) Asparagus cooked – 1 cup Cabbage Chinese cooked- 1 cup Cabbage white inner and outer layer- 1 cup Cabbage red – 1 cup Parsley leaves raw- 1 cup Taro leave cooked – 1 cup Spinach, tropical leaves boiled- 88g (1 serve). Moderate - high (2 - 4 mg). Very high (mg) (> 6 mg). Sources. 7.0 11.9. 4.9. NZ NZ NZ PI NZ NZ PI PI NZ PI PI PI PI PI. 4.5 4.5. NZ PI. 2 3.1 2.2. PI PI PI PI PI PI PI NZ NZ NZ NZ NZ NZ PI. 2.2 4.4 11.1 11 6.3 3.8 2.0 17 25 22.4 21.7. 7.2 2.0 18.6 2.1 3.6 2.8 3.6 5.7 5.1 3 2.0. Foods. Moderate - high (2 - 4 mg). Watercress raw – 100g. 3.0. Very high (mg) (> 6 mg). Sources PI. 21.
(43) Peas green boiled – 1 cup Vegetable mixed European boiled – 1 cup Apricot dried – 1 cup Current dried – 1 cup Date dried- 10 dates Fig ficus carioca dried- 1 cup Lychee dried – 100g Pandanus paste – 100g Raisin – 1 cup Prune – 100g Rambutan – 100g Tamarin flesh – 100g Nuts and seeds – 100g Legumes – 100g Bakery foods Biscuit ANZAC home made – 100g Biscuit chocolate base, wheat – 100g Bread 9 grain, tip top fortified – 100g Cracker, well grain, vita life Griffins – 100g Cracker whole meal sesame – 100g Lamington chocolate (1 slice) Breakfast cereals All breakfast cereal Drinks Complan powder – 100g Milo powder – 100g Chocolate drinking powder – 100g Cocoa powder – 100g Coffee instant powder – 100g So good, soy drink – 100g Other foods Tofu – 1 cup Tempeh (fermented soy bean) Fast food Beef with cashews – 1 cup Beef satay – 1 cup MacDonald - 1 burger Burger bacon -1 Burger cheese- 1 Chicken with garlic &chilli sauce – 1 cup Chopsuey pork – 1cup Curry, Indian beef takeaway – 1 cup Curry, Indian butter chicken – 1 cup Curry, Indian chicken masala – 1 cup Curry, Indian dhal – 1 cup Curry lamb – 1 cup Omelette egg, Foo young –I serve Mince pie - 1. 8.4 3.0 4.2 3.5 2.2 2.9 4.4 5.7 6.5 4.2 2.5 11.0 1.4 - 10 1.3 – 9.0 2.2 2.4. PI PI PI PI PI PI PI PI PI PI PI PI PI PI. 2.4 2.1. NZ NZ NZ NZ NZ NZ. 3.0 – 10. NZ. 6.1 8.3. 6.6 4.5 2.4 10.5 4.4 2.3. NZ NZ NZ NZ NZ NZ. 14.1 7.8. NZ NZ. 8.1 7.6. NZ NZ NZ NZ NZ NZ NZ NZ NZ NZ NZ NZ NZ NZ. 3.9 4.6 4.3 2.5 3.3 6.2 4.6 5.4 14.5 11.2 9.0 9.5. Sources: MoHNZ, (2006) & Food Agriculture Organization, (2004) Note: Some other foods that contain iron have not been included in Table 2.4 due to their low iron content or limited availability and consumption.. 22.
(44) 2.4.. Iron deficiency. Iron deficiency is often described as a condition that progresses from one stage to the next without early detection and treatment. ID is the stage in which iron stores are depleted but with a normal concentration of haemoglobin. Iron deficiency anaemia is the advance stage of ID where the haemoglobin concentrations fall below 120 g/L in women and can seriously affect health (Hercberg, Preziosi & Galan, 2001). Figure 2.4 illustrates the developmental stages of ID to IDA. Stage 1: Iron depletion (mild deficiency) Characteristics: low iron stores, normal haemoglobin levels and normal iron-dependent protein production. Stage 2: Iron deficient erythropoiesis (marginal deficiency) Characteristics: depleted iron stores, decreased iron-dependent protein production and normal haemoglobin concentrations. Stage 3: Iron deficiency anaemia (IDA) Characteristics: a reduction in the concentration of haemoglobin in the erythrocytes. Source: Adapted from Coad & Conlon (2011). Figure 2. 4: Developmental stages of iron deficiency 2.4.1. Assessment of iron deficiency and iron deficiency anaemia Assessment of iron status requires the measurement of a combination of biomarkers for increase sensitivity, better diagnosis and treatment as ID/IDA may occur due to different causes and may require different management approaches (Pollitt, 1993; Clark, 2009). According to the WHO (2011a), serum ferritin (SF) concentration is the preeminent marker of iron status. This is supported by a meta-analysis of nine randomised iron intervention trials, which found that SF showed a larger and more consistent response to iron intervention than the other biomarkers that were assessed (Mei et al., 2005).. Haemoglobin and SF were. measured in all nine studies, alongside a range of other iron indicators such as mean cell volume (MCV), erythrocyte protoporphyrin and transferrin receptors. The results of the meta23.
(45) analysis suggested that Hb and SF are the most useful combination of indicators for monitoring change in the iron status of a population (Mei et al., 2005). Serum ferritin Ferritin is a protein which stores iron for use when the body requires it (Remacha, et al., 1998). The measurement of ferritin in the serum has been identified as the best diagnostic test for ID because it is a measurement of iron stores in the body. Iron deficiency is indicated by a SF concentration < 20 µg/L (Beck et al., 2011). However, as an acute phase reactant, SF can also be influenced by the presence of infection or inflammation such as in rheumatoid arthritis, liver disease or malignancies (e.g. myeloma, lymphoma) (Krol & Cunha, 2003). In a state of inflammation, a person’s SF may appear normal or increased even if they are deficient in iron; this has been noted in haemodialysis patients (Kalantar-Zadeh et al. 2004) and in those with systemic lupus erythematosus (Lim et al., 2001).. Oral contraceptive and iron. supplement use can also increase SF; therefore caution must be taken if measuring SF in isolation as this could lead to an underestimation of the presence or prevalence of ID (Arneson & Brickell, 2007; Remacha et al., 1998). C-reactive protein The WHO (2011a) recommends that measurement of SF should be accompanied by the analysis of one or more acute phase proteins (APPs), namely C-reactive protein (CRP) and α1 - acid glycoprotein (AGP) to verify SF in the diagnosis of ID. This is based on the information from a review of 32 studies involving healthy participants from different population groups to estimate the increase in SF associated with inflammation (Thurnham et al., 2010).. An. increased amount of AGP and CRP are released into the blood when infection, inflammation or tissue damage is present in the body (Hochepied et al., 2003; Reeves, 2007), and thus these measurements can indicate whether the SF concentration may be falsely elevated. A value outside of the normal ranges (CRP > 5 mg/L and/or AGP > 1g/L) warrants extensive investigation (Arneson & Brickell, 2007) as this is a sign of infection. Haemoglobin Haemoglobin is a protein comprising globin and haem, and its primary function is to transport oxygen from the lungs to tissues throughout the body. A reduction in red blood cell Hb 24.
(46) concentration results in IDA (Remacha et al., 1998), which is indicated by Hb < 120 g/L (WHO, 2001). However, Hb is not always a reliable biomarker, as it lacks specificity for categorising iron status (Mei et al., 2005). Haemoglobin concentrations can be affected by other factors; therefore, it is best to assess Hb together with another iron biomarker such as SF (Mei et al., 2005). Despite its limitations, Hb is still the most commonly used biomarker for assessing iron status in circumstances where resources are limited, such as in developing countries like the Solomon Islands (Yip & Ramakrishnan, 2002; SPC, 2009b). 2.5.. Consequences of iron deficiency and iron deficiency anaemia in women. There are a number of adverse consequences of ID and IDA in women of reproductive age, including increased risk of maternal mortality (WHO/UNICEF, 2004). A WHO analysis on global causes of maternal death found that IDA is responsible for 12.8% of maternal deaths in Asia and 3.7% in Africa (Khan et al., 2006). Women with ID/IDA also have a higher risk of infection, poor pregnancy outcomes (such as low birth weight (LBW; < 2500 g) neonates, poor foetal neuro-cognitive development, preterm delivery, haemorrhage and death), impaired cognitive function, impaired thermoregulation, immune dysfunction, and reduced work capacity and symptoms such as irritability, fatigue, depression, less concentration and apathy (de Benoist et al., 2008; Conlon et al., 2009; Zimmermann & Hurrell, 2007; Lozoff et al., 2006; Beard et al., 2005; WHO/UNICEF, 2004; World Bank, 2004; Rasmussen, 2001; Steer, 2000). Some of the effects caused by ID may have negative effects on maternal quality of life, and may cause permanent damage and disability to their offspring (Lozoff et al., 2006). As IDA can have major adverse implications for maternal health, and can have effects on foetal health that persist into adulthood, adequate iron status of women of reproductive age is vital (Mora & Nestel, 2000). More than 50% of LBW cases in developing countries are related to maternal nutritional status before and during pregnancy (Ramakrishnan, 2004). Approximately half of LBW infants in developed countries are born preterm (< 37 weeks gestation) and others are affected by intrauterine growth restriction (Ramakrishnan, 2004). A study of Pakistani women found those 25.
Figure


+7


Outline
Related documents
Spatial distribution of the volume-related cadmium content of 50 ~m net plankton in the German Bight during the PRISMA summer cruise in August 1991.. Symbol size
We conducted a qualitative study of the social contextual factors that influenced adherence in the VOICE (MTN-003) trial in Johannesburg, South Africa, focusing on study
Methods: Stereoacuity testing was performed in 28 children with IXT and 25 age-matched control subjects using the SC test, the distance Randot stereotest for distance, and the Titmus
51 The failure to develop consistent international principles relating to international banks, the lack of standardised and consistent international rules, and the lack of
The finite element analysis was used for numerical calculation of the stress distribution and failure index of posterior cruciate ligament.. The obtained failure index showed
One striking notion of physicality in the play is the fact that the human body.. seems to be almost entirely possessed and controlled by what Heidegger
Results: Recombinant Pichia pastoris transformants with high levels of secretory rHtA were screened, and in a fed- batch reactor, rHtA was secreted at levels up to 80 mg/l
Some of them are related to the way content objects are requested, some are related to the optimal routing scheme for content object requests, and others investigate the capability
