assessment of dietary ratios of red clover and grass silages
on milk production and milk quality in dairy cows
J. m. moorby,*1 m. r. F. Lee,* D. r. Davies,* e. J. Kim,* G. r. nute,† n. m. ellis,* and n. D. Scollan*
*Institute of Biological, environmental and Rural Sciences, Aberystwyth University, United Kingdom †Division of Farm Animal Science, University of Bristol, United Kingdom
aBStraCt
Twenty-four multiparous Holstein-Friesian dairy cows were used in a replicated 4 × 4 Latin square changeover design experiment to test the effects of changing from ryegrass (Lolium perenne) silage to red clover (Trifolium pratense) silage in graded proportions on feed intakes, milk production, milk organoleptic qualities, and whole-body nitrogen partitioning. Four dietary treatments, comprising ad libitum access to 1 of 4 forage mixtures plus a standard allowance of 4 kg/d dairy concentrates, were offered. The 4 forage mixtures were, on a dry matter (DM) basis: 1) 100% grass silage, 2) 66% grass silage: 34% red clover silage, 3) 34% grass silage: 66% red clover silage, and 4) 100% red clover silage. In each of 4 experimental periods, there were 21 d for adaptation to diets and 7 d for measurements. There was an increase in both DM intakes and milk yields as the proportion of red clover in the diet in-creased. However, the increase in milk yield was not as great as the increase in DM intake, so that the effi-ciency of milk production, in terms of yield (kg) of milk per kg of DM intake, decreased. The concentrations of protein, milk fat, and the shorter chain saturated fatty acids decreased, whereas C18 polyunsaturated fatty acids (PUFA) and long-chain PUFA (C20+) increased as the proportion of red clover in the diet increased. There was little effect of dietary treatment on the or-ganoleptic qualities of milk as assessed by taste panel analysis. There were no effects on the aroma of milk, on aftertaste, or overall liking of the milk. Milk was thicker and creamier in color when cows were fed grass silage compared with red clover silage. The flavor of milk was largely unaffected by dietary treatment. In conclusion, increasing the proportion of red clover in the diet of dairy cows increased feed intakes and milk yields, decreased the concentration of fat and protein in milk, increased PUFA for healthiness, and had little effect on milk organoleptic characteristics.
Key words: milk fatty acids, nitrogen balance, orga-noleptic quality, red clover silage
IntrODuCtIOn
As a legume, red clover (Trifolium pratense) requires no nitrogen fertilizer making it suitable as a home-grown protein source for low-input or organic farming systems (Wilkins and Jones, 2000). Accumulation of soil N following a crop of red clover has the potential to reduce fertilizer N requirements (Lafond and Pageau, 2007) and thus reduce greenhouse-gas emissions from fertilizer use when included as part of a rotation. The potential use of ensiled red clover for milk production has been recognized for many years, with early data suggesting that feed intakes are greater than with grass silage (Castle and Watson, 1974). More-recent work has demonstrated improvements in milk production when feeding red clover as the sole forage compared with grass silage (Bertilsson and Murphy, 2003; Dewhurst et al., 2003b; Al-Mabruk et al., 2004), primarily because of greater intakes of red clover silage than grass silage. However, N digestibility of red clover silage tends to be lower than that of grass silage (Bertilsson and Murphy, 2003; Dewhurst et al., 2003b) and the efficiency of use of feed N tends to be lower as more N is excreted in feces of cows consuming red clover silage.
Although grass pastures can be both grazed and ensiled in a single season, the opportunity for use of this system of management is much less for red clo-ver. The area of land that a dairy farmer can devote to a red clover crop for ensiling is likely to be small; therefore, red clover silage is most likely to be used strategically at a particular stage of lactation or mixed with other crops. Thomas et al. (1985) found immedi-ate advantages but no beneficial carry-over effects of feeding red clover silage alone in early lactation or later in the same lactation, although mixing red clover with grass silage can offer benefits similar to those of feeding red clover silage alone (Bertilsson and Murphy, 2003; Dewhurst et al., 2003b). However, there is some evi-dence that the organoleptic qualities of milk produced using red clover silage are not as good as those
pro-doi:10.3168/jds.2008-1771
© American Dairy Science Association, 2009.
Received October 1, 2008. Accepted November 1, 2008.
duced from grass silage (Bertilsson and Murphy, 2003). This is potentially a result of changes in the fatty acid profile of milk produced from red clover silage, with increased concentrations of polyunsaturated fatty acids (PUFA) (Dewhurst et al., 2003b; Al-Mabruk et al., 2004; Vanhatalo et al., 2007), which may also lead to a reduction in the keeping qualities of the milk produced (Al-Mabruk et al., 2004). Increased concentrations of PUFA in milk result from the activity of the enzyme polyphenol oxidase (PPO; EC 1.10.3.1), which is pres-ent in high concpres-entrations in red clover and reduces lipolysis and hence microbial biohydrogenation of fatty acids in the rumen (Lee et al., 2007, 2008).
Escherichia coli O157 is pathogenic in humans, with dairy herds being a potential source of contamination of the food chain (Wells et al., 1991; Zhao et al., 1995). Certain plant secondary compounds, including several coumarins, are known to inhibit the growth of E. coli O157 when incubated in rumen fluid (Duncan et al., 1998). Red clover contains high concentrations of plant secondary compounds, and although it is best known for its isoflavanoid content, red clover hay has been shown to reduce the amount of E. coli in cattle rumen contents (Jacobson et al., 2002). Feeding different conserved for-ages also had effects on fecal bacteria counts (Jacobson et al., 2002), and it was hypothesized that changing red clover silage to grass silage may alter the fecal bacterial population, including E. coli O157 counts.
The objectives of this experiment were to investigate the effect of mixing red clover and ryegrass silages at different ratios on feed intake, milk production, and whole-body N partitioning in dairy cows. The effects of diet on milk fatty acid profiles and the organoleptic qualities of the milk produced were also investigated. Diet effects on gut microbial populations were also in-vestigated by studying feces.
materIaLS anD metHODS
Cows and Management
All procedures used in this experiment were licensed and regulated by the UK Home Office under the Ani-mals (Scientific Procedures) Act of 1986. Twenty-four multiparous Holstein-Friesian dairy cows were used in the experiment, with a mean BW of 651 (SD 56.0) kg and 103 (SD 28.7) DIM. The experimental design was a 4 × 4 Latin square with 6 replicated squares. Cows were kept in a free-stall barn at all times, except for a subset of the animals (n = 8) that were transferred to a metabolism unit for feed digestibility and nitrogen partitioning measurements for 10 d during each period of the experiment. Each experimental period lasted 28 d and was divided into an adaptation period (the first 21 d) and a measurement period (the last 7 d).
For 3 wk before the start of the experiment all ani-mals were fed a common covariate diet with ad libitum access (with refusals of at least 0.1 of the quantity offered) to grass silage and red clover (1:1 mix on a fresh matter basis) plus 4 kg/d of a standard purchased dairy concentrate feed (Dairy XGM 18 Nuts, Welsh Feed Producers, Carmarthen, UK). Cows were assigned to 1 of 6 replicate groups (Latin squares) of 4 animals shortly before the start of the experiment based on milk yield data collected over the week before the start of the experiment. Animals were ranked from highest to lowest milk yields: the top 4 yielding cows were then allocated to square 1, the next 4 yielders to square 2, and so on, with the lowest 4 yielding animals allocated to square 6. Within each Latin square, animals were allocated at random to each of the 4 treatments. Cows in Latin squares 1 and 4 were used for digestibility and whole-body N partitioning measurements.
Four dietary treatments were used in the experi-ment. These consisted of ad libitum access to 1 of 4 forages, comprising mixtures of grass and red clover silages, together with an allowance of 4 kg of the same concentrate per day (offered as 2 kg at each milking, at approximately 0500 and 1500 h). The forage treat-ments, prepared on a DM basis, were 1) 100% peren-nial ryegrass silage (Lolium perenne), R0; 2) 66%:34% perennial ryegrass:red clover silage, R34; 3) 34%:66% perennial ryegrass:red clover silage, R66; and 4) 100% red clover silage, R100. The grass silage was prepared as a large bunker from a perennial ryegrass sward using an inoculant (Powerstart, Genus plc, Nantwich, UK) according to the manufacturer’s guidelines. The grass was chopped at collection before ensilage, with the for-age harvester knives set to give a chop length of ap-proximately 25 mm. The red clover silage was prepared as large round bales from second and third cuts of a monoculture sward of red clover (cv. ‘Milvus’), also us-ing Powerstart as an inoculant at ensilus-ing; the red clover crop was not chopped before baling. During the experi-ment, the red clover used was a mixture of the 2 silage cuts in a ratio of 1 bale second-cut to 1 bale third-cut. The concentrate feed, that was fed in equal quantities to all cows, comprised wheat (40%), extracted rapeseed meal (17.5%), palm kernel expellers (10%), citrus pulp (7.5%), high-protein soy (6.5%), molasses (6.0%), ex-tracted sunflower meal (6.0%), Megalac (3.0%; Volac International Ltd., Royston, UK), sugar beet pulp (1.5%), and a mineral and vitamin mix (2.0%) certified to contain 9,000 IU of vitamin A, 2,000 IU of vitamin D3, 30 mg of α-tocopherol, 50 mg of copper (as sulfate, carbonate, and metalosate), and 750 µg of selenium (as sodium selenite) per kilogram of the fresh concentrate.
120 mixer wagon fitted with a chopping auger (Rus-ton’s Engineering Co. Ltd., Huntingdon, UK). Forage was dispensed into individual feed bins of forage intake control feeders (Insentec B.V., Marknesse, the Nether-lands) to allow automatic recording of ad libitum feed intakes in the free-stall barn, or into individual feed tubs (in the metabolism unit) as required, with cold storage (4°C) if kept for more than 1 d.
Between each experimental period, dietary treat-ments were switched from one to the other over the course of 4 d in steps of 25% difference between cur-rent and subsequent treatments. For example, chang-ing from diet 1 (100% ryegrass silage) to diet 3 (34% ryegrass silage), cows were given diets in which the forage component was approximately 84, 68, and 52% ryegrass (the remainder being red clover) on the first, second, and third days, respectively, at the start of the new period, and onto their final diet with 34% ryegrass on the fourth day.
Measurements and Sample Analysis
Feed intakes and milk yields were recorded daily throughout the experiment, but only those data re-corded during the last week of each period were used in statistical analyses. Samples of feed were collected and bulked weekly for analysis, with storage at −20°C. Con-centrate samples (for all analyses) and silage samples (for freeze-DM, water-soluble carbohydrates, total N, pH, ammonia-N, VFA, and lactic acid) were submitted fresh (frozen). All other analyses were carried out using freeze-dried material; samples were dried to a constant weight to determine freeze-DM content. Silage pH was determined after water extraction using a Hydrus 400 pH meter (Fisher Scientific UK, Loughborough, UK). Ammonia-N concentration was determined enzymati-cally using glutamate dehydrogenase on a discrete ana-lyzer (FP-901M Chemistry Anaana-lyzer, Labsystems Oy, Helsinki, Finland; test kit no. 66-50, Sigma-Aldrich Co. Ltd., Poole, Dorset, UK). Silage lactate concentration was analyzed using l-lactate dehydrogenase (Boehring-er Mannheim test kit no. 10 139084 035, R-Biopharm Rhône Ltd., Glasgow, UK). Volatile fatty acids were determined by gas chromatography using a Chrompack CP 9002 chromatograph (CP-Sil 5CB column 10 m × 0.25 mm internal diameter; Varian Inc., Palo Alto, CA) following the method of Zhu et al. (1996). Sample OM concentration was determined by combustion at 550°C for 6 h in a muffle furnace. Silage residual water-soluble carbohydrate concentrations were determined as described by Thomas (1977). Total N concentration was determined using a Leco FP 428 nitrogen analyzer (Leco Corporation, St. Joseph, MI), and expressed as CP (total N × 6.25) concentration. Fiber analyses were
carried out with the aid of Fibertec equipment (Teca-tor Ltd., Thornbury, Bristol, Somerset, UK). Neutral detergent fiber assayed with a heat-stable amylase and expressed inclusive of residual ash was determined as described by Van Soest et al. (1991). Acid detergent fiber expressed inclusive of residual ash was analyzed according to the method of Van Soest and Wine (1967). Ether extract was determined using Soxtec System HT6 equipment (Perstorp Analytical Ltd., Berkshire, UK) using petroleum ether at 40 to 60°C as the solvent.
Body weight and BCS at the loin and tailhead (us-ing a 0 to 5 scale; Mulvany, 1977) were recorded at the start of the experiment and at the end of each experimental period. Milk samples (approximately 300 mL in total per cow) were collected for organoleptic qualities at each of 2 consecutive milkings at the end of each period on a Monday afternoon and Tuesday morning, and bulked and stored (without preservative) in a food-grade refrigerator. These bulked samples were pasteurized on the Tuesday morning by heating to 63°C and maintaining this temperature for 30 min in a water bath, and were then subsampled. Approximately 100 mL of the subsampled pasteurized milk sample was stored (frozen at −20°C, without preservative) for analysis of fatty acids. A remaining pasteurized sample was trans-ported to Bristol University for taste panel analysis of organoleptic quality on the Thursday of each collec-tion week. Addicollec-tional individual morning and evening milking samples of the same (unpasteurized) milk (ap-proximately 50 mL, with milk preservative) was sent for near infrared analysis of fat, protein, and lactose (National Milk Records, Chippenham, Wiltshire, UK).
cow was collected and subsampled. Part of this sample was stored frozen at −80°C for analysis by denatur-ing gradient gel electrophoresis (DGGE), and another part was kept fresh (chilled to 4°C) for assessment of E. coli O157 populations.
Milk fatty acids from thawed milk samples were extracted and methylated using the base-only method of Lee and Tweed (2008). Fatty acids were analyzed using a Varian CP3800 gas chromatograph fitted with a flame-ionization detector (Varian Ltd., Oxford, UK) and a CP-Select column (100 m × 0.25 mm × 0.2 µm; Varian Ltd.) as described by Lee et al. (2005).
Feces E. coli O157 populations were enumerated un-der aseptic conditions by the following method. A 30-g subsample of feces was added to 270 mL of Ringer’s solution in a Stomacher lab blender (Seward Ltd., Thetford, UK) bag and blended for 3 min. A sterile pipette was used to transfer 1 mL of this initial inocu-lum into 9 mL of Ringer’s solution to achieve a 1 in 10 dilution. A series of dilutions from 10−2 to 10−8 were prepared by repeated 1 in 10 dilutions for culturing. All dilutions were mixed using a vortex mixer for 5 to 10 s before plating. Sterile Petri dishes, previously prepared with sorbitol MacConkey agar containing 5-bromo-4-chloro-3-indoxyl-β-d-glucuronide (CM0981, Oxoid Ltd., Basingstoke, UK) with a cefixime tellurite selective supplement (SR0172E; Oxoid Ltd.) for the isolation of E. coli O157 (added at 1.25 mg per 500 mL of agar solution), were spread with 100-µL aliquots of the required inoculum dilutions. The Petri dishes were inverted and incubated at 37°C for 24 h. Total counts of E. coli colonies, and those of E. coli O157, were re-corded on dilution plates with appropriate numbers of colonies, which were then back-calculated to give the number of colony-forming units per gram of feces.
Genomic DNA was extracted from fecal microbial samples (10 mg DM) using the BIO101 FastDNA SPIN Kit for Soil (Qbiogene Inc., Cambridge, UK) in con-junction with a FastPrep cell disrupter instrument (Bio101, ThermoSavant, Qbiogene Inc.) according to the manufacturer’s instructions, with the exception that the samples were processed for 3 × 30 s at speed 6.0 in the FastPrep instrument. Integrity of the DNA was verified by agarose gel electrophoresis.
Amplification of the V6-V8 region of the 16S rRNA gene was carried out with the primer pair F968GC (5′-CGC CCG CCG CGC GCG GCG GGC GGG GCG GGG GCA CGG GGG GAA CGC GAA GAA CCT TAC-3′) and R1401 (5′-CGG TGT GTA CAA GAC CC-3′) for total eubacterial population. All PCR amplifications were performed using a 2720 thermal cycler (Applied Biosystems, Warrington, UK) in 50-µL volumes containing 1 × PCR buffer (20 mmol/L Tris HCl, pH 8.4, 50 mmol/L KCl), 3 mmol/L MgCl2, 200
µmol of l-deoxyribonucleotide triphosphate (dNTP) mix, 500 nmol/L of each primer, and 1.25 U of iTaq DNA polymerase (Bio-Rad Laboratories Ltd., Hemel Hempstead, UK) with approximately 100 ng of DNA template. Amplification conditions were an initial de-naturation of 95°C for 3 min followed by 35 cycles of 95°C for 30 s, 56°C for 30 s, and 72°C for 1 min and then a final extension of 72°C for 5 min. Amplification of products was verified by agarose gel electrophoresis. Amplicons were loaded onto 6% polyacrylamide gels with a 35 to 60% denaturing gradient [100% denatur-ant consisting of 40% (vol/vol) deionized formamide and 7 M urea], and electrophoresis was performed in a DCode system (Bio-Rad Laboratories Ltd.). Gels were run initially for 10 min at 200 V, before electrophoresis for 16 h at 85 V in 0.5 × Tris-acetate EDTA buffer at a constant temperature of 60°C (Huws et al., 2007). Gels were then stained with AgNO3 (Sanguinetti et al., 1994). Gels were scanned using a GS-710 calibrated imaging densitometer (Bio-Rad Laboratories Ltd.) and the saved image imported into the Fingerprinting soft-ware package (Bio-Rad Laboratories Ltd.) for analysis. Banding patterns were analyzed based on the presence and absence of the bands, and resultant binary ma-trices were translated into distance mama-trices using the Dice similarity coefficient, with a position tolerance of 0.5% and optimization parameter of 1%.
For measurement of protein-bound phenol, freeze-dried and ground silage samples (approximately 1 g DM) were ground in liquid N2 and extracted in 2 mL of McIlvaine buffer, pH 7.0, including 0.5% lithium dodecylsulfate and 75 mM ascorbic acid. Extracts were sonicated for 5 min, subsequently boiled for 3 min, centrifuged at 15,000 × g for 10 min at 4°C and the supernatant retained. Soluble protein was precipitated by addition of 1 mL 20% trichloroacetic acid, 0.4% phosphotungstic acid to 1 mL of extract. Following incubation for 30 min at 0°C, precipitated protein was pelleted by centrifugation at 15,000 × g for 10 min at 4°C. The supernatant was retained for soluble free phenol analysis and the protein pellet, which included protein-bound phenol, dissolved in 6 mL of 0.1 M NaOH and analyzed for protein and phenol content according to the method of Winters and Minchin (2005). The supernatant containing the soluble free phenols were adjusted to neutral pH by combining 480-µL volumes with 265 µL of 1M NaOH. Analysis of soluble free phe-nols was then carried out as described by Veltman et al. (1999) using tyrosine as a standard.
Taste Panel Analysis
British Standards Institution (1993). A training set of milk samples was used to give assessors experience of tasting milk and to derive terms for the profile. This training set consisted of 4 types of whole milk: West Country milk, organic whole milk, Jersey milk, and Jer-sey and GuernJer-sey milk. A suggested descriptive profile (Hedegaard et al., 2006) was initially given to each as-sessor as a potential guide. The final sets of descriptors used are given in Table 1.
Milk (25–30 mL) was served in 200-mL clear acrylic tumblers, each of which was covered with a Petri dish. Before serving to the assessors, the covered milk samples were left for 10 min for the evolution of milk aroma in the head space. All assessments were com-pleted in a purpose-built sensory suite. Assessors were seated in individual booths illuminated by fluorescent tubes with a color temperature approximating northern daylight (5,000–6,000 K). At each session, 4 samples of milk were presented to assessors in an order determined by software installed on the sensory computer system (FIZZ, Biosystèmes, Couternon, France) the basis of which was documented by MacFie et al. (1989). This ensured that assessors received the samples in balanced order to reduce the effect of bias and first-order carry-over effects. Assessors were instructed to remove the Petri dish and note the aroma before tasting the milk samples.
Statistical Analysis
Data were analyzed using Genstat version 9 (2006; Lawes Agricultural Trust, Rothamsted, UK) by
ANO-VA. Treatment effects were separated by polynomial contrasts into linear and quadratic effects (with 0, 34, 66, and 100% red clover silage in the diet). For analy-sis of silage composition data, a blocking structure of experimental period was used. For cow-derived data, a blocking structure of experimental period × (Latin square/cow) was used to control period and between-cow variation. A dendrogram based on DGGE gel data was created using the unweighted pair group method with arithmetic mean. Numbers of DGGE bands for each cow, as reported by the gel image analysis soft-ware, were analyzed by ANOVA as above. Statistical significance was declared if P < 0.05.
reSuLtS
Forage Composition
[image:5.612.33.550.96.305.2]Forage mixture pH and concentrations of ammonia-N, ADF, VFA, and NDF increased as the proportion of red clover silage in the diet increased (Table 2). At the same time, the concentrations of CP, residual water-soluble carbohydrates, and ether extract decreased. The concentrations of soluble phenols were similar for all diets, whereas there was a substantial increase in the concentration of protein-bound phenols as the propor-tion of red clover in the forage mixture increased. Feed fatty acid concentrations differed among treatments (Table 3), particularly for C18 fatty acids, which de-creased as the proportion of red clover silage in the diet increased.
Table 1. Definitions of words used in the descriptive assessment of milk; each assessment was scored on 100-mm line intensity scales where nil = 0 and 100 = extreme1
Term Definition
Aroma (end points nil to extreme)
Cream aroma Intensity of cream aroma Strength of milk odor Intensity of the milk odor Buttery Intensity of fresh buttery odor
Oily Intensity of oily odor
Appearance
Whiteness Appearance of milk from white to cream; endpoints: 0 = white, 100 = cream Texture Appearance of milk from thin to thick; endpoints: 0 = thin, 100 = thick Flavor (end points nil to extreme)
Cream flavor Intensity of cream flavor
Sweet Taste associated with sugar
Sour Taste associated with acids
Plastic Taste associated with plastic Boiled milk Intensity of boiled milk flavor Metallic taste Taste associated with metals Aftertaste
Mouth feel Degree of coating in the mouth after tasting Aftertaste Intensity of aftertaste in the mouth Hedonic
Overall liking Overall liking from poor to good
Feed Intake, BW, and Milk Production
Silage and therefore total DM intake increased lin-early as the proportion of red clover silage in the diet increased (Table 4). Intakes of OM, CP, and NDF also all increased significantly. However, apparent whole-tract digestibilities of DM, OM, and NDF all decreased linearly as the proportion of red clover silage in the diet increased, whereas there was no difference in N ibility among diets. Therefore, only the intake of digest-ible CP significantly differed between treatments in a
linear fashion, although there were quadratic effects of treatment on intakes of digestible DM, OM, NDF, and CP. The latter effects resulted from the highest intakes of digestible components of the 2 grass/red clover mix diets.
There was no effect of dietary treatment on mean BW of the animals, with a grand mean of 636 (standard er-ror of the differences = 4.4) kg over the duration of the experiment. Although the experimental periods were relatively short, there were small but significant effects on BW and BCS change, calculated as the difference Table 2. Mean compositions (% of DM unless otherwise noted) of the forage mixtures fed during the
experiment
Item
Treatment1
R0 R34 R66 R100
DM,2 % 37.5 35.9 33.9 32.2
OM 89.4 89.3 89.4 89.4
CP 20.6 20.5 19.7 19.4
Ammonia-N 0.20 0.23 0.27 0.31
Water-soluble carbohydrates 11.3 7.4 4.9 2.9
NDF 43.9 45.9 44.7 46.1
ADF 29.0 31.7 33.3 37.4
Ether extract 3.6 3.1 2.7 2.4
pH 3.98 4.17 4.41 4.66
Acetic acid 0.89 0.96 1.33 1.72
n-Butyric acid 0.01 0.26 0.51 0.82
Lactic acid 9.0 8.3 7.0 5.1
Protein-bound phenols, mg/g of protein 73 116 151 175 Soluble free phenols, mg/kg of DM 10.9 10.3 10.6 10.5
1Treatments: R0 = 100% grass silage; R34 = 66% grass silage:34% red clover silage; R66 = 34% grass
si-lage:66% red clover silage; R100 = 100% red clover silage; all ratios on a DM basis.
[image:6.612.120.515.98.270.2]2Determined by freeze drying.
Table 3. Major fatty acids in the silage mixtures and concentrate feed as offered to dairy cows (g/kg of DM)
Fatty acid
Treatment1
Concentrate
R0 R34 R66 R100
C12:0 0.058 0.050 0.048 0.036 5.21
C14:0 0.114 0.094 0.098 0.081 1.95
C14:1 cis-9 0.033 0.023 0.028 0.027 0.006
C16:0 3.965 3.607 3.742 3.450 15.6
C16:1 cis-9 0.089 0.077 0.074 0.056 0.138
Phytanic acid 0.136 0.139 0.146 0.146 0.238
C18:0 0.343 0.370 0.471 0.464 1.58
C18:1 cis-9 0.621 0.518 0.524 0.435 15.3
C18:2 n-6 3.71 3.24 3.32 2.96 10.9
C18:3 n-3 11.10 8.54 8.18 6.29 1.02
C20:0 0.088 0.113 0.161 0.166 0.130
Total short-chain fatty acids2 0.107 0.333 0.899 2.390 1.042
Total BOC3 fatty acids 0.254 0.240 0.285 0.266 0.187
Total long-chain fatty acids4 2.26 2.20 2.24 2.24 2.72
Total fatty acids 23.25 19.92 20.71 19.60 58.10
1Treatments: R0 = 100% grass silage; R34 = 66% grass silage:34% red clover silage; R66 = 34% grass silage:66% red clover silage; R100 = 100%
red clover silage; all ratios on a DM basis.
2<C12.
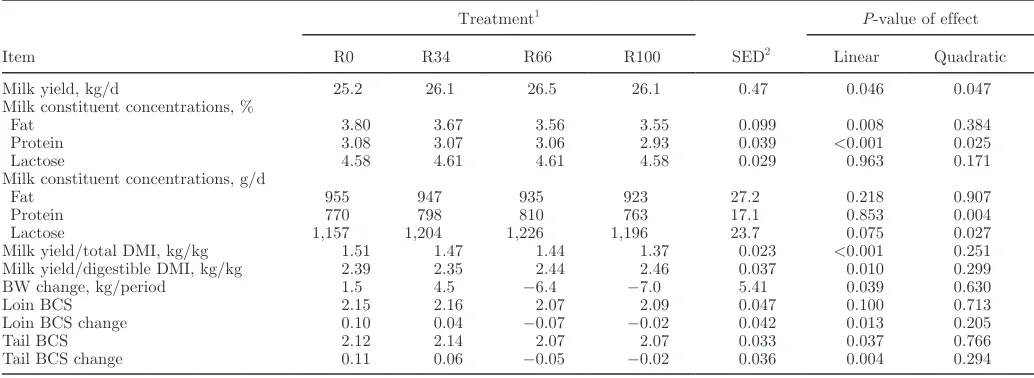
[image:6.612.57.576.492.671.2]between mean BW and BCS at the start and end of each experimental period (Table 5). Small changes in BW resulted in small differences in mean BCS at the end of each experimental period, with cows fed diet R0 gaining small amounts of BW and condition, and cows fed diet R100 losing small amounts of BW and condi-tion (P < 0.05 linear effects on BW and BCS change). Incorporation of red clover silage in the diet sig-nificantly increased milk yields, with both linear and quadratic effects (Table 5). These effects were associ-ated with an increase in total DM intake, although the highest yields of milk were produced by cows on diet R66. The amount of milk produced per kilogram of DM
intake declined linearly as the proportion of red clover silage in the diet increased, although the reverse was true when milk yield per kilogram of digestible DM was considered.
[image:7.612.37.552.98.250.2]Both fat and protein concentrations in milk decreased with an increasing proportion of red clover silage in the diet, with significant linear effects, and a significant quadratic effect on protein concentration as this was lower from animals offered the R100 diet compared with those on diets containing ryegrass silage. The effect of diet on milk fat concentration appears to have been a result of dilution by increased milk yields, because milk fat yield was unaffected by treatment. Similarly, there Table 4. Effect of dietary treatment on feed intakes, measured in all cows, and apparent whole-tract nutrient digestibility and ME density, measured in a subset of cows (n = 8)
Item
Treatment1
SED2
P-value of effect
R0 R34 R66 R100 Linear Quadratic
Feed intake, kg/d
Forage DM 13.2 14.3 14.9 15.5 0.24 <0.001 0.193
Total DM 16.7 17.8 18.3 19.0 0.24 <0.001 0.192
OM 15.0 16.0 16.5 17.1 0.22 <0.001 0.225
CP 3.5 3.7 3.6 3.7 0.05 <0.001 0.095
NDF 6.6 7.3 7.4 7.9 0.11 <0.001 0.100
Nutrient digestibility, %
DM 63.5 62.4 58.9 54.6 0.82 <0.001 0.017
OM 72.8 71.2 68.3 64.1 0.66 <0.001 0.015
N 67.3 68.8 67.0 66.3 1.01 0.143 0.146
NDF 73.2 70.1 68.3 59.7 2.48 <0.001 0.107
ME,3 Mcal/kg of DM 3.17 3.18 3.19 3.19 0.003 <0.001 0.044 1Treatments: R0 = 100% grass silage; R34 = 66% grass silage:34% red clover silage; R66 = 34% grass silage:66% red clover silage; R100 = 100%
red clover silage; all ratios on a DM basis.
2Interaction standard error of the differences of the means.
3Calculated as 3.7 × digestibility of OM expressed as a proportion (g/g) of the DM.
Table 5. Mean effects of altering the forage ratio of grass and red clover silages on milk yields and composition, BW change, and BCS
Item
Treatment1
SED2
P-value of effect
R0 R34 R66 R100 Linear Quadratic
Milk yield, kg/d 25.2 26.1 26.5 26.1 0.47 0.046 0.047
Milk constituent concentrations, %
Fat 3.80 3.67 3.56 3.55 0.099 0.008 0.384
Protein 3.08 3.07 3.06 2.93 0.039 <0.001 0.025
Lactose 4.58 4.61 4.61 4.58 0.029 0.963 0.171
Milk constituent concentrations, g/d
Fat 955 947 935 923 27.2 0.218 0.907
Protein 770 798 810 763 17.1 0.853 0.004
Lactose 1,157 1,204 1,226 1,196 23.7 0.075 0.027
Milk yield/total DMI, kg/kg 1.51 1.47 1.44 1.37 0.023 <0.001 0.251 Milk yield/digestible DMI, kg/kg 2.39 2.35 2.44 2.46 0.037 0.010 0.299
BW change, kg/period 1.5 4.5 −6.4 −7.0 5.41 0.039 0.630
Loin BCS 2.15 2.16 2.07 2.09 0.047 0.100 0.713
Loin BCS change 0.10 0.04 −0.07 −0.02 0.042 0.013 0.205
Tail BCS 2.12 2.14 2.07 2.07 0.033 0.037 0.766
Tail BCS change 0.11 0.06 −0.05 −0.02 0.036 0.004 0.294
1Treatments: R0 = 100% grass silage; R34 = 66% grass silage:34% red clover silage; R66 = 34% grass silage:66% red clover silage; R100 = 100%
red clover silage; all ratios on a DM basis.
[image:7.612.35.552.503.692.2]was a quadratic effect of diet on milk protein yields, with the greatest yields being achieved by animals offered the 2 mixed silage diets. There was no effect of treatment on SCC in milk (grand mean of 145,000 cells/mL).
Milk fatty acid profiles were significantly affected by dietary treatment (Table 6). Short-chain fatty acids (C4 to C10), the saturated fats (C12:0, C14:0, and C16:0), and the monounsaturated C14:1 and C16:1 and the PUFA cis-9 trans-11 conjugated linoleic acid (CLA) all decreased linearly (P < 0.001) with increasing pro-portions of red clover silage in the diet. However, the opposite was true for cis-monounsaturated C18:1, C18 PUFA, C20:0, and total long-chain fatty acids (C20+), which all increased linearly in response to increasing di-etary proportions of red clover silage. Both C18:1 trans and phytanic acid showed quadratic responses, being higher in the mixes, whereas C18:0 was not different across dietary treatments.
Milk Organoleptic Qualities
There were no significant treatment effects on milk aroma, although there were highly significant linear ef-fects of treatment on milk appearance (Table 7). As the proportion of red clover silage in the diet increased, the color (white = 0 to 100 = cream) of the milk became less creamy, as indicated by lower scores, with a differ-ence of 12 points between the 2 extreme diets. Simi-larly, with increasing proportions of red clover silage in the diet, the textural appearance of milk was thinner
as indicated by lower scores. There was little effect of diet on the flavor of the milk produced. There was a significant quadratic effect of diet on the sour flavor characteristic, with milk from cows on the 2 extreme diets scoring higher than milk from cows on the 2 silage diets, although it should be noted that the average sour score for all diets was very low. There was also a small linear effect of treatment on the boiled milk flavor, with an increasing score as the proportion of red clover silage in the diet increased. There were no significant treat-ment differences among milks from the different diets on aftertaste characteristics, or on the overall liking of the milks.
Whole-Body N Partitioning
Output of N in feces and urine, as measured in a subset of the experimental cows, increased linearly as dietary N intake increased (Table 8), so there was no effect on the apparent partitioning of dietary N in feces and urine. There was no treatment effect on output of N in milk or on overall N balance (all animals were in net positive N balance), although the apparent parti-tioning of dietary N into milk decreased significantly in animals fed diet R100.
Output of Purine Derivatives and E. coli and Fecal DGGE Analysis
[image:8.612.67.575.89.286.2]There were no differences among treatments in fe-cal output of E. coli O157 and all E. coli strains, with Table 6. Mean effect of dietary treatment on the fatty acid profiles of milk (g/100 g of total fatty acid)
Fatty acid
Treatment1
SED2
P-value of effect
R0 R34 R66 R100 Linear Quadratic
C12:0 3.67 3.54 3.41 3.11 0.066 <0.001 0.07
C14:0 12.3 12.1 11.9 11.3 0.14 <0.001 0.06
C14:1 cis-9 1.13 1.06 0.97 0.91 0.046 <0.001 0.79
C16:0 38.5 37.9 36.8 36.5 0.43 <0.001 0.71
C16:1 cis-9 1.83 1.77 1.65 1.69 0.047 <0.001 0.12
Phytanic acid 0.39 0.42 0.40 0.39 0.009 0.26 0.03
C18:0 8.88 8.98 9.29 8.74 0.258 0.88 0.08
C18:1 cis3 19.3 19.9 20.8 22.4 0.46 <0.001 0.11
C18:1 trans3 2.24 2.41 2.50 2.28 0.044 0.15 <0.001
C18:1 cis-9 17.7 18.0 18.7 19.9 0.44 <0.001 0.17
CLA4cis-9 trans-11 0.45 0.46 0.44 0.39 0.014 <0.001 0.004
C18:2 n-6 1.00 1.13 1.32 1.63 0.025 <0.001 <0.001
C18:3 n-3 0.56 0.77 1.01 1.49 0.027 <0.001 <0.001
C20:0 0.13 0.14 0.15 0.16 0.003 <0.001 0.17
Short-chain fatty acids 5.76 5.65 5.53 5.34 0.07 <0.001 0.42
Branched- and odd-chain fatty acids 3.66 3.68 3.77 3.95 0.040 <0.001 0.007
Long-chain fatty acids 1.18 1.25 1.30 1.32 0.020 <0.001 0.09
1Treatments: R0 = 100% grass silage; R34 = 66% grass silage:34% red clover silage; R66 = 34% grass silage:66% red clover silage; R100 = 100%
red clover silage; all ratios on a DM basis.
2Interaction standard error of the differences of the means. 3Sum of all isomers.
grand means of 3.36 × 10⁵ and 3.85 × 10⁵ cfu/g of DM, respectively. Urinary excretion of purine derivatives decreased quadratically as the proportion of red clover silage in the diet increased, with the lowest rates of excretion on the 2 mixed diets (Table 8). The urinary excretion of purine derivatives as a ratio of DM intake was significantly lower for all cows offered red clover
in the diet compared with those receiving grass silage only.
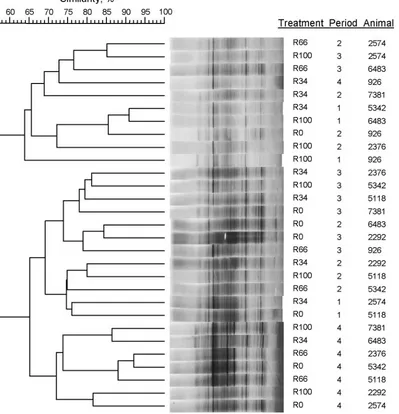
The PCR-DGGE analysis of 16S rRNA genes using primers universal for eubacteria indicated complex communities in fecal samples, with many similarities among cows receiving all dietary treatments (Figure 1). However, there was little dietary effect on the eubacte-Table 7. Effect of altering the forage ratio of grass and red clover silages on taste panel analysis of pasteurized milk
Item
Treatment1
SED2
P-value of effect
R0 R34 R66 R100 Linear Quadratic
Aroma
Creamy 46.8 47.5 47.1 46.5 1.58 0.77 0.57
Strength of milk odor 41.6 44.9 43.6 43.5 2.01 0.50 0.25
Buttery 22.5 22.8 21.4 21.5 1.50 0.38 0.93
Oily 6.6 6.7 7.7 7.3 0.73 0.19 0.61
Appearance
Whiteness 55.8 51.6 48.8 43.8 1.63 <0.001 0.71
Texture 44.2 43.7 40.6 38.3 1.35 <0.001 0.33
Flavor
Cream 54.4 53.3 53.4 52.1 1.80 0.26 0.94
Sweet 36.2 38.6 35.8 35.7 2.00 0.50 0.38
Sour 8.5 6.0 6.7 6.9 0.88 0.15 0.04
Plastic 10.7 10.8 10.1 9.6 1.25 0.32 0.78
Boiled milk 23.9 25.4 26.6 27.4 1.38 0.01 0.69
Metallic 8.8 8.0 9.1 9.5 0.72 0.20 0.24
Aftertaste
Mouthfeel 37.9 39.8 38.9 38.2 1.40 0.99 0.19
Aftertaste 42.5 44.4 43.5 42.6 1.75 0.92 0.28
Hedonic
Overall liking 55.2 54.8 55.1 54.3 1.72 0.66 0.85
1Treatments: R0 = 100% grass silage; R34 = 66% grass silage:34% red clover silage; R66 = 34% grass silage:66% red clover silage; R100 = 100%
red clover silage; all ratios on a DM basis.
[image:9.612.37.551.89.313.2]2Interaction standard error of the differences of the means.
Table 8. Effect of altering the forage ratio of grass and red clover silages on N intakes, N outputs, apparent whole-body partitioning of dietary N, urinary excretion of purine derivatives (PD), and the ratio of PD to DM intake by dairy cows1
Item
Treatment2
SED3
P-value of effect
R0 R34 R66 R100 Linear Quadratic
N intake, g of N/d 529 577 552 611 14.0 <0.001 0.60
N output, g of N/d
Feces 172 181 184 206 6.6 <0.001 0.20
Urine 203 218 232 233 9.0 0.004 0.31
Milk 117 122 119 118 4.8 0.99 0.39
N balance, g/d 36 57 17 55 12.6 0.69 0.35
N partitioning, g out/g in
Feces 0.33 0.31 0.33 0.34 0.010 0.14 0.14
Urine 0.39 0.38 0.42 0.39 0.014 0.39 0.21
Milk 0.22 0.21 0.22 0.19 0.007 0.003 0.30
PD excretion, mM/d
Allantoin 335 320 300 343 18.2 0.35 0.01
Uric acid 44.2 41.4 37.6 42.2 3.18 0.36 0.13
Total PD 400 361 338 385 20.7 0.32 0.01
Total PD/DM intake, mM/kg 25.2 21.2 19.2 20.5 1.35 0.003 0.02
1Measurements were carried out in a subset of the experimental cows (n = 8).
2Treatments: R0 = 100% grass silage; R34 = 66% grass silage:34% red clover silage; R66 = 34% grass silage:66% red clover silage; R100 = 100%
red clover silage; all ratios on a DM basis.
[image:9.612.39.552.502.680.2]rial population in feces among cows, whereas some de-gree of period effect was apparent. For example, 2 main clusters were evident, separating animals regardless of diets with 57% of the band positions being similar. Further cluster analysis separated animals fed in period 4 except for one cow (Figure 1). Analysis of variance of the band numbers generated from the gel was indica-tive of population changes among animals (i.e., affected by dietary treatment) as the band numbers declined from 32 to 25 for R0 to R100, respectively, although it did not reach a statistical significance (P of quadratic effect = 0.09).
DISCuSSIOn
Feed Intake and Milk Production
[image:10.612.122.521.273.687.2]This study confirmed earlier findings of the increased intake potential of red clover silage compared with grass silage (Bertilsson and Murphy, 2003; Dewhurst et al., 2003b; Al-Mabruk et al., 2004) and the increase in milk production that this affords. Even though there was a large difference among treatments in the apparent whole-tract digestibility of the diets consumed, with a linear decrease from grass silage through to red clover silage, feed intakes increased as the proportion of red
clover silage in the diets increased. Differences among treatments in feed intake are likely due to differences in the patterns of particle distribution of grass and red clover silages during rumen fermentation. Smaller particle sizes of forage material in the rumen of red clover silage, both alone and mixed with grass silage (Bertilsson and Murphy, 2003) probably meant that cows fed red clover silage had lower rumen fill rates and therefore greater feed intake capacity (Dewhurst et al., 2003a).
Although milk yields from cows fed red clover silage, either alone or as mixtures with grass silage, were greater than those fed grass silage alone, differences in milk yields among treatments were modest, and the highest yields were obtained from cows consuming the 2 red clover/grass silage mix diets. Previous studies have shown mixed responses to feeding red clover silage alone, with some researchers finding positive responses compared with grass silage (Dewhurst et al., 2003b) and others finding little or no difference (Bertilsson and Murphy, 2003; Vanhatalo et al., 2007). In this study, milk yields from cows fed any of the 3 diets containing red clover silage were greater than those of cows fed grass silage alone, with the highest yields being achieved on the R66 mixed silage diet, and thus a slightly lower yield from cows fed red clover silage alone.
The apparent efficiency of milk production, in terms of kilograms of milk yielded per kilogram of DM con-sumed, was highest for the grass silage only diet, which was probably because of differences in diet digestibility. However, in terms of digestible DM intake the efficiency of milk production was lowest for grass silage alone, and increased as the proportion of red clover silage in the diet increased. This was associated with a concomitant loss of BW and BCS even though whole-body N bal-ance was unaffected by treatment. Mobilization and use of body energy reserves for milk production by cows fed diets containing more red clover silage than grass silage, the reasons for which are not clear, explains why these cows apparently produced more milk per kilogram of digestible DM consumed.
A decrease in milk fat concentrations, as occurred in the current study, has been observed by others (Vanhatalo et al., 2007). An increase in C18 PUFA, C18:1 cis, and total long-chain fatty acids is also as-sociated with red clover silage feeding (Dewhurst et al., 2003b; Al-Mabruk et al., 2004; Vanhatalo et al., 2007). Effects of red clover silage on milk fatty acid profiles have been associated with a reduction in lipolysis and subsequently biohydrogenation in the rumen, either through the actions of the PPO enzyme system (Lee et al., 2007), increased rumen passage rate on red clover diets (Vanhatalo et al., 2007), or a combination of both. The lower proportions of CLA in milk fat with
increas-ing dietary ratios of red clover also indicate a mecha-nism reducing biohydrogenation and the formation of C18:1 trans-11. This biohydrogenation intermediate is converted to CLA in the mammary gland by the en-zyme Δ9-desaturase (EC 1.14.19.1) and represents the primary source of CLA in milk (Griinari et al., 2000). The PPO enzyme system converts free phenol substrate into quinines, which then react with amino acids within proteins forming protein-bound phenol (Igarashi and Yasui, 1985); therefore, a measure of these 2 phenol fractions can indicate the relative activity of the PPO in the crop during ensiling. As expected, the level of protein-bound phenol was higher in silage mixtures with a greater proportion of red clover, indicating PPO protection of the forage proteins and lipids (Lee et al., 2007).
Protein concentrations but not yields were signifi-cantly lower in milk from cows fed the red clover silage, and the reduction, compared with grass silage-fed cows, was greatest for diet R100; diets that contained at least some grass silage maintained protein concentrations. The CP concentration of the grass silage used in this study was relatively high (higher than comparable grass silages produced at the institute for similar studies), whereas the CP concentration of the red clover silage was similar to red clover silages produced previously (Dewhurst et al., 2003b; Merry et al., 2006). The ap-parent efficiency of synthesis of milk protein (g of milk protein produced per g of dietary protein consumed) was greater for cows fed the diets containing grass silage than for those fed the red clover silage alone. This may be due to the ratio of forage water-soluble carbohydrates to N in the silage, leading to increased microbial protein flow out of the rumen; previous stud-ies have shown that mixing red clover and grass silages improves the yield of microbial N at the duodenum in relation to the amount of feed N consumed (Merry et al., 2006). However, although urinary excretion of purine derivatives was greatest from cows fed on grass silage alone, suggesting higher microbial protein flows from the duodenum (Moorby et al., 2006) on this diet, this is unlikely to be the complete explanation because purine derivative excretion from cows offered the 2 mixed diets was lowest.
Milk Organoleptic Qualities
between milks produced from clover and grass silages, with milk from red clover in particular deviating from what was expressed as a “good taste.” In our study, the only significant effect on milk flavor was on the “boiled milk” attribute, with milk produced by red clover-fed cows having the highest score. In terms of appearance, milk from red clover-fed cows was whiter and thinner textured compared with milk from cows fed grass si-lage; the difference in appearance is likely because of differences in β-carotene contents of the 2 silages, which is transferred to milk and alters the color (Martin et al., 2005).
Nitrogen Partitioning
Increased dietary intakes of N as the proportion of red clover silage in the diet increased led to increased outputs of N in feces and urine. There was no differ-ence in the apparent partitioning of dietary N between feces and urine so that, on average, approximately 72% of the feed N consumed was excreted across all treat-ments. In this study, mixing red clover with grass silage had relatively little effect on the efficiency of milk pro-tein production, which was lowest in cows offered red clover silage as the sole forage, agreeing with the data of Dewhurst et al. (2003b). Indeed, as discussed above, the purine derivative excretion data suggest that cows offered red clover silage in the diet probably had a lower flow of microbial protein to the duodenum than cows offered grass silage alone. This may be an effect of the PPO activity in the red clover at ensiling reducing pro-tein degradability in the rumen, leading to lower rates of microbial protein synthesis. The rates of excretion of purine derivatives relative to DM intake were similar for all cows offered red clover in their diets, and were lower compared with cows that received grass silage only, suggesting lower rates of microbial protein flow from the duodenum per unit of DM intake. Conversely, reduced degradability of red clover N in the rumen is likely to have led to increased flows of undegraded feed protein to the duodenum (Merry et al., 2006) so that total protein flow may have been similar. Bertilsson and Murphy (2003) observed substantial differences in allantoin excretion between grass silage-fed cows and red clover silage-fed cows, but only with second-cut red clover silages; it is possible that the PPO activity of the red clover used for the second-cut silage was much higher than that of the clovers in the first cuts, leading to greater rates of protein protection.
Fecal Bacterial Populations
It was hypothesized that feeding red clover silage would alter the fecal bacterial population, as measured
by DGGE and by enumeration of E. coli. Neither meth-od found major differences between dietary treatments, although previous work has shown that large differ-ences in rumen bacterial populations may be expected when feeding ryegrass or red clover silages (Huws et al., 2006). Fecal DGGE profiles are more likely to be influenced by hindgut bacterial populations; a major assumption of the purine derivative technique is that a large proportion of nucleic acids flowing from the abomasum are degraded and absorbed from the small intestine (McAllan, 1980), and would therefore not be present in feces. Therefore, the lack of major treatment effects on fecal DGGE profiles suggests that hindgut fermentation was not significantly affected by the avail-ability of nutrients reaching the large intestine. This in turn suggests that any protection of proteins in red clover silage brought about by PPO activity is likely to have been lost once the digesta reached the duodenum. Although Jacobson et al. (2002) observed differences among various bacterial groups, their work was done principally with dried forages (hays). The reduction in fecal E. coli populations when animals were fed red clover hay was not replicated in this study with red clover silage.
COnCLuSIOnS
Increasing the proportion of red clover silage in the forage component of dairy cow diets increased their DM intakes, milk yields, and the proportion of C18 PUFA in the milk. As milk yields increased, the concentra-tions of milk fat and protein decreased. There was little effect of diet on taste panel characteristics, apart from the physical appearance of the milks. Aroma, flavor, and overall liking of the milk were generally similar from cows on all 4 experimental diets. Based on the results of this study red clover silage offers potential for use as a high-protein forage, which can be grown without the need for fertilizer N inputs, for milk pro-duction from dairy cows. The optimum milk yields were achieved when red clover silage was fed as 66% of the forage component of the diet.
aCKnOWLeDGmentS
reFerenCeS
Agricultural and Food Research Council. 1993. Energy and protein requirements of ruminants. An advisory manual prepared by the AFRC Technical Committee on Responses to Nutrients. CAB International, Wallingford, UK.
Al-Mabruk, R. M., N. F. G. Beck, and R. J. Dewhurst. 2004. Effects of silage species and supplemental vitamin E on the oxidative stability in milk. J. Dairy Sci. 87:406–412.
Bertilsson, J., and M. Murphy. 2003. Effects of feeding clover silages on feed intake, milk production and digestion in dairy cows. Grass Forage Sci. 58:309–322.
British Standards Institution. 1993. Assessors for sensory analysis. Guide to the selection, training and monitoring of selected assessors. BS 7667-1:1993, ISO 8586-1:1993. British Standards Institution, London, UK.
Castle, M. E., and J. N. Watson. 1974. Red clover silage for milk production. J. Br. Grassl. Soc. 29:101–108.
Dewhurst, R. J., R. T. Evans, N. D. Scollan, J. M. Moorby, R. J. Merry, and R. J. Wilkins. 2003a. Comparison of grass and legume silages for milk production. 2. In vivo and in sacco evaluations of rumen function. J. Dairy Sci. 86:2612–2621.
Dewhurst, R. J., W. J. Fisher, J. K. S. Tweed, and R. J. Wilkins. 2003b. Comparison of grass and legume silages for milk production. 1. Production responses with different levels of concentrate. J. Dairy Sci. 86:2598–2611.
Dewhurst, R. J., J. M. Moorby, M. S. Dhanoa, R. T. Evans, and W. J. Fisher. 2000. Effects of altering energy and protein supply to dairy cows during the dry period. 1. Intake, body condition, and milk production. J. Dairy Sci. 83:1782–1794.
Duncan, S. H., H. J. Flint, and C. S. Stewart. 1998. Inhibitory activity of gut bacteria against Escherichia coli O157 mediated by dietary plant metabolites. FEMS Microbiol. Lett. 164:283–288.
Griinari, J. M., B. A. Corl, S. H. Lacy, P. Y. Chouinard, K. V. V. Nurmela, and D. E. Bauman. 2000. Conjugated linoleic acid is synthesized endogenously in lactating dairy cows by Δ9-desaturase.
J. Nutr. 130:2285–2291.
Hedegaard, R. V., D. Kristensen, J. H. Nielsen, M. B. Frost, H. Ostdal, J. E. Hermansen, M. Kroger-Ohlsen, and L. H. Skibsted. 2006. Comparison of descriptive sensory analysis and chemical analysis for oxidative changes in milk. J. Dairy Sci. 89:495–504.
Huws, S. A., J. E. Edwards, E. J. Kim, and N. D. Scollan. 2007. Specificity and sensitivity of eubacterial primers utilized for molecular profiling of bacteria within complex microbial ecosystems. J. Microbiol. Methods 70:565–569.
Huws, S. A., M. R. F. Lee, S. Muetzel, and R. J. Wallace. 2006. Effect of forage type and level of fish oil inclusion on bacterial diversity in the rumen. Reprod. Nutr. Dev. 46(Suppl. 1):S99.
Igarashi, K., and T. Yasui. 1985. Oxidation of free methionine and methionine residues in protein involved in the browning reaction of phenolic compounds. Agric. Biol. Chem. 49:2309–2315.
Jacobson, L. H., T. A. Nagle, N. G. Gregory, R. G. Bell, G. Le Roux, and J. M. Haines. 2002. Effect of feeding pasture-finished cattle different conserved forages on Escherichia coli in the rumen and faeces. Meat Sci. 62:93–106.
Lafond, J., and D. Pageau. 2007. Nitrogen and non nitrogen benefit of legumes to a subsequent spring barley crop. Can. J. Soil Sci. 87:445–454.
Lee, M. R. F., L. J. Parfitt, N. D. Scollan, and F. R. Minchin. 2007. Lipolysis in red clover with different polyphenol oxidase activities in the presence and absence of rumen fluid. J. Sci. Food Agric. 87:1308–1314.
Lee, M. R. F., K. J. Shingfield, J. K. S. Tweed, V. Toivonen, S. A. Huws, and N. D. Scollan. 2008. Effect of fish oil on rumen biohydrogenation of C18 unsaturated fatty acids in steers fed grass or red clover silages. Animal 2:1859–1869.
Lee, M. R. F., and J. K. S. Tweed. 2008. Isomerisation of cis-9 trans-11 conjugated linoleic acid (CLA) to trans-9 trans-11 CLA during acidic methylation can be avoided by a rapid base catalysed methylation of milk fat. J. Dairy Res. 75:354–356.
Lee, M. R. F., J. K. S. Tweed, A. P. Moloney, and N. D. Scollan. 2005. The effects of fish oil supplementation on rumen metabolism and the biohydrogenation of unsaturated fatty acids in beef steers given diets containing sunflower oil. Anim. Sci. 80:361–367. MacFie, H. J., N. Bratchell, K. Greenhoff, and L. Vallis. 1989. Designs
to balance the effect of order of presentation and first-order carry-over effects in hall tests. J. Sens. Stud. 4:129–148.
Martin, B., I. Verdier-Metz, S. Buchin, C. Hurtaud, and J. B. Coulon. 2005. How do the nature of forages and pasture diversity influence the sensory quality of dairy livestock products? Anim. Sci. 81:205–212.
McAllan, A. B. 1980. The degradation of nucleic acid in, and the removal of breakdown products from the small intestine of steers. Br. J. Nutr. 44:99–112.
Merry, R. J., M. R. F. Lee, D. R. Davies, R. J. Dewhurst, J. M. Moorby, N. D. Scollan, and M. K. Theodorou. 2006. Effects of high-sugar ryegrass silage and mixtures with red clover silage on ruminant digestion. 1. In vitro and in vivo studies of nitrogen utilization. J. Anim. Sci. 84:3049–3060.
Moorby, J. M., R. J. Dewhurst, R. T. Evans, and J. L. Danelon. 2006. Effects of dairy cow diet forage proportion on duodenal nutrient supply and urinary purine derivative excretion. J. Dairy Sci. 89:3552–3562.
Moorby, J. M., R. J. Dewhurst, J. K. S. Tweed, M. S. Dhanoa, and N. F. G. Beck. 2000. Effects of altering the energy and protein supply to dairy cows during the dry period. 2. Metabolic and hormonal responses. J. Dairy Sci. 83:1795–1805.
Mulvany, P. 1977. Dairy cow condition scoring. National Institute for Research in Dairying, Reading, UK.
Sanguinetti, C. J., E. D. Neto, and A. J. G. Simpson. 1994. Rapid silver staining and recovery of PCR products separated on polyacrylamide gels. Biotechniques 17:914–921.
Thomas, C., K. Aston, and S. R. Daley. 1985. Milk production from silage. 3. A comparison of red clover with grass silage. Anim. Prod. 41:23–31.
Thomas, T. A. 1977. An automated procedure for the determination of soluble carbohydrates in herbage. J. Sci. Food Agric. 28:639– 642.
Van Soest, P. J., J. B. Robertson, and B. A. Lewis. 1991. Methods for dietary fiber, neutral detergent fiber, and nonstarch polysaccharides in relation to animal nutrition. J. Dairy Sci. 74:3568–3597. Van Soest, P. J., and R. H. Wine. 1967. Use of detergent in the analysis
of fibrous feeds. IV. Determination of plant cell wall constituents. J. AOAC 50:50–55.
Vanhatalo, A., K. Kuoppala, V. Toivonen, and K. J. Shingfield. 2007. Effects of forage species and stage of maturity on bovine milk fatty acid composition. Eur. J. Lipid Sci. Technol. 109:856–867. Veltman, R. H., C. Larrigaudiere, H. J. Wichers, A. C. R. Van Schaik,
L. H. W. Van der Plas, and J. Oosterhaven. 1999. PPO activity and polyphenol content are not limiting factors during brown cove development in pears (Pyrus communis L. cv. Conference). J. Plant Physiol. 154:697–702.
Wells, J. G., L. D. Shipman, K. D. Greene, E. G. Sowers, J. H. Green, D. N. Cameron, F. P. Downes, M. L. Martin, P. M. Griffin, S. M. Ostroff, M. E. Potter, R. V. Tauxe, and I. K. Wachsmuth. 1991. Isolation of Escherichia coli serotype O157:H7 and other shiga-like-toxin-producing E. coli from dairy cattle. J. Clin. Microbiol. 29:985–989.
Wilkins, R. J., and R. Jones. 2000. Alternative home-grown protein sources for ruminants in the United Kingdom. Anim. Feed Sci. Technol. 85:23–32.
Winters, A. L., and F. R. Minchin. 2005. Modification of the Lowry assay to measure proteins and phenols in covalently bound complexes. Anal. Biochem. 346:43–48.
Zhao, T., M. P. Doyle, J. Shere, and L. Garber. 1995. Prevalence of enterohemorrhagic Escherichia coli O157 H7 in a survey of dairy herds. Appl. Environ. Microbiol. 61:1290–1293.