Soil Quality
Test Kit Guide
United StatesTrade names are used solely to provide specific information. Mention of a trade name does not consti-tute a guarantee of the product by the U.S. Department of Agriculture nor does it imply endorsement by the Department or the Natural Resources Conservation Service over comparable products that are not named.
The U.S. Department of Agriculture (USDA) prohibits discrimination in all its programs and activities on the basis of race, color, national origin, gender, religion, age, disability, political beliefs, sexual orienta-tion, or marital or family status. (Not all prohibited bases apply to all programs.) Persons with disabili-ties who require alternative means for communication of program information (Braille, large print, audiotape, etc.) should contact USDA’s TARGET Center at (202) 720-2600 (voice and TDD).
Table of Contents
Preface ...
Section I - Test Procedures:
1. Measuring Soil Quality- discusses sampling and site
characterization ...
2. Soil Respiration Test - indicates the soil's biological
activity...
3. Infiltration Test - measures the soil's ability
to take in water through the soil surface ...
4. Bulk Density Test - measures the soil's compaction
or pore space...
5. Electrical Conductivity (EC) Test - measures the salt
concentration in the soil...
6. pH Test - measures the soil's acidity or alkalinity...
7. Soil Nitrate Test - measures the soil's
nitrate levels ...
8. Aggregate Stability Test - measures the amount of
water stable aggregates...
9. Slake Test - estimates the stability of soil
fragments in water ...
10. Earthworm Test - measures the number of earthworms
in the soil ... 11. Soil Physical Observations and Estimations - shows how
to observe soil structure and root patterns and how to estimate topsoil
depth, penetration resistance, and soil texture in the soil profile... 12. Water Quality Tests estimates salinity and
nitrate/nitrite levels in water...
Page
iii
1
4
7
9
14 15
16
18
20
22
23
28
Appendix:
A. References... B. Soil Respiration (alternative method)... C. EC and pH Meter Maintenance and Calibration... D. Building a Soil Quality Test Kit ... E. Site Description Data Sheet... F. Soil Quality Data Worksheets...
Section II - Background & Interpretive Guide for Individual Tests
:
Introduction ... 1. Soil Respiration ... 2. Infiltration ... 3. Bulk Density ... 4. Electrical Conductivity (EC) ... 5. Soil pH ... 6. Soil Nitrate ... 7. Aggregate Stability ... 8. Soil Slaking ... 9. Earthworms... 10. Soil Physical Observations and Estimations ... 11. Water Quality ...
Salinity of water
Nitrate/nitrite levels in water
ii
Page
30 31 33 35 41 43
51
52
55
57
59
63
67
69
72
73
75
PREFACE
Soil quality is simply defined as “the capacity of a specific kind of soil to function.” It is gener-ally assessed by measuring a minimum data set of soil properties to evaluate the soil’s ability to perform basic functions (i.e., maintaining productivity, regulating and partitioning of water and solute flow, filtering and buffering against pollutants, and storing and cycling nutrients). This guide describes a kit of selected field procedures to evaluate or indicate the level of one or more soil functions.
When measuring soil quality, it is important to evaluate the physical, chemical, and biological properties of the soil. Physical properties addressed by the kit include bulk density, water content, infiltration rate, aggregate stability, slaking, and morphological estimations. Biological properties measured include soil respiration and earthworms. Soil chemical properties measured include pH, electrical conductivity (EC), and soil nitrate levels. The chemical tests are also useful to evaluate water quality of well-water, tile drainage waters, and other water bodies related to farm activities.
Section I of this guide provides a list of supplies and instructions for conducting a number of on-farm tests to assess soil quality. Section II provides background and interpretive information for each test described in Section I. These tests, or indicators, are designed as a screening tool to pro-vide immediate results for comparing management systems, monitoring changes in soil quality over time, and for diagnosing possible soil health problems due to land use and management.
These tests can be easily conducted on the farm by NRCS field personnel or by landowners themselves to assess the quality of their soil. Use of the kit allows NRCS staff to be an active par-ticipant with the landowner in the assessment of soil health. The assessment will provide the oppor-tunity to discuss management options when the need arises.
The kit was developed by John Doran and associates, Agricultural Research Service, Lincoln, NE. The Soil Quality Institute has continued the development, enhancement and testing of the kit (with NRCS field staff) by adding tests, modifying the manual, and writing an interpretations guide. The NRCS Soil Quality Team in Akron, CO (Manuel Rosales, Josh Saunders, and Mike Sucik) were instrumental in the field testing of the test kit and this guide. The Soil Quality Test Kit Guide is a dynamic document. The Institute welcomes suggestions for additional tests and interpretive infor-mation to incorporate in future versions of the guide.
The Institute gratefully acknowledges the contributions of the following individuals: John Doran, USDA-ARS, Lincoln, NE, for the development of the original soil quality test kit from which this guide is based. Bob Grossman, USDA-NRCS, NSSC, Lincoln, NE, for the development of the soil structure index and penetration resistance tests. Jeff Herrick, USDA-ARS, Las Cruces, NM, for the development of the soil slake test procedure and aggregate stability test design. Dennis Linden, USDA-ARS, St. Paul, MN, for the development of the earthworm procedure. Bob Hanafin, Auburn University, for the development of the design and layout of this guide. Cathy Seybold and Lee Norfleet, USDA-NRCS, Soil Quality Institute, for the development of this guide and testing of kit procedures.
The mission of the Soil Quality Institute is to cooperate with partners in the development, acqui-sition, and dissemination of soil quality information and technology to help people conserve and sustain our natural resources and the environment.
For more information about the Soil Quality Institute and its products and services, visit our website at http://www.statlab.iastate.edu/survey/SQI/.
1. Measuring Soil Quality
Soil quality integrates the physical, chemical, and biological components of soil and their interac-tions. Therefore, to capture the holistic nature of soil quality or health, all of the parameters in the kit should be measured. However, not all parameters have equal relevance to all soils and situa-tions. For example, the EC test for salinity may not be useful in the eastern part of the U.S. where salinity is not a problem. A minimum data set of soil properties, or indicators, from each of the three soil components are selected based on their ability to indicate the capacity of the soil to function for a specific land use, climate, and soil type. Indicators in the soil quality kit are selected primarily for agricultural soil quality assessments. The kit should be used as a screening tool to give the general trend or direction of soil quality--whether current management systems are main-taining, enhancing, or degrading the soil. Proper use of the kit and interpretation of results depends on how well the indicators are understood with respect to the land use and environmental goals.
There are two fundamental ways to assess soil quality:
take measurements periodically over time to monitor changes or trends in soil quality; compare measured values to a standard or reference soil condition.
By making use of the two ways of assessing soil quality, the kit can be used to:
make side-by-side comparisons of different soil management systems to determine their relative effects on soil quality;
take measurements on the same field over time to monitor trends in soil quality as affected by soil use and management;
compare problem areas in a field to the non-problem areas;
compare measured values to a reference soil condition or to the natural ecosystem.
Field or Site Characterization
It is important to gain as much information about the area and soils as possible. Indicators of soil quality must be evaluated within the context of site and climatic characteristics. A "Soil Quality Site Description" recording sheet, located in the appendix, should be completed during the soil quality assessment. The following are items that should be considered when making an on-farm soil quality assessment:
Soil series - The soil series name can be found in the county soil survey.
Signs of erosion - Signs of erosion include gullies, rills, development of pedestals, exposed areas of subsoil, damage to plants caused by wind blown materials, etc.
Management history - This item includes a description of past and present land and crop management; kind, amount, and method of fertilization; prior tillage; and land leveling.
Slope and topographical features of the field - Record percent slope at the sampling sites within the field, and note any hills, knolls, ridges, potholes, depressions, etc.
Location of the field and sampling areas - Record longitude and latitude (if GPS unit is available), a description of the location (feet from landmarks), and a drawing of the field showing sampling areas.
tempera-Sampling Guidelines
Important: When, where, and how deep to sample and how many samples to take is primarily dependent on the questions being asked or problems being addressed by the farm or land manager.
When to sample?
Timing of sampling is important, because soil properties vary within a season and with manage-ment operations, such as tillage. In general, for the overall assessmanage-ment of soil quality, an annual sampling of the field is recommended. Sampling once a year will allow for the detection of long-term changes in soil quality. A good time of year to sample is when the climate is most stable and there have been no recent disturbances, such as after harvest or the end of the growing season.
Where to sample?
An important consideration in determining where to sample in a field is the variability of the area. Soil properties naturally vary across a field and even within the same soil type. Soil variability across a field is also affected by management operations. General field characteristics to consider are:
row versus inter-row areas, differences in soil type, differences in management,
wheel versus non-wheel tracked areas, differences in crop growth,
salt affected versus non-salt affected areas,
eroded versus non-eroded areas, differences in slope, and
wet versus non-wet areas (drainage).
Some general guidelines on selecting sam-pling sites are as follows:
(1) For a general assessment of soil quality, select sample sites within a field that are representative of the field. Refer to soil maps of the area (Soil Survey) to identify soil type differences and varia-tions within the map unit
Figure 1.1
tures for each month (data from a county or watershed level will often be sufficient).
(Figure 1.1). A hand auger can be used to make a number of borings to estab-lish locations of the most representative areas of the field.
(2) For assessment of trouble spots within a field, sample areas that are representa-tive of the trouble spots (Figure 1.2).
(3) When comparing management systems, make sure sites selected for comparison have the same soil type and are located on the same topographical features in both fields. For example, if sites are measured in the wheel tracks in one
field, wheel tracks sites should be selected in the comparison field.
(4) When monitoring changes in soil quality over time, make sure the same sites within the field are measured at each sampling time. Also, try to take measurements at the same soil moisture conditions at each sampling time to reduce variability.
In some cases it might be helpful to compare sampling points if the field is sampled at different points across gradients of soil type, soil moisture, slope, or other factors rather than just at a fixed point (Figure 1.3).
How many samples?
The number of samples or measurements to take will depend on the variability of the field.
It is recommended that a minimum of three samples or measurements be collected on any one soil type and management combination. In general, the greater the variability of the field, the greater the number of measurements are needed to get a representative value at the field scale. When measuring EC, pH, and soil nitrates at the field scale, eight or nine sample cores from across the field could be bulked and mixed, and two subsamples from the mixed cores could be analyzed. When taking cores from across the field, stay away from areas that are distinctly different and are not representative of the field, such as farm lanes and field borders, fertilizer bands, areas within 150 feet of a gravel road, potholes, eroded spots, etc.
Figure 1.2
Figure 1.3
Sampling points Soil type gradient
Soil types
2. Soil Respiration Test
For efficient sampling, the soil respiration test is performed first, followed by the infiltration test (Chapter 3) without removing the 6-inch diameter ring. The best time to run the soil respiration test is when soil moisture is at field capacity (the amount of water the soil can hold after drainage). Otherwise, soil respiration should be measured before and after the infiltration measurement or soil wetting (6 to 24 hours after wetting).
Materials needed to measure respiration:
6-inch diameter ring
lid with rubber stoppers
hand sledge and wood block
soil thermometer
two sections of plastic tubing
2 needles
Draeger tubes
140 cc syringe
stopwatch or timer
Considerations:
Microbial activity is greatest when the soil is moist (at or near field capacity). If the soil is dry, a second respiration measurement should be made at a minimum of six hours (preferably 16 to 24 hours later) after the infiltration test or wetting of the soil. If the soil is saturated, soil respiration is inhibited, and this test should not be run.Drive Ring into Soil
Clear the sampling area of surface residue, etc. If the site is covered with vegetation, trim it as close to the soil surface as possible.
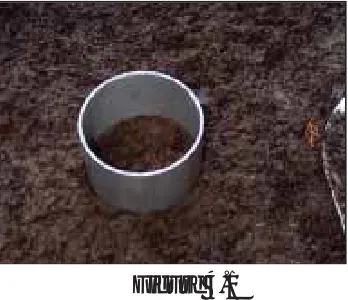
Using the hand sledge and block of wood, drive the 6-inch diameter ring, beveled edge down, to a depth of three inches (line marked on outside of ring) Figure 2.1.
If the soil contains rock fragments, and the ring can not be inserted to depth, gently push the ring into the soil until it hits a rock fragment. Measure the height from the soil surface to the top of the ring in centimeters (cm). [See note below]
NOTE: For a more accurate measurement of soil respiration, the chamber head-space should be measured. Inside the ring, take four measurements (evenly spaced) of the height from the soil surface to the top of the ring, and calculate the average. Record average on the Soil Data worksheet.
1
Figure 2.1
Did You Know?
Cover Ring with Lid and Wait
Cover the ring with the lid as depicted in
Figure 2.2 and note the time.
Wait exactly 30 minutes* (to allow CO2 to accumulate in the chamber).
[If this is the SECOND respiration measurement, briefly remove the lid and replace it before timing to allow the release of gases that have built up
over the 6-24 hour waiting period. Proceed with Step 3.]
*NOTE: During the 30-minute wait, other tests such as Bulk Density (Chapter 4) can be run.
Insert Soil Thermometer
Insert the soil thermometer into the soil adjacent to the ring with lid (about one inch away from ring and one inch deep). If the thermometer can easily be inserted into the rubber stoppers, insert it into one of them to a 1-inch depth into the soil.
Assemble Draeger Tube Apparatus
Assemble the Draeger tube apparatus just before the end of the 30-minute wait.
Connect a needle to one of the sections of tubing.
Break open bothends of a CO2 Draeger tube, either by using the hole at the end of the syringe handle as depicted in Figure 2.3, or by clipping the tube ends with a finger nail clipper.
Connect the Draeger tube to the otherend of the needle’s tubing.The arrow on the side of the Draeger tube should point away from the needle.
With the second piece of tubing, connect the Draeger tube to the syringe as shown in Figure 2.4
4
Figure 2.2
3
2
[image:11.612.374.559.54.188.2]Insert Apparatus Needle into Stopper
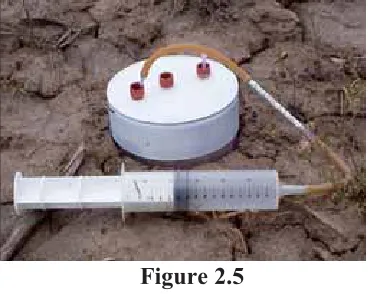
After 30 minutes, insert the Draeger tube apparatus needle into a stopper as shown in Figure 2.5. Insert a second needle into one of the other stoppers on the lid to allow air flow into the head space during the gas sampling. The second needle should be inserted just before the head space is sampled.
Draw Head Space Sample
Over a 15-second span, draw the syringe handle back to the 100 cc reading (1 cc = 1 mL) as shown in Figure 2.5. [If the reading is less than 0.5%, take four additional 100 cc samples of the head space through the same Draeger tube. To do this, disconnect the tube from the syringe to remove the air, and reconnect the tube to the syringe. Take another 100 cc sample. Repeat.]
Record Soil Temperature and % CO2
[image:12.612.357.541.54.201.2]On the Soil Data worksheet, record the temperature in Celsius at the time of sampling. On the Draeger tube, read the "n=1" column if 100 cc was sampled or the "n=5" column if 500 cc was sampled. The % CO2 reading should be an estimate of the highest point that the purple color can be easily detected. Enter this reading on the Soil Data worksheet. In the example in Figure 2.6, the reading would be approximately 0.75%.
Remove Lid
Remove the thermometer, Draeger apparatus needle, air flow needle, and the lid from the ring.
If this is the first respiration measurement, leave the ring in the soil for the infiltration measurement (Chapter 3).
7
8
CALCULATIONS:
Soil Respiration (lb CO2-C/acre/day) = PF x TF x (%CO2 - 0.035) x 22.91 x H
PF = pressure factor = 1
TF = temperature factor = (soil temperature in Celsius + 273) ÷ 273 H = inside height of ring = 5.08 cm (2 inches)
5
6
Figure 2.5Figure 2.6
3. Infiltration Test
The infiltration test is generally performed after the firstrespiration measurement. The same 6-inch diameter ring left in place from the soil respiration test can be used for the infiltration test. If soil respiration was not determined, follow the instructions in Step 1 of the soil respiration proce-dure (Chapter 2) for inserting the 6-inch diameter ring.
Materials needed to measure infiltration:
6-inch diameter ring (left in soil from respiration test)
plastic wrap
500 mL plastic bottle or graduated cylinder
distilled water
stopwatch or timer
Considerations: If the soil is saturated, infiltration will not occur. Wait for one or two days to allow for some drying. Also, if the respiration test is not performed, make sure the sampling area is free of residue and weeds or that vegetation is trimmed to the soil surface before inserting the ring.
Firm Soil
With the 6-inch diameter ring in place, use your finger to gently firm the soil surface only
around the inside edges of the ring to prevent extra seepage. Minimize disturbance to the rest of the soil surface inside the ring.
Line Ring with Plastic Wrap
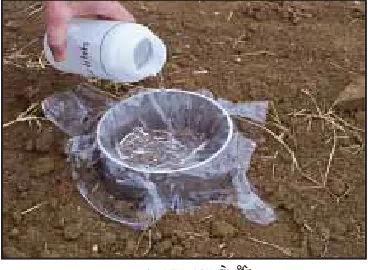
Line the soil surface inside the ring with a sheet of plastic wrap to completely cover the soil and ring as shown in Figure 3.1. This procedure prevents disturbance to the soil surface when adding water.
[image:13.612.374.558.513.648.2]Add Water
• Fill the plastic bottle or graduated cylinder to the 444 mL mark with distilled water.
Pour the 444 mL of water (1" of water) into the ring lined with plastic wrap as shown in Figure 3.1.
2
3
1
Did You Know?
Infiltration rate is a measure of how fast water enters the soil. Water entering too slowly may lead to ponding on level fields or to erosion from surface runoff on sloping fields.
Remove Wrap and Record Time
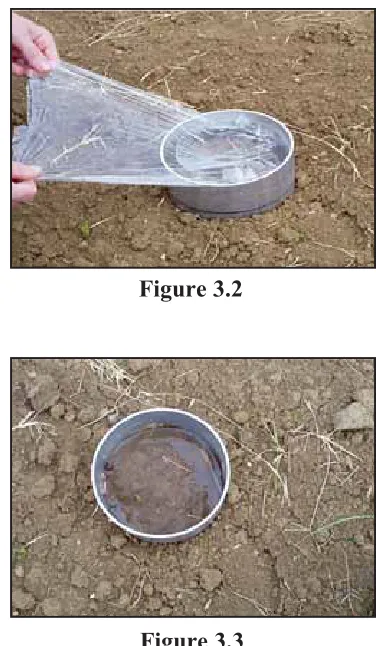
Remove the plastic wrap by gently pulling it out, leaving the water in the ring (Figure 3.2). Note the time.
Record the amount of time (in minutes) it takes for the 1" of water to infiltrate the soil. Stop timing when the surface is just glistening.
If the soil surface is uneven inside the ring, count the time until half of the surface is ex-posed and just glistening (Figure 3.3).
Enter the amount of time in minutes on the Soil Data worksheet.
Repeat Infiltration Test
In the same ring, perform Steps 2, 3, & 4 with a second inch of water. On the Soil Data worksheet, enter the number of minutes elapsed for the second infiltration measurement. If soil moisture is at or near field capacity, the second test is not necessary.
[The moisture content of the soil will affect the rate of infiltration; therefore, two infiltration tests are usually performed (if soil is dry). The first inch of water wets the soil, and the second inch gives a better estimate of the infiltration rate of the soil.]
Replace Lid
If a second respiration measurement will be performed, set the lid loosely on the ring and leave it covered for preferably 16 to 24 hours (6-hour minimum) before beginning the second test (Chapter 2). (Remove lid and replace it before beginning the second soil respi-ration measurement).
Reminder: If you still need to perform the second respiration measurement, remember to loosely place the lid back on the ring before leaving the field.
!
4
5
Figure 3.2
Figure 3.3
[image:14.612.352.540.50.373.2]4. Bulk Density Test
The bulk density measurement should be performed at the soil surface and/or in a compacted zone (plow pan, etc.) if one is present . Measure bulk density near (between 1 and 2 feet) the site of the respiration and infiltration tests. To get a more representative bulk density measurement of the area, additional samples may be taken.
Materials needed to measure bulk density:
3-inch diameter ring
hand sledge
wood block
garden trowel
flat-bladed knife
sealable bags and marker pen
scale (0.1 g precision)
1/8 cup (30 mL) measuring scoop
paper cups
18-inch metal rod
access to a microwave oven
Considerations:
For rocky or gravelly soils, use the alternate procedure on page 11.Drive Ring into Soil
• Using the hand sledge and block of wood, drive the 3-inch diameter ring, beveled edge down, to a depth of 3 inches (Figure 4.1).
[image:15.612.384.558.440.590.2]• The exact depth of the ring must be determined for accurate measurement of soil volume. To do this, the height of the ring above the soil should be measured. Take four measurements (evenly spaced) of the height from the soil surface to the top of the ring and calculate the average. Record the average on the Soil Data worksheet.
NOTE: Use the metal rod to probe the soil for depth to a compacted zone. If one is found, dig down to the top of this zone and make a level surface. Proceed with Step 1.
Remove 3-inch Ring
Dig around the ring and with the trowel underneath it, carefully lift it out to prevent any loss of soil.
Did You Know?
Bulk density is the weight of soil for a given vol-ume. It is used to mea-sure compaction. In general, the greater the density, the less pore space for water move-ment, root growth and penetration, and seedling germination.
1
2
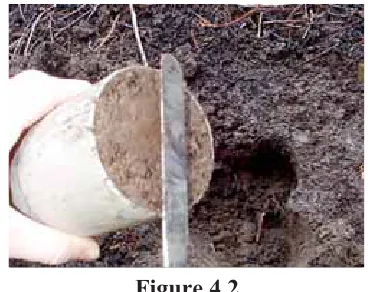
Remove Excess Soil
Remove excess soil from the sample with a flat-bladed knife. The bottom of the sample should be flat and even with the edges of the ring (see Figure 4.2).
Place Sample in Bag and Label
Touch the sample as little as possible. Using the flat-bladed knife, push out the sample into a plastic
sealable bag. Make sure the entire sample is placed in the plastic bag. Seal and label the bag.
NOTE: Steps 5-7 can be done in a lab or office if a scale is not available in the field. Step 8 requires access to a microwave.
Weigh and Record Sample
• Weigh the soil sample in its bag. [If the sample is too heavy for the scale, transfer about half of the sample to another plastic bag. The weights of the two sample bags will need to be added together. Enter the weight (sum of two bags, if applicable) on the Soil Data worksheet.
• Weigh an empty plastic bag to account for the weight of the bag. Enter the weight (sum of two bags, if applicable) on the Soil Data worksheet.
Extract Subsample to Determine Water Content and Dry Soil Weight
• Mix sample thoroughly in the bag by kneading it with your fingers.
• Take a 1/8-cup level scoop subsample of loose soil (not packed down) from the plastic bag and place it in a paper cup (a glass or ceramic cup may be used).
Weigh and Record Subsample
Weigh the soil subsample in its paper cup. Enter the weight on the Soil Data worksheet. Weigh an empty paper cup to account for its weight. Enter the weight on the Soil Data
worksheet.
Dry Subsample
Place the paper cup containing the subsample in a microwave and dry for two or more four-minute cycles at full power. Open the microwave door for one four-minute between cycles to allow venting. Weigh the dry subsample in its paper cup and enter the weight on the Soil Data worksheet.
5
6
7
8
4
3 [image:16.612.359.543.52.198.2]Bulk Density Test for Gravelly and Rocky Soils
This method is to be used when rocks or gravels prevent sampling bulk density by the core method described in the first part of this Chapter. This excavation method will require the user to sieve out the coarse material greater than 2 mm in size.
Materials needed to measure bulk density:
Plastic wrap
140-cc syringe
water
garden trowel
sealable bags and marker pen
2-mm sieve
scale (0.1 g precision)
1/8-cup (30 mL) measuring scoop
paper cup or bowl
access to a microwave oven
Considerations:
Choose a spot that is as level as possible to allow water to fill the hole evenly. If the soil is too wet to sieve, ignore the part in Step 2 about replacing rocks, and proceed to Step 3. Soil will have to be dried and sieved later. The volume of gravel will need to be determined and subtracted from the total volume of the soil sample taken in the field.Dig Hole
• Dig a bowl shaped hole three inches deep and approximately five inches in diameter using the trowel (Figure 4.3). Avoid compacting the soil in the hole while digging. Place all of the soil and gravel removed from the hole in a plastic bag.
• Using the 2-mm sieve, sieve the soil in the plastic bag to separate the gravel. Collect the soil in a plastic sealable bag. Put the gravel aside to be used in Step 2. Seal and label the plastic bag.
[Note: See Considerations above if soil is wet.] 1
NOTE: To determine if the soil is dry, weigh the sample and record its weight after each 4-minute cycle. When its weight does not change after a drying cycle, then it is dry.
CALCULATIONS (See page 13)
[image:17.612.382.560.532.680.2]Line the Hole
Line the hole with plastic wrap as shown in Figure 4.4. Leave some excess plastic wrap around the edge of the hole. Place the sieved rocks and gravel care-fully in the center of the hole on top of the plastic wrap. Assure that the pile of rocks do not protrude above the level of the soil surface.
Add Water to Hole
• Use the 140 cc syringe to keep track of how much water is needed to fill the lined hole. The level of the water should be even with the soil surface.
• The amount of water represents the volume of soil removed. Record the total amount of water in cubic centimeters (1 cc = 1 cm3) on the Soil Data worksheet.
NOTE: Steps 4-6 can be done in a lab or office if a scale is not available in the field. Step 7 requires access to a microwave.
Weigh and Record Sample
• Weigh the soil sample in its bag. [If the sample is too heavy for the scale, transfer about half of the sample to another plastic bag. The weights of the two sample bags will need to be added together. Enter the weight (sum of two bags, if applicable) on the Soil Data worksheet.
• Weigh an empty plastic bag to account for the weight of the bag. Enter the weight (sum of two bags, if applicable) on the Soil Data worksheet.
Extract Subsample to Determine Water Content and Dry Soil Weight
• Mix sample thoroughly in the bag by kneading it with your fingers.
• Take a 1/8-cup level scoop subsample of loose soil (not packed down) from the plastic bag and place it in a paper cup (a glass or ceramic cup may be used).
Weigh and Record Subsample
Weigh the soil subsample in its paper cup. Enter the weight on the Soil Data worksheet. Weigh an empty paper cup to account for its weight. Enter the weight on the Soil Data
worksheet.
4
5
6 3 2
CALCULATIONS (for both bulk density methods):
Soil water content (g/g) = (weight of moist soil - weight of oven dry soil) weight of oven dry soil
Soil bulk density (g/cm3) = oven dry weight of soil volume of soil
Soil water-filled pore space (%) = volumetric water content x 100 soil porosity
Volumetric water content (g/cm3) = soil water content (g/g) x bulk density (g/cm3)
Soil porosity (%) = 1 - soil bulk density 2.65
Volume of Rocks (cm3) = Fill 1/3 of a graduated cylinder with water, and record the amount. Add the rocks to the cylinder and record the change in the water level. The difference is the volume of rocks (1 mL = 1 cm3).
Volume of Soil (cm3) = Total soil volume - volume of rocks
)
(
Dry Subsample
Place the paper cup containing the subsample in a microwave and dry for two or more four-minute cycles at full power. Open the microwave door for one four-minute between cycles to allow venting. Weigh the dry subsample in its paper cup and enter the weight on the Soil Data worksheet.
NOTE: To determine if the soil is dry, weigh the sample and record its weight after each 4-minute cycle. When its weight does not change after a drying cycle, then it is dry.
5. Electrical Conductivity Test
Soil samples for the electrical conductivity (EC) test are taken from the 0- to 3-inch depth. Bulked soil samples from across the field can be collected, and two subsamples can be taken for analysis (See Chapter 1, Sampling Guidelines). Electrical conductivity, pH, and soil nitrate are all measured from the same soil subsample.
Materials needed to measure electrical conductivity (EC):
1/8-cup (30 mL) measuring scoop
120-mL plastic containers with lid
EC pocket meter (blue with black cap)
squirt bottle
calibration solution (0.01 M KCl)
distilled water
Extract Subsample
The soil sample should be thoroughly mixed before taking a subsample. Measure a 1/8-cup level scoop subsample of soil and place it in the plastic container. If soil nitrates will be measured on this subsample (Chapter 7), weigh the subsample for a more accurate estimate of soil nitrates. Enter the subsample weight on the Soil Data worksheet.
Add Water to Subsample and Mix
Add 1/8-cup (30 mL) of distilled water to the container with the subsample. The resulting soil/water mixture equates to a 1:1 soil to water ratio on a volume basis. Put the lid on the container and shake
vigorously about 25 times.
Measure and Record EC (See Calibration Tip)
Open the container and insert the EC pocket meter into the soil-water mixture. Take the reading while the soil particles are still suspended in solution. To keep the soil particles from settling, stir gently with the EC pocket meter. Do not immerse the meter above the immersion level (See Appendix C, Figure 1c). Allow the reading to stabilize (stays the same for about 10 seconds).
Enter the EC reading on the Soil Data worksheet in decisiemens per meter (dS/m). The DiST WP 4 meter gives readings directly in dS/m. For the Microsensor 4 meter, divide the reading by 10, and for the Microsensor 3 meter, divide the reading by 100 to get readings in dS/m.
Save the soil-water mixture for the pH measurement (Chapter 6).
Turn the meter off. Thoroughly rinse meter with distilled water and replace cap.
Calibration Tip: Make sure the EC meter is calibrated before making a measurement. See Appendix C for cali-bration instructions.
1
2
3
4
Did You Know?
6. Soil pH Test
Use the same soil-water mixture prepared in the EC test to conduct the pH Test. If you are start-ing with a fresh soil sample, read the introduction and follow Steps 1-3 in the EC Test Chapter on preparing the sample.
Materials needed to measure pH:
1/8-cup (30 mL) measuring scoop
plastic specimen bottle
calibration buffer solutions
squirt bottle
pH pocket meter (red with black cap)
distilled water
Considerations: If the soil sample is saturated or very wet, a 1:1 ratio, on a volume basis, of soil to water will not be obtained in the soil-water mixture (See Step 2, Chapter 5). Let the soil dry before proceeding with Step 1 in Chapter 5. Also, a small amount of salts diffuse out of the pocket pH meter; therefore, EC measurements should always be taken first when measuring both EC and pH on the same sample.
Measure and Record pH
Make sure to periodically calibrate your pH meter (See Appendix C for instructions). If the meter has not been used in a while, place the meter in tap water for about 5 minutes before calibrating or taking a reading.
Wait about 10 to 15 minutes after the EC measurement before measuring the pH. This gives the soil particles time to settle. Insert the pH pocket meter into the topmost portion of the solution and turn the meter on. Wait until the reading stabilizes (0-30 seconds), and record the digital reading on the Soil Data worksheet.
Rinse Pocket Meter
Thoroughly rinse the electrode with distilled water.
Store the electrode with a few drops of the pH 7 buffer solution and replace the cap. (See Appendix C on storage of pH meter)
Did You Know?
Soil acidification can also be an indication of excessive N fertilizer applications and N leaching loss.
Maintenance Tips: Check the batteries and calibrate the EC and pH meters periodically. Be sure to clean the meters thoroughly to keep them working properly.
1
7. Soil Nitrate Test (NO
3-)
Use the same sample prepared for the EC and pH tests to measure soil nitrates. If you are starting with a fresh soil sample, read the introduction and follow Steps 1-3 in the EC Test Chapter on preparing the sample.
Materials needed to measure soil nitrate:
filter paper
120-mL plastic container with lid
eye dropper
nitrate/nitrite test strips
stopwatch or timer
distilled water
Fold Filter
Fold the filter paper in half (into a semicircle). Fold it again, but not quite into a quarter-circle. Leave the edges a little uneven as in Figure 7.1
(A black line is drawn for demonstration purposes.)
Insert Filter Paper into Subsample
Open the filter paper into the shape of a cone and push it (pointed part first) quickly into the jar with the soil/water mixture until it touches the bottom of the jar(Figure 7.2). Wait until about an eye dropper-full of the solution has seeped through to the inside of the filter paper. (Note: Inserting the filter paper quickly prevents it from wetting up and tearing as it is inserted.)
[For Steps 3 & 4, it would be helpful to first familiarize yourself with the directions on the side of the bottle of nitrate strips.]
Place Drops on Nitrate Strips
Using the eye dropper and one nitrate/nitrite test strip, place 1 or 2 drops of the filtered solution on each of the strip's two pads. Note the time.
NOTE: One pad measures the amount of nitrite, and the other measures the amount of nitrite and nitrate combined. Nitrite rarely occurs in measurable amounts in soils, so nitrite readings from the test strips are not recorded.
1
3
2
Figure 7.2
Did You Know?
Soil nitrates are good measures of plant-available nitrogen, but they can be readily lost from the soil by leaching and volatilization.
Measure and Record Nitrate
Align the nitrate/nitrite test strip with the bottom of the bottle with your thumb corre-sponding to the diagram on the bottle.
After 60 seconds, compare the first pad (fur-thest from your thumb) along the nitrate scale as shown in Figure 7.3. Estimate the nitrate amount according to the degree of color change. Enter the value from the nitrate scale on the Soil Data worksheet in ppm. This value is an esti-mate of nitrate-N concentration in the extract.
Did You Know?
Water samples may be taken from drinking water, well water, tile drainage, drainage ditches, and ponds. Dip a nitrate/nitrite test strip into the water and estimate the nitrate or nitrite concentration from the color chart on the test strip bottle. This test can give you an idea of how much N fertilizer is lost from the soil. (See Chapter 12).
CALCULATIONS:
Estimated (lb NO3-N/acre) =
(ppm extract NO3-N) x (depth of soil sampled in cm) x bulk density x 0.89 10
Exact (lb NO3-N/acre) =
(ppm NO3-N) x (volume water used) x (depth of soil sampled, cm) x bulk density x 0.89 (dry weight of soil) x 10
Volume water used = 30.0 mL + [dry weight of soil x soil water content (g/g)]
Note: The maximum nitrate-N reading on the nitrate/nitrite test strip container is 50 ppm. If the sample reading falls into the 50 ppm category, the sample can be diluted to get a better estimate of the actual amount over 50 ppm. To dilute the sample, fill the eye dropper with filtered solution and place five drops in a plastic container. Add five drops of distilled water; mix gently by swirling the container. Take a reading with a new test strip as stated in Step 4. Multiply the estimated nitrate-N in ppm by 2 before using the calculations. If the nitrate reading falls into the category of 50 ppm again, repeat the dilution steps, and multiply the estimated nitrate-N in ppm by 4.
Figure 7.3
4
8. Aggregate Stability
Aggregate stability measures the amount of stable aggregates against flowing water. It is recom-mended that aggregate stability be determined on the top three inches of surface soil. The soil sample should be air-dried before determining aggregate stability.
Materials needed to measure aggregate stability:
2-mm sieve (3-inch diameter)
0.25-mm sieves (2.5-inch diameter)
terry cloths
400-watt hair dryer and drying chamber
calgon solution (about 2 tbsp of calgon per 1/2 gallon of tap water)
bucket or pan
scale (0.1 g precision)
distilled water
Considerations: If the soil is moist, air-dry a sample before determining aggregate stability. When taking a soil sample, care should taken not to disrupt the soil aggregates.
Sieve the Soil Sample
Transfer about a 1/4 cup of air-dried soil to the 2-mm sieve. Shake the sieve gently and collect the soil passing through the sieve. Try to pass all of the soil through the sieve by gently pressing the soil through with your thumb (Figure 8.1).
Weigh Sieved Soil Sample
Weigh the 0.25-mm sieve, and record its weight on the Soil Data worksheet. Weigh out about 10 g of the sieved soil from Step 1 (make sure the soil is mixed well before taking a subsample). Record the exact weight on the Soil Data worksheet.
Slowly Wet the Soil Sample in Sieve
Saturate one of the terry cloth sheets with distilled water and lay it flat. Place the 0.25-mm sieve containing the soil on the wet cloth, allowing the
soil to wet up slowly (Figure 8.2). Wet the soil for five minutes.
NOTE: A container (bucket or pan) of distilled water is needed for Step 4. The water tem-perature should be at or near the temtem-perature of the soil.
1
2
3
Did You Know?
Soil aggregates protect organic matter within their structure from microbial attack. Forma-tion and preservaForma-tion of aggre-gates allows organic matter to be preserved in the soil.
Figure 8.1
Figure 8.2
Terry cloth
Wet Sieve the Soil
• Place the 0.25-mm sieve with soil in the container filled with distilled water, so that the water surface is just above the soil sample.
• Move the sieve up and down in the water through a vertical distance of 1.5 cm at the rate of 30 oscillations per minute (one oscillation is an up and down stroke of 1.5 cm in length) for three minutes. Important: Make
sure the aggregates remain immersed in water on the upstroke.
Dry Aggregates
After wet sieving, set the sieve with aggregates on a dry piece of terry cloth, which will absorb the excess water from the aggregates in the sieve. Then place the sieve containing the aggregates on the drying apparatus (Figure 8.3). Allow the samples to dry using the low power setting.
NOTE: Be careful when drying the soil to prevent particles from blowing out of the sieves. It may be necessary to put a cover over the top of the sieves to keep aggregates in place.
Weigh Aggregates
After drying, allow the aggregates and sieve to cool for five minutes. Weigh the sieve containing the aggregates. Record the weight of the sieve plus aggregates on the Soil Data worksheet.
Disperse Aggregates in Calgon Solution
• Prepare calgon solution. Immerse the sieve containing the dried aggregates in the calgon solution (do not completely immerse the sieve). Allow the aggregates in the sieve to soak for five minutes, moving the sieve up and down periodically. Only sand particles should remain on the sieve.
• Rinse the sand on the sieve in clean water by immersing the sieve in a bucket of water or by running water through the sieve.
Dry and Weigh Sand
• Remove excess water by first placing the sieve containing the sand on the dry terry cloth, then placing it on the drying apparatus. Allow sand to dry.
• After drying, allow the sand and sieve to cool for five minutes. Weigh the sieve con-taining the sand. Record the weight of the sieve plus sand on the Soil Data worksheet.
5
6
7
8
CALCULATIONS:
Water Stable Aggregates (% of soil > 0.25mm) = (weight of dry aggregates - sand) (weight of dry soil - sand)
4
Figure 8.3
seives
drying chamber
9. Slake Test
The slake test measures the stability of soil when exposed to rapid wetting. This test is qualitative and should be measured on air-dried soil fragments or aggregates.
Materials needed to measure slaking:
complete soil stability kit
sampling scoop
distilled water (1 L)
Considerations: The soil should be air-dry when performing this test. If the soil is not dry, collect surface fragments as described in Step 1 and allow them to dry. Be careful not to destroy the soil fragments while sampling.
Collect Surface Fragments
• Carefully remove soil fragments or aggregates from the soil surface. If there is a surface crust, carefully sample pieces of it. Use the flat end
(handle) of the scoop to lift out surface and subsurface fragments. If the soil has been tilled, collect some aggregates (about 1 cm in size). Be careful not to shatter the soil frag-ments or aggregates while sampling.
[image:26.612.354.543.351.661.2]• Collect 16 separate soil fragments. If there is a surface crust, collect eight fragments of the crust and eight fragments from below the crust.
Fill Box with Water
• Remove all sieve baskets from the stability kit.
• Fill the compartments in the box with water. The water should be 2 cm deep and at approxi-mately the same temperature as the soil.
Test Soil Fragments
• Place soil fragments in the sieve baskets
(Figure 9.1).
• Lower one of the sieves into a box compartment filled with water (Figure 9.2).
1
2
3
Did You Know?
Soil stability serves as a qualita-tive indicator of soil biological activity, energy flow, and nutri-ent cycling. Binding of soil particles must constantly be renewed by biological processes.
Figure 9.1
5
Observe Fragments
• Observe the soil fragment for five minutes. Refer to the stability class table below to determine classes 1 and 2.
• After five minutes, raise the basket out of the water, then lower it to the bottom. It should take one second for the basket to clear the surface and one second to return to the bottom.
• Repeat immersion four times (total of five immersions). Refer to the stability class table below to determine classes 3 through 6.
Record Ratings
• Soil stability is rated according to the time required for the fragment to disintegrate during the five-minute immersion and the proportion of the soil fragment remaining on the mesh after the five extraction-immersion cycles. [See table below.]
Record the stability ratings for all 16 soil fragments or aggregates on the Soil Data worksheet.
4
Stability class Criteria for assignment to stability class (for “Standard Characterization”)
0 Soil too unstable to sample (falls through sieve).
1 50 % of structural integrity lost within 5 seconds of insertion in water.
2 50 % of structural integrity lost 5 - 30 seconds after insertion.
3 50 % of structural integrity lost 30 - 300 seconds after insertion or < 10 % of soil remains on the sieve after 5 dipping cycles.
4 10 - 25% of soil remaining on sieve after 5 dipping cycles.
5 25 - 75% of soil remaining on sieve after 5 dipping cycles.
10. Earthworms
Earthworms are most active during the spring and fall, which are the best times to observe their activity.
Materials needed to measure the number of earthworms:
tap water (2 L)
hand trowel or shovel
large jar or container for worm collection and cleaning
mustard solution (2 tablespoons mustard powder in 2 liters of tap water)
Considerations: When examining the soil for earthworms, avoid places where their populations might be affected, such as near mulch or compost piles. The abundance of earthworms is usually patchy within a field and varies with season. Therefore, count earthworms several times during a season and use the average to gauge changes from year to year.
Dig Plot
Measure a square-foot plot and dig down 12 inches with the hand trowel or shovel (Figure 10.1). Try to minimize the number of cuts with the shovel to avoid damage to the earthworms. Dig the hole first, then sort for earthworms.
[image:28.612.356.544.320.639.2]Count the Number of Earthworms
Sort the soil samples against a pale-colored back-ground to help locate the earthworms. Separate and count the number of earthworms.
Add Mustard Solution (optional)
To facilitate extraction of deep burrowing earth-worms, add two liters of mustard solution to the hole. First, make sure the bottom of the hole is level. The deep burrowing worms should appear within five minutes (Figure 10.2). Count the number of worms.
Record Total Number of Earthworms
Record the total number of earthworms (those found in the hole and after adding the mus-tard solution) on the Soil Data worksheet. [The mustard solution should not harm the worms. Rinse them in water before returning them to the soil.]
1
2
3
4
Did You Know?
Earthworm burrowing improves infiltration and their casts improve aggregation. Earth-worms also break down larger bits of residue for use by other soil organisms.
11. Soil Physical Observations and Estimations
Materials needed in observing the soil physical properties:
tape measure
sharpshooter spade or shovel
18-inch metal rod
tap water
Dig hole
Dig a hole to a depth of 1 foot. Make it wide enough to cut out a slice of soil.
Cut Slice of Soil
Using the shovel, cut a slice of soil from a wall of the hole and lay it on the ground.
Measure Depth of Topsoil
• Measure the depth of the topsoil. Look for color changes from the soil surface downward through the soil profile. The topsoil is usually distinguished by a darker color than the underlying material (See Figure 11.1).
• Record the depth of topsoil on the Soil Data worksheet.
Observe Plant Roots
• Observe plant roots in the hole and the slice of soil. To get a better look at the roots, dig down along a plant stem. The roots should be well branched with lots of fine root hairs.
• Things to look for are balled up roots or roots growing sideways. A lack of fine root hairs indicates oxygen deprivation in the root zone. Lateral root growth indicates a hardpan, or compacted layer.
Determine Resistance
• Use the metal rod to probe one of the side walls, starting from the soil surface to the bottom of the hole. Determine changes or differences in penetration resistance as you probe the side wall
(See Figure 11.2).
• Look for compacted layers that may restrict root growth and water movement.
1
2
3
4
5
Figure 11.2 Figure 11.1
○ ○ ○ ○ ○ ○ ○ ○ ○ ○
Examine Soil Structure
Observe soil structure in the slice of soil to a depth of about 12 inches. Measure and mark, starting at the surface and moving downward; depth increments of 0 to 4 inches, 4 to 8 inches, and 8 to 12 inches. Note and record the type, size, and grade of the soil structural units or aggregates for each depth increment.
Note: Soil structure is how particles of soil are grouped together in stable collections or aggregates.
Note the type of soil structure at each of the three depth increments.
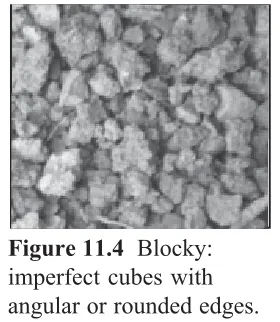
• The three general types of soil structure are granular (Figure 11.3), blocky (Figure 11.4), and platy (Figure 11.5).
• If there are no noticeable aggregates or peds, the soil has no structure. It is either single grained (Figure 11.6) or massive (Figure 11.7).
[image:30.612.229.369.274.435.2]• Record on the Soil Data worksheet the type of structure observed for each depth incre-ment.
[image:30.612.231.538.275.434.2]Figure 11.3 Granular: imperfect spheres, usually sand-size.
Figure 11.4 Blocky: imperfect cubes with angular or rounded edges.
Figure 11.5 Platy: a flattened or compressed appearance.
6a
[image:30.612.345.478.493.616.2]Figure 11.6 Single grain: unconsolidated mass such as loose sand.
Figure 11.7 Massive: cohesive mass.
Note the size of the aggregates or peds at the different depths.
• Estimate the general size of the aggregates or peds. If the structure is granular, choose from fine (Figure 11.8), medium (Figure 11.9) and coarse (Figure 11.10) granule sizes.
• If the structure is blocky, choose from very fine (Figure 11.11), fine (Figure 11.12), and medium (Figure 11.13) block sizes.
• If structure is platy, choose from thin (Figure 11.14), medium (Figure 11.15), and thick (Figure 11.16) plate sizes.
• Record on the Soil Data worksheet the size of the aggregates or peds observed for each depth increment.
6b
Figure 11.8
Fine: < 2 mm.
Figure 11.9
Medium: 2 to 5 mm.
Figure 11.10
Coarse: 5 to 10 mm.
Figure 11.11
Very fine: < 5 mm.
Figure 11.12
Fine: 5 to 10 mm.
Figure 11.13
Medium: 10 to 20 mm.
Figure 11.14
Thin: < 2 mm.
Figure 11.15
Medium: 2 to 5 mm.
Figure 11.16
Note the distinctness (grade) of the aggregates in place and when removed from the slice of soil.
The distinctness of the aggregates is either weak, moderate, or strong.
Weak structure:
• Aggregates or peds are barely observable in place in moist soil.
• When removed, the structure breaks into a few observable aggregates or peds (Figure 11.17).
Moderate structure:
• Aggregates or peds are moderately well-formed and distinct in place.
• When removed, many well-formed aggregates are observable (Figure 11.18).
Strong structure:
• Aggregates or peds are well-formed and very evident in place.
• When disturbed, the structure breaks into quite evident aggregates or peds (Figure 11.19).
Record on the Soil Data worksheet the grade of the aggregates or peds observed for each depth incre-ment.
Determine soil textural class
• Perform the Texture by Feel procedure (See page 27) on the top three inches of soil.
• Record on the Soil Data worksheet the soil textural class.
6c
[image:32.612.354.543.137.672.2]7
[image:32.612.355.542.155.400.2]Figure 11.17
Figure 11.18
7(;785(%<
)((/
352&('85(
3ODFHDSSUR[LPDWHO\JUDPVLQSDOP$GG ZDWHUGURSZLVHDQGNQHDGWKHVRLOWREUHDNGRZQ DOODJJUHJDWHV6RLOLVDWWKHSURSHUFRQVLVWHQF\ ZKHQSODVWLFDQGPROGDEOHOLNHPRLVWSXWW\ 'RHVVRLOUHPDLQLQDEDOOZKHQVTXHH]HG" ,VWKHVRLOWRRGU\" ,VWKHVRLOWRRZHW"
3ODFHEDOORIVRLOEHWZHHQWKXPEDQGIRUHILQJHUJHQWO\SXVKWKHVRLOZLWKWKHWKXPEVTXHH]LQJ LWXSZDUGLQWRDULEERQ)RUPDULEERQRIXQLIRUPWKLFNQHVVDQGZLGWK$OORZWKHULEERQWR HPHUJHDQGH[WHQGRYHUWKHIRUHILQJHUEUHDNLQJIURPLWVRZQZHLJKW 'RHVWKHVRLOIRUPDULEERQ" 'RHVVRLOPDNHDZHDN ULEERQOHVVWKDQLQFKORQJ EHIRUHEUHDNLQJ" 'RHVVRLOPDNHDVWURQJ ULEERQWZRLQFKHVRUORQJHU EHIRUHEUHDNLQJ" 'RHVVRLOPDNHDULEERQLQFK ORQJEHIRUHEUHDNLQJ" $GGGU\VRLOWRVRDN XSZDWHU ([FHVVLYHO\ZHWDVPDOOSLQFKRIVRLOLQSDOPDQGUXEZLWKIRUHILQJHU &OD\ /RDP 6LOW\ &OD\ /RDP /RDP &OD\ 6LOW /RDP 6DQG\ &OD\ /RDP 6LOW\ &OD\ 6DQG\ &OD\ 6DQG\ /RDP 6DQG /RDP\ 6DQG 'RHVVRLO IHHOYHU\ JULWW\" 'RHVVRLO IHHOYHU\ JULWW\" 'RHVVRLO IHHOYHU\ JULWW\" 'RHVVRLO IHHOYHU\ VPRRWK" 'RHVVRLO IHHOYHU\ VPRRWK" 'RHVVRLO IHHOYHU\ VPRRWK" 1HLWKHU JULWW\QRU VPRRWK" 1HLWKHU JULWW\QRU VPRRWK" 1HLWKHU JULWW\QRU VPRRWK" Yes Yes Yes Yes
Yes Yes Yes
Yes Yes Yes
Yes Yes Yes
Yes Yes Yes No No No No No No No No No
No No No
12. Water Quality Tests
A. Estimation of Water Nitrate and Nitrite levels
Materials needed to determine water nitrate (NO3-) and nitrite (NO 2
-) levels:
filter paper
120-mL plastic containers with lids
eye dropper
nitrate/nitrite test strips
stopwatch or timer
Considerations: Water samples may be taken from drinking water, well water, tile drainage, drainage ditches, and ponds. Sample surface runoff from fields, which may be a contributing source of contaminates.
Filter Water Sample (if cloudy)
Collect water sample in the plastic container. Fill to about 1/3 full.
Fold a piece of filter paper as described in Chapter 7--Soil Nitrate Test. Insert filter paper into the jar and allow the water to seep through the filter paper to the inside. [If the water sample is clear (no cloudiness or suspended particles), the sample does not need to be filtered.]
Place Drops on Nitrate and Nitrite Strips
Using the eye dropper, collect a sample of the filtered water. Place 1 or 2 drops of the filtered solution on each of the strip's two pads. Note the time.
[One pad measures the amount of nitrite and the other measures the amount of nitrite and nitrate combined.]
Measure and Record Nitrate and Nitrite.
After 30 seconds, measure and record nitrite.
Estimate the nitrite amount according to the degree of color change. Enter the value on the Soil Data worksheet in ppm from the nitrite scale on the bottle.
After 60 seconds, measure and record nitrate.
Estimate the nitrate amount according to the degree of color change. Enter the value on the Soil Data worksheet in ppm from the nitrate scale on the bottle.
[Note: Estimate results if colors on test pads fall between two color patches.]
1
2
B. Estimated Water Salinity Levels
Materials needed to estimate water salinity levels:
EC pocket meter
120-mL plastic containers and lids
distilled water
Considerations: Water samples may be taken from drinking water, well water, tile drainage, ditches, irrigation water, and ponds.
Collect Sample
Collect water sample in plastic container. Fill to about 1/3 full.
Measure Electrical Conductivity
Insert the EC pocket meter into the water sample. Allow the reading to stabilize (stays the same for about 10 seconds). Note the digital reading.
Enter the EC reading on the Soil Data worksheet in decisiemens per meter (dS/m). The DiST WP 4 meter gives readings directly in dS/m. For the Microsensor 4 meter, divide the reading by 10, and for the Microsensor 3 meter, divide the reading by 100 to get readings in dS/m. Insert the EC pocket meter into the water sample until the reading stabilizes (stays the same for about 10 seconds). Note digital reading.
Rinse Pocket Meter
Turn off the meter. Thoroughly rinse the meter with distilled water, and replace cap.
2
3
1
Did You Know?
A. References
Arshad, M.A., B. Lowery, and B. Grossman. 1996. Physical tests for monitoring soil quality. p.123-142. In: J.W. Doran and A.J. Jones (eds.) Methods for assessing soil quality. SSSA Spec. Publ. 49. Soil Science Society of America, Inc., Madison, Wisconsin, USA.
Dick, R.P., D.R. Thomas, and J.J. Halvorson. 1996. Standardized methods, sampling, and sample pretreatment. p.107-122. In: J.W. Doran and A.J. Jones (eds.) Methods for assessing soil quality. SSSA Spec. Publ. 49. Soil Science Society of America, Inc., Madison, Wisconsin, USA.
Gershuny, G. and J. Smillie. 1995. The soul of soil: A guide to ecological soil management. 3rd ed. agAccess, Davis, California, USA.
Herrick, J.E., W.G. Whitford, A.G. de Soyza, J.W. Van Zee, K.M. Havstad, C.A. Seybold, M. Walton. 2001. Soil aggregate stability kit for field-based soil quality and rangeland health evaluations. Catena 44(1):27-35.
Parkin, T.B. and J.W. Doran. 1996. Field and laboratory tests of soil respiration. p.231-246. In: J.W. Doran and A.J. Jones (eds.) Methods for assessing soil quality. SSSA Spec. Publ. 49. Soil Science Society of America, Inc., Madison, Wisconsin, USA.
Powell, D. and J. Pratley. 1991. Sustainability kit manual. Centre for Conservation Farming. Charles Sturt University-Riverina, PO Box 588, Wagga Wagga 2650, Australia.
Rowell, D.L. 1994. Soil science: methods and applications. Longman Scientific & Technical, Singapore.
Sarantonio, M., J.W. Doran, M.A. Liebig, and J.J. Halvorson. 1996. On-farm assessment of soil quality and health. p.83-106. In: J.W. Doran and A.J. Jones (eds.) Methods for assessing soil quality. SSSA Spec. Publ. 49. Soil Science Society of America, Inc., Madison, Wisconsin, USA.
Seybold, C.A. and J.E. Herrick. 2001. Aggregate stability kit for soil quality assessments. Catena 44(1):37-45.
B. Soil Respiration (Alternative Method)
This alternative method uses a kit produced by Woods End1 known as the Solvita Soil Life Kit1. Instead of the Draeger tube apparatus, this procedure uses "paddles" inserted into a plastic con-tainer with the soil sample (See procedure on page 32). The use of this method eliminates the need for the Draeger tube (carbon dioxide adsorption tube), needle, and syringe. With the Solvita kits, results are given in 24 hours instead of 30 minutes with the Draeger method. The color change of the paddles may also be easier to distinguish than reading the color change off the Draeger tubes. The Solvita kit also requires the soil to be disturbed and will falsely stimulate microbial activity similar to the action of tillage. However, when used to compare sites, both soils are disturbed and the relative differences are noted. This procedure also reduces the effects of root respiration. Picking out as many roots from the sample as possible will further eliminate their CO2 contribu-tion. The Solvita kit may be preferred if immediate results are not necessary and the microbial activity differences without the influence of plant roots are desired.
The Solvita kit comes with well written and user friendly instructions and interpretations. There is also a trouble shooting guide to help the user. The kit consists of four parts: the sample jar to hold the correct volume of soil for the test (Figure 1b); a foil-pack containing a special color gel paddle
(Figure 2b); instruction manual; and a color key for reading results (Figure 2b).
[image:37.612.356.541.410.544.2]Solvita Soil Life kits can be obtained from Woods End Research, Mt. Vernon, ME; [email protected].
Figure 1b Figure 2b
Paddle
The following is part of the instructions from the SOLVITA SOIL LIFE KIT1:
C. EC and pH Meter Maintenance and Calibration
EC meter maintenance:
·
Do not immerse the EC meter above the immersion level(Figure 1c). Under no circumstances should the meter be immersed above the display level.·
When not in use, switch off the meter and replace the protective cap.·
To improve performance, clean the stainless steel electrodes periodically by rinsing them in alcohol for a few minutes.·
Replace all four batteries if the display becomes faint or disappears or if the readings are unstable or constant.·
To change batteries for DiST WP1 models, unscrew the top with a coin and replace the batteries (Figure 2c).EC meter calibration:
·
Immerse the meter into the calibration solution (1.41 dS/m).·
Allow the reading to stabilize. Using a small screw-driver, turn the Calibration Trimmer to match the solution value, 1.41 dS/m (normally at 25 C).pH meter maintenance:
·
Crystals may appear around the cap (Figure 3c). This condition is normal. The crystals will dissolve when rinsed with water.·
After use, rinse the electrode with water to minimize contamination.·
Store the electrode with a few drops of storage solution (HI 70300L) or pH 7 solution in the protective cap. DO NOT STORE IN DISTILLED OR DEIONIZED WATER.·
Always replace the protective cap after use.Figure 2c.
Figure 3c.
Calibration Trimmer
Batteries
Figure 1c.
Immersion Level
·
Large differences in pH readings (± 0.5 pH) could be due to lack of calibration, dry electrode, or rundown batteries. [image:40.612.357.540.82.228.2]·
If the pH meter cannot be switched on or if the display fades, unscrew the battery compartment and replace all four batteries, paying attention to their polarity (Figure 4c).pH meter calibration (pHep 3
1):
·
Prepare buffer solutions. Only 2 buffers are needed, pH 7 and 4 or 10, depending on the pH range of your soils (see Figure 5c).·
Switch the unit on by pressing the ON/OFF button.·
With the meter on, press and hold the ON/OFF button for about three seconds. The display will start blinking "7.0o" to confirm that you have entered the calibration mode.·
Immerse the pH meter in the pH 7 buffer solution. Stir gently and wait approximately 20 seconds.·
If "Ec" appears on the display, the pH 7 solution is not fresh, or the electrode is not conditioned.·
The pHep 31 meter automatically confirms the pH 7 calibration after the meter is adjusted. The display will blink "4.0o". After a few seconds, it will display "Ec" to prompt you to use a second buffer solution.·
Rinse the electrode with water and immerse in pH 4 for acidic samples or pH 10 for alkaline samples. Allow approximately 20 seconds for the meter to auto-confirm the reading. Once the display stops blinking, the meter is calibrated and ready to use. ALWAYS USE FRESH BUFF-ERS FOR CALIBRATION.Figure 5c.
1Trade names are used solely to provide specific information. Mention of a trade name does not constitute a guarantee of the product by the U.S. Department of Agriculture nor does it imply endorsement by the Department or the Natural Resources Conservation Service over comparable products that are not named.
Figure 4c.
Battery compartment
[image:40.612.355.540.552.671.2]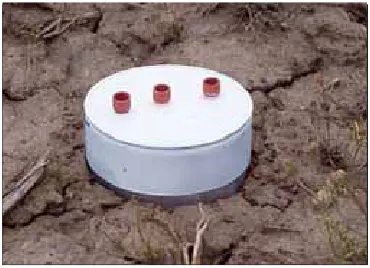
![[Note: See Considerations above if soil is wet.]11Figure 4.3](https://thumb-us.123doks.com/thumbv2/123dok_us/8485261.343462/17.612.382.560.532.680/note-considerations-soil-wet-figure.webp)