by
Charles Ray GearcL
B,AgrScn (Melba)
submitted in fulfilment of the requirements for the Degree of
Master of Science
UNIVERSITY OF TASMANIA HOBART
This thesis contains no material which has been accepted for the award of any other degree or diploma in any
University and, to the best of my knowledge and belief, it contains no material previously published or written by another person, except when due reference is made in the text.
This study was initiated during the course of a Plant Breeding Fellowship from the Department of Agriculture, Hobart, Tasmania, in the Genetics section, Division of Plant Industry, C.S,I.R.O., Canberra, A.C.T., and
continued in the Department of Botany, University of Tasmania.
Dr. W.J. Peacock, Principal Research Officer,
iv
CONTENTS
Page DECLARATION
ACKNOWLEDGEMENTS
CONTENTS iv
SUMMARY vi
INTRODUCTION 1
Chromosome studies utilising autoradiography. 5 Experimental evidence on the behaviour of DNA
in chromosomes, 6
Autoradiographic evidence on the organisation
of DNA within chromosomes. 12
SECTION I
AUTORADIOGRAPHIC ANALYSIS OF THE CHROMOSOMES OF
VICIA FABA. 16
MATERIALS AND METHODS 16
RESULTS 20
a. Distribution of label.in second division
chromosomes. 20
b. Chromosomes showing label segregation. 22
c. Total chromosomes, 25
d. Classes of isolabelling. 34
e. Single and twin sister chromatid exchanges, 36 f. Single and twin isolabelling segments. 41 g. Position of sister chromatid exchanges on
S chromosomes, 42
h. Centromere "exchanges" in M chromosomes. 42
DISCUSSION 43
Sister chromatid exchanges. 44
a, Frequency of exchanges. 44
b. Effect of colchicine. 46 •
c. Exchange distribution. 46
Single to twin sister chromatid exchange ratios. 48 Single and twin sister chromatid exchanges in
Vicia faba. 54
REFERENCES 61
APPENDIX I 66
APPENDIX II 74
SECTION II
MITOTIC CYCLE DETERMINATIONS 75
INTRODUCTION 75
EXPERIMENTAL METHODS 76
I. Vicia faba. 76
II. Spironema fragrans 77
RESULTS 79
DISCUSSION 84
Possible sources of error 88
vi
SUMMARY
A quantitative analysis of sister chromatid
exchanges and labelling patterns in H 3 thymidine labelled second division (post isotope incorporation) chromosomes of Vicia faba has demonstrated that:
(1) The frequency of sister chromatid exchanges per chromosome is proportional to chromosome length. (2) The time of availability of colchicine may have a
slight effect on the prospects of sister chromatid exchange events. However, overall, colchicine has no significant effect on the frequency of sister chromatid exchanges; on the incidence of lso-labelling or on the type of iso-lso-labelling
(3) The distribution of sister chromatid exchanges per chromosome follows a Poissonian form. The prospects of sister chromatid exchange events at either the first or second interphases are equal and
independent.
(5) A high frequency of chromosomes show isolabelling, the probability of which increases with chromosome
length and/or exchange frequency.
(6) Twin and single isolabelling segments have been noted, however the ratios obtained do not fit those for sister chromatid exchanges and the origin of isolabelling remains unexplained.
INTRODUCTION
Within the cell, chromosomes are products of molecular organisation concerned with the storage, transcription and replication of genetic information. That the chromosomes of higher organisms carry the factors of heredity has been known for nany years (Wilson, 1925 pp.923 et seq, pp.1112
et seq; Darlington, 1960).
In order to achieve their functions within the cell, the chromosomes undergo structural changes which can vary consistently in time.
In their less condensed form i.e., in interphase, transcription and/or replication are carried out, the chromosomes being metabolically active; whereas in a condensed form, as in metaphase, the chromosomes are
concerned with preservation and segregation. These varied morphological transitions and their observed size and
structural complexities tend to obscure the fundamental organisation of the chromosome.
Studies of the distribution and behaviour of the chromosomes component molecules have been achieved in at least four technical means (see for instance Lewis and John, 1963):
(ii) the cytophotometric study of intact cells and/or individual chromosomes;
(iii) the study of enzymic degradation of chromosomes;
(iv) the autoradiographic study of isotopically labelled chromosomes.
Either light or electron microscopy can be used with (iii) and (iv).
This study presents results from experiments utilising autoradiography in conjunction with light microscopy.
The chemical analysis of chromosomes has primarily involved the analysis of isolated interphase nuclei. Miescher in 1871 (cited by Wilson, 1925, p.640) carried out the first important investigation of the chemical nature of the cell nucleus. He isolated a complex nucleo-protein from salmon spermatazoa and found similar if not identical substances in sperm heads of other species, as well as in nuclei of certain somatic cells. The whole complex he termed "nuclein" while an organic base
component which was present in considerable quantities in fish sperm he termed "protamin". Kossel in 1884 (cited by Stedman and Stedman, 1947, p.234) in a study with goose erythrocytes found a more complex basic protein in
3
Since fish sperm possesses the composition claimed it follows that nucleic acid is a major component of the
chromosomes. Cytological characterisation of chromosomes is at times based on the nucleic acids and their basophilic staining properties.
Further chemical analyses in a comprehensive range of higher organisms have been carried out. Stedman and
Stedman (1947) found that all nuclei contained nucleic acid and basic proteins and also acidic proteins, which they termed "chromosomin". They postulated that
"chromosomin" was the hereditary material since they
believed that proteins were the only compounds capable of accounting in a broad manner for the hereditary functions of the chromosomes. Mirsky (1947) found desoxyribonucleic acid (DNA), ribonucleic acid (RNA), either histones or protamines and some non-histone protein in salmon
erythrocytes and sperm, liver, kidney and salivary gland nuclei. Between tissues from the one organism he found profound differences in RNA and non-histone protein content but not for DNA content.
associated in the chromosomes. Maio and Schildkraut
(1967) believe that ribosomal RNA was associated with the chromosomes since they found that over eighty per cent of the extracted RNA was similar to ribosomal RNA.
Therefore, it is probable that a DNA - residual
protein complex is responsible for maintaining chromosome structure. It does not appear possible at this stage to confine responsibility for basic chromosome structure to any of the molecular components, since there is
considerable difficulty in relating information at the molecular level to the structure of the chromosome itself.
Prescott (1961) has commented on the tendency to relegate the protein content of chromosomes to a position of minimal importance. Busch et al (1964) are doubtful that histones are related to the structure of metaphase chromosomes, but they believe that other acidic nuclear proteins may be. Presumably the different morphological states of the chromosome are the result of varying protein configurations; and protein synthesis is an essential part of chromosomal duplication. However chromosome
duplication is sometimes tacitly equated with DNA
synthesis, and this is the case with this study, since only the DNA component of the chromosomes will be
5
The work leading to the discovery that DNA is the hereditary material and the implications therefrom are well documented in many texts e.g. Watson (1965); Stahl
(1964); Sager and Ryan (1961). The Watson-Crick-Wilkins helical structure for DNA (Watson and Crick 1953a., b., c., Wilkins, Stokes and Wilson, 1953) changed the whole concept of nucleic acid as being a "molecular midwife"
(Darlington, 1947 p.266) to that of being a "molecular mother".
Chromosome studies utilising autoradiography.
Thymidine is a specific precursor. for DNA (Reichard and Eastborn, 1951); therefore if thymidine is "labelled" in some way and made available to cells it will be taken up and be apparent only in the chromosomes. This is possible using the technique of autoradiography (for
applications in biology and problems, see Taylor, 1956; Ficq, 1959; Perry, 1965), This technique involves the recording of ionising particles from a radio-isotope in a special photographic emulsion super-imposed on the
material containing the isotope.
For autoradiographic studies at the chromosomal level tritium allows a very precise localisation because its emitted beta particles are of low energy (approximately 0.018 Mev) and affect only one silver grain in a
± 1 p and depending on the preparation possibly less
(Taylor, 1956; Perry, 1965 Table II p.311). Taylor (1956 p.573) stated, "Although tritium has not been used much in autoradiography, it should prove very useful for high resolution work. With its long half life and low energy beta particles it should be a good label for chromosomes
that are to be followed through several divisions."
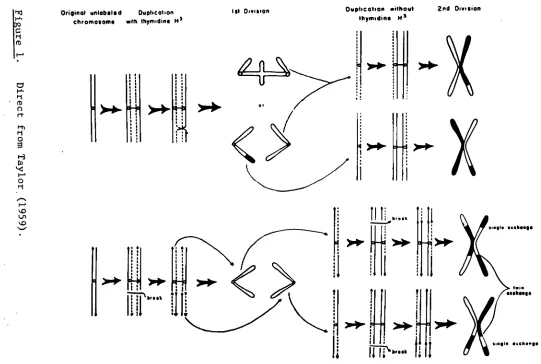
Taylor thoroughly substantiated this statement when he used the combination of thymidine and tritium in a series of autoradiographic studies with chromosomes which Stahl (1964 p.70) has referred to as, "the most compelling experiments to date on the organisation of DNA in
chromosomes". (see Taylor, Woods and Hughes, 1957; Taylor, 1958, 1959).
The unit of observation was not the DNA molecule but the DNA contained in a chromosome, the study of which enabled conclusions to be reached on the molecular organisation of DNA within the chromosome.
Experimental evidence on the behaviour of DNA in chromosomes
Taylor, Woods and Hughes (1957) grew broad bean
(Vicia faba) roots in a solution containing tritiated
thymidine for a time. They then followed the course of the tritiated thymidine in the chromosomes over two
7
following isotope incorporation, label was equally distributed over both chromatids of each metaphase
chromosome. At the following division label was confined to one chromatid, except in cases where only part of one chromatid was labelled opposite its partners unlabelled region. These reciprocal events were termed "sister chromatid exchanges".
Taylor et al (1957) were able to assign cells to their appropriate division since after labelling the material was transferred for further growth to a medium containing colchicine, which permits chromosome
duplication while preventing cytoplasmic division.
Therefore cells with twenty four chromosomes (tetraploids) were second division post labelling cells.
The results obtained demonstrated that the anaphase chromatid consists of two DNA sub-units both of which are replicated and segregated from each other at the first division; resulting in equal labelling of the daughter chromatids which are themselves double. This doubleness is shown at the second division when the old unlabelled and new labelled sub-units segregate from each other. This study complemented a parallel investigation on isotope incorporation into the DNA of rapidly dividing
Escherichia coli cells by Meselson and Stahl (1958).
The Watson-Crick theory of semi-conservative DNA
duplication was confirmed at the molecular level (Meselson and Stahl, 1958) and paralleled at the chromosomal level (Taylor et al, 1957). Rightly so, these two experiments are well documented in biology texts e.g., Kimball (1965 pp.457-459)0
The semi-conservative replication of DNA in higher organisms has been confirmed by Simon (1961) in mammalian cells and Filner (1965) and Haut and Taylor (1967) in plant cells; using density gradient centrifugation similar to the technique of Meselson and Stahl (1958).
Autoradiographic experiments have with some
exceptions also confirmed the general pattern of isotope distribution shown by Taylor et al (1957), (see Taylor, 1963 p.76).
Exceptions to the general pattern
La Cour and Pelc (1958) observed in Vicia faba that radio-activity as determined in grain development was not
equally distributed over both chromatids at the first division if colchicine was present during labelling If colchicine was omitted they found that sister chromatids at the second division were in some instances labelled in the same region. They concluded that the results of
Taylor et al (1957) were inconclusive in that the
9
the newly synthesised DNA. Woods and Schairer (1959) questioned these observations and presented data of grain counts over sister chromatids at the first division after labelling; showing no significant differences either with or without colchicine. Peacock (1965) has also carried out statistical tests of grain distribution and shown no significant asymmetry between chromatids at the first
division. However Taylor (1963) has found that the use of high specific activity tritiated thymidine produces an apparent significant asymmetry (as observed by La Cour and Pelc, 1958) which he interprets as "evidence for the out of phase replication of the two sub-units of a chromatid",
(Taylor 1963 p.76)0
La Cour and Pelc (1959) replied to the criticism of Woods and Schairer (1959) by pointing out differences in their respective experimental methods and stressed the occurrence of label over equivalent areas of second
Peacock (1963) varied the time of colchicine
treatments in autoradiographic experiments with Vicia faba.
He obtained consistent results between treatments for both first and second division scored chromosomes. Therefore the claim of La Cour and Pelc (1958) that colchicine influences the distribution of newly symthesised DNA was not supported. He also found from a quantitative analysis
of sister chromatid exchanges that colchicine had no
influence on the prospects of an exchange event. However in each experiment he found a significant proportion of second division chromsomes were labelled over similar regions of both chromatids i.e., "isolabelled". Since "isolabelling" cannot readily be accommodated on the basis of a single DNA molecule per chromatid Peacock (1963)
interpreted his results to accommodate exchanges between sub-chromatid units and concluded that Vicia faba
chromosomes could have a lateral multiplicity of DNA molecules.
Other reports of isolabelling have been by Gay (1965) in Haplopappus gracilis, Walen (1965) in cultured cells of the marsupial Potorous tridactylis and Evans (personal communication to Peacock, 1965) in Anium.
Zweidler (1964) also working with Anium has reported different results. After determining the mitotic cycle of Anium cepa he carried out autoradiographic experiments
11
where metaphase cells were allocated to their respective divisions by the time at which they were found post
labelling. On this basis he has reported that at first division both chromatids of each chromasome were strongly labelled; at the second division both chromatids were labelled but not as much; at the third division one chromatid was labelled and the other not, except for
sister chromatid exchanges; at the fourth division only part of one chromatid was labelled.
A few chromosomes at the second division were
observed with one chromatid partially unlabelled, while a few chromosomes at the third division showed isolabelling. On the basis of these observations Zweidler (1964) has concluded that at least two replication units per
chromatid must be present, with the first detectable
separation taking place at the second division. Therefore he concludes that the chromosomes of Allium cepa are
normally polytenic and are "kryptotetraploid" (Zweidler, 1964 p.62). Since Gall (personal communication to Taylor, 1963) found a regular semi-conservative behaviour of
Autoradiographic evidence on the organisation of DNA within chromosomes
Taylor (1958, 1959) used quantitative studies of sister chromatid exchanges to provide information on the organisation of chromosomal DNA. Studies on second
division metaphase cells (tetraploids induced by colchicine) of Bellevalia romana allowed the
classification of sister chromatid exchanges into two types. Twin exchanges were exchanges which occurred at identical places on two sister chromosomes and single exchanges were those where there was no corresponding
paired exchange. Taylor (1958) suggested that chromosomes with twin exchanges derived from one original labelled chromosome; exchange between chromatids taking place at the first division after labelling.
The expectation of the ratio of twin to single sister chromatid exchanges of second division paired sister
)114P•
>4-
1
>41P
>41*
Di
rect f
ro
m T
a
yl
or
.
(1
959
)
.
Original unlabeled Duplic (Pion chromosome with thymidine H3
let Division Duplication without 2nd Division
[image:20.709.64.605.76.440.2]themidins H 3
Dire
c
t
fr
om
Tay
lor
(
19
59).
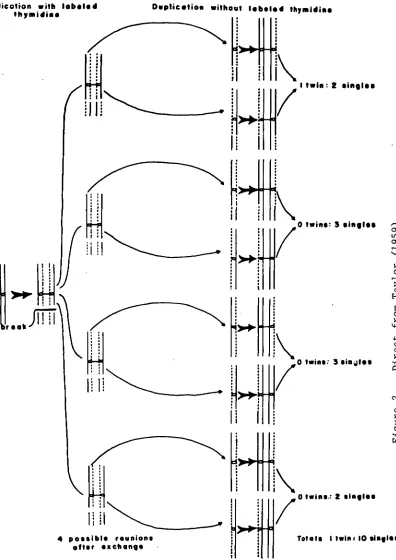
0 twins: 3 singles
0 twins: 3 sinillee I twin: 2 singles
0 twins.: 2 singles
Totals I twin/ 10 singles 4 possible reunions
[image:21.539.117.513.29.589.2]after •schtings
13
Taylor's predictions of:
2 single exchanges : 1 twin exchange for restriction of reunion and 10 single exchanges : 1 twin exchange for unrestricted reunion were based on the assumption that sister chromatid exchanges are spontaneous events. The first results obtained did not fit either prediction
viz.
30 single exchanges : 80 twin exchanges (from Taylor 1958 p.521). However the ratio found (0.37 : 1) was
closer to a 2 : 1 ratio than a 10 : 1 ratio, such that the no restriction hypothesis could be discarded.
Therefore Taylor concluded : "This frequency can be explained only on the hypothesis that the two strands of the chromosome are unlike i.e. are not free to re-unite at random. Therefore the chromosome has two features in
common with the Watson-Crick model of DNA. It has two strands and the strands are different in some structural feature that restricts reunion to like strands when
chromatid exchanges occur". (Taylor, 1958 p.528).
the same time as the tritiated thymidine, and since a lag might have occurred in the colchicine effect, it was also
supplied two hours before the tritiated thymidine. The results were (Taylor, 1959 p.70):
viz. colchicine with tritiated thymidine
36 single exchanges : 30 twin exchanges; colchicine before tritiated thymidine
26 single exchanges : 14 twin exchanges
Therefore the conclusions of Taylor (1958) were confirmed and also colchicine was shown to affect the prospect of sister chromatid exchanges in Bellevalia romana. The
results obtained by Taylor et al (1957) and Taylor (1958, 1959) suggest that
(1) Each chromatid consists of two parts.
(2) Each of these two parts remains intact during duplication.
(3) The two parts are dissimilar and complementary. The simplest requirements of the Watson-Crick model for DNA are met and each chromatid could therefore consist of one or a linear series of DNA molecule(s).
Exceptions to the labelling patterns found by Taylor
et al (1957) have been presented while Taylor's
conclusions with regard to sub-unit dissimilarities are complexed by the unexplained effect of colchicine in
15
Peacock (1963) considered that the karyotype of Vicia
faba precluded a quantitative analysis of sister chromatid
exchanges, however the large metacentric (M) chromosome is amenable to such an anlysis. Also Peacock (1963) has
shown that there is no effect of colchicine on the prospect of sister chromatid exchanges in Vicia faba.
Therefore this organism was chosen for a comprehensive quantitative analysis of sister chromatid exchanges.
The correct interpretation of results depends on a knowledge and understanding of the time relations of the various stages of the mitotic cycle. Therefore a
preliminary requirement to further work is the
determination of mitotic cycle times under the experimental conditions to be employed. This was carried out for
SECTION I
Autoradiographic analysis of the chromosomes of
Vicia faba
Materials and Methods
Secondary roots of Vicia faba (var. Cole's Dwarf Prolific) were cultured in fully aerated sterilised modified Hoagland's solution. Tritiated thymidine
(Amersham) at the rate of 2 pc/ml with a specific activity of 3.0 Cu/mM was made available to the roots for two hours. At the termination of labelling the roots were washed
thoroughly in running tap water and returned to an
isotope-free aerated culture solution. All experiments were carried out at 22 ± 0.5 °C. Four different colchicine treatments were used (colchicine concentration 0.025% in culture solution).
A 1 hour colchicine, 3 hours subsequent to removal of the isotope (3 replicate experiments)
1 hour colchicine during the second hour of isotope treatment (2 replicate experiments)
1 hour colchicine, 1 hour prior to isotope treatment (1 experiment)
17
The times of fixation of root tips varied slightly from experiment to experiment. Four to six root tips being taken at each fixation time,
Fixation times Al 18-24 hours post label 1/2 hourly It It
II 21-29
It II III 19-26
II II BI 19-26
It It hourly II 22-29
22-29
It II
19-26 1/2 hourly
Fixation was in ethyl alcohol : acetic acid 3 : 1 for at least two hours under refrigeration. Root tips were
hydrolysed in N HC1 for 10 minutes at 60°C and stained by the Feulgen technique. Squashes of the terminal heavily stained portion of the meristem were made on subbed slides in 45% acetic acid after removal of the root cap. Cover slips were removed after freezing in liquid air or on solid carbon dioxide, and the slides placed in absolute alcohol. Slides were then taken through the alcohol
series (5 minutes in each of 95%, 90%, 70%, 50% and 30% ethyl alcohol in water) to distilled water.
Prior to dipping in Kodak NTB or Ilford K2 nuclear track emulsion the slides were brought to 40°C in
distilled water, Slides were dipped in emulsion at 40°C in the dark room with sole illumination through a Kodak
Wratten series 2 safelight filter. Slides were allowed to dry then placed in light tight boxes containing silica gel and kept under refrigeration. One or two slides were
developed and examined for suitable grain density at
intervals until all slides were developed at varying times from 4 to 12 weeks post dipping. Autoradiogram
development was carried out in Kodak Dektol : distilled water 1 : 1, for 2 minutes at approximately 18 ° C; rinsed in distilled water; fixed in Kodak acid fixer for 5 minutes and finally washed in running water for at least 30 minutes. Slides were allowed to dry and cover slips mounted in
Euparal.
All slides were scanned under low power. Those
showing a reasonable incidence of labelled tetraploid cells (except for treatment D) were retained for extensive
scanning and scoring under oil immersion. Each suitably labelled metaphase or colchicine anaphase cell was
considered separately. The karyotype of Vicia faba
consists of one metacentric (M) and five subelocentric (S) chromosomes; the S chromosomes being individually
indistinguishable.
The pattern of labelling over the chromosomes was drawn on sheets illustrating an idealised karyotype of
Vicia faba (Figure 3). In treatments A, B and C only
1
1 1 1
0
1 1
1
1 1
1 1
1 1 1 1
1 1
I. 1 1 10
1 1 1 1
1 1 0
1 1
10 1 0
1 0
1 1 10
1 1
[image:28.537.72.467.40.671.2]1 1 10
Figure 3. Idealised karyotype of Vicia faba. Bq
ej
ei
OTA
0
0
0 0
0 0
0
1
1
1 1 1
1
1
1
frequency of sister chromatid exchanges and the frequency and class of isolabelling (Peacock, 1963) in both S and M chromosomes were recorded in all experiments. Only fully
labelled chromosomes were scored for sister chromatid exchanges.
Twin and single exchanges were scored in pairs of sister M chromosomes. Only those tetraploid cells (in A, B and C) in which 3 or all 4 of the metacentrics could be scored were included in the analysis. Two hours label is adequate to completely label chromosomes, however many cells are found with discontinuously labelled chromosomes. Asynchromy of replication of the 2 original M chromosomes produces 2 pairs of dissimilarly labelled M chromosomes at
the second division metaphase. Similar discrete regions of label on chromosomes enable sister pairs to be
t
Qt4
V4
4..
i4;:2
1
•
••••S
e
git
*os
PP
•dl
so*
.441
cow
•• ■•qittp.
, . 4- lot.
..,. .. s
.•. -fr
fir
Figure Various metaphase chromosome configurations of Vicia faba depicting second division
Results
In all experiments the slides with the greatest number of labelled second division metaphases were found from fixations 24 to 27 hours. In treatments A, B and C these could be identified by tetrapkddy as well as label distribution patterns. Diploid cells of similar pattern were found over this period in treatment D. On the basis of the mitotic cycle determinations in Section II, there has been little or no radiation induced delay in these experiments
(cf.
Peacock, 1963).For the majority of parameters that were scored, replicate experiments were homogeneous, and therefore results have been bulked for comparisons between
treatments. The results obtained for replicate experiments are recorded in Appendix I,
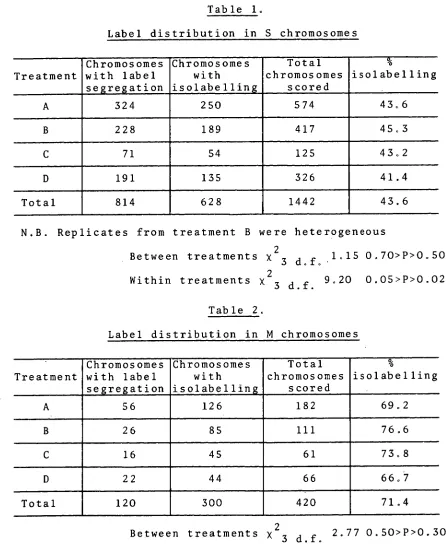
a. Distribution of label in second division chromosomes In all experiments there was a consistent higher incidence of isolabelling than has been reported
previously. When scoring, the labelling pattern was depicted as accurately as possible on the idealised
21
Table 1.
Label distribution in S chromosomes
Treatment
Chromosomes with label segregation Chromosomes with isolabelling Total chromosomes scored 1, % isolabelling
A 324 250 574 43.6
B 228 189 417 45.3
C 71 54 125 43.2
D 191 135 326 41.4
Total 814 628 1442 43.6
N.B. Replicates from treatment B were heterogeneous
Between treatments x 23 cLf. 1.15 0.70>P>0.50 Within treatments x23 d.f. 9.20 0.05>P>0.02
Table 2.
Label distribution in M chromosomes
Treatment
Chromosomes with label segregation Chromosomes with isolabelling Total chromosomes scored % isolabelling
A 56 126 182 69.2
B 26 85 111 76.6
C 16 45 61 73.8
D 22 44 66 66.7
Total 120 300 420 71.4
2
The heterogeneity x2 test between treatments (Tables 1 and 2) show that the time of application of colchicine has no influence on the proportion of isolabelling. However
incidence of isolabelling increases with chromosome length.
b. Chromosomes showing label segregation
In order to analyse the frequency of sister chromatid exchange events those chromosomes without any isolabelling will be considered separately. For the purposes of
analysis class frequencies have been summed to that class with an expectation of 5 or greater (Mather, 1966 p.175).
Table 3.
Frequency of sister chromatid exchanges in S Chromosomes
Treatment
No. of exchanges per chromosome Total chromosomes
scored
0 1 2 3 4 5 6
A 55 111 107 39 9 3 0 324
B 32 63 72 43 13 4 1 228
C 7 24 22 15 3 0 0 71
D 21 78 60 23 7 1 1 191
Totals 115 276 261 120 32 8 2 814
Between treatments x2
23
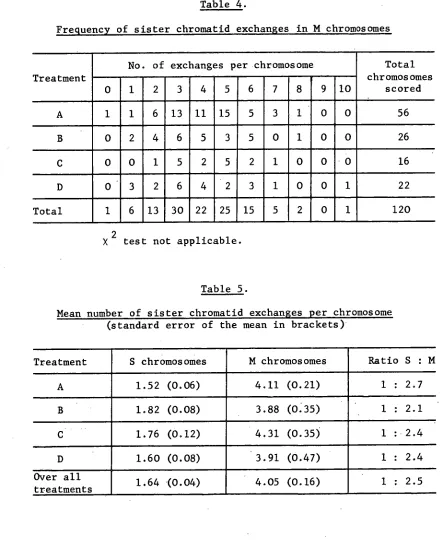
Table 4.
Frequency of sister chromatid exchanges in M chromosomes
Treatment
No. of exchanges per chromosome Total
chromosomes scored
0 1 2 3 4 5 6 7 8
t
9 10
A 1 1 6 13 11 15 5 3 1 00 56
B 0 2 4 6 5 3 5 0 1 0 0 26
0 0 1 5 2 5 2 1 0 00 16
D 03 2 6 4 2 3 1 0 0 1 22
Total 1 6 13 30 22 25 15 5 2 0 1 120
2
X test not applicable.
Table 5.
Mean number of sister chromatid exchanges per chromosome (standard error of the mean in brackets)
Treatment S chromosomes M chromosomes Ratio S : M
A 1.52 (0.06) 4.11 (0.21) 1 : 2.7
B 1.82 (0.08) 3.88 (0.35) 1 : 2.1
C 1.76 (0.12) 4.31 (0.35) 1 :2.4
D 1.60 (0.08) 3.91 (0.47) 1 : 2.4
Over all
From Tables 3 and 5 there is an indication that time of application of colchichine has a slight effect on
sister chromatid exchanges in S chromosomes but not in M chromosomes (Table 5). Since the direct x 2 test on the observed class frequencies involves the grouping of
terminal classes the level of significance obtained is not adequate for a definite conclusion to be made. However if colchicine is present during the first S and G1 periods, sister chromatid exchanges appear to be increased.
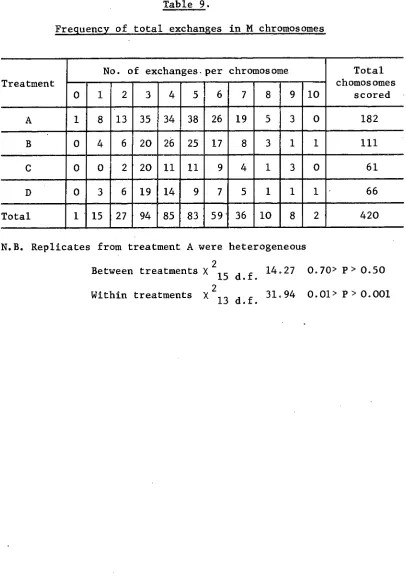
The relative lengths of the S and M chromosomes were derived from the work of Martin and Shanks (1966). The S chromosomes vary slightly in length; the ratio of S : M chromosomes being 1 : 2.4. This is in good agreement with the ratio of exchanges for S and M chromosomes, and shows that exchange frequencies are proportional to chromosome length.
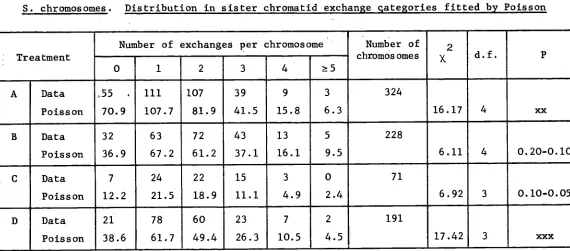
If sister chromatid exchanges are produced by statistically independent events the frequency
distribution of chromosomes in sister chromatid exchange classes should follow a Poissonian form. Using the
25 treatments; treatment totals are tested against a Poisson distribution; (Table 6) and for M chromosomes the overall total frequency distribution is tested against a Poissonian form (Table 7).
In the Poisson distribution the mean and the variance are equal. The variance/mean ratio therefore provides a test of the Poissonian nature of a distribution, avoiding any grouping of terminal classes, and preserving any
trends in the deviations from expectation (as used by
Jackson and Barber, 1958 Tables 6 and 7). The significance of deviations of the ratio from unity can be tested by
using the ratio of the sum of squares to the mean, which has a x 2 distribution (Anderson and Bancroft, 1952 pp.139
et seq). For some distributions numbers were inadequate
for test against a Poisson, and the variance/mean ratio for all individual distributions are given in Appendix I.
From Table 6, for two treatments the distributions differ significantly from a Poisson. It can be seen from the tables that there is some under-dispersion. This is substantiated by the variance : mean ratios from
individual experiments (see Appendix I).
c. Total chromosomes
S. chromosomes. Distribution in sister chromatid exchange qategories fitted by Poisson
Treatment
Number of exchanges per chromosome Number of chromosomes
2
x d.f. P 0 1 2 3 4 _-..5
A Data _55 . 111 107 39 9 3 324
Poisson 70.9 107.7 81.9 41.5 15.8 6.3 16.17 4 xx
B Data 32 63 72 43 13 5 228
Poisson 36.9 67.2 61.2 37.1 16.1 9.5 6.11 4 0.20-0.10
Data 7 24 22 15 3 0 71
Poisson 12.2 21.5 18.9 11.1 4.9 2.4 6.92 3 0.10-0.05
D Data 21 78 60 23 7 2 191
[image:37.723.65.635.100.351.2]Table 7.
M chromosomes. Distribution in sister chromatid exchange categories fitted by Poisson
Number of exchanges per chromosome Total
number of chromo-somes
X2 d.f. P
0 1 2 3 4 5 6 7 8 >9
All
treatments
Data 1 6 13 30 22 25 15 5 2 1 120
9.22 6 0.20-0.10
similar tables can be formed. If it is assumed that isolabelling represents regulation following an exchange event (Peacock, 1963) then the class of isolabelling found can be equated with exchanges. In this study, terminal and complete isolabelling are taken as equivalent to I exchange (contra Peacock, 1963 who considered complete isolabelling as equal to no exchange) and intercalary isolabelling as equivalent to 2 exchanges. For M
chromosomes in particular, isolabelling was frequently found in combination with sister chromatid exchanges. For both S and M chromosomes the overall total frequency
distributions are tested against a Poissonian form (Tables 11 and 12).
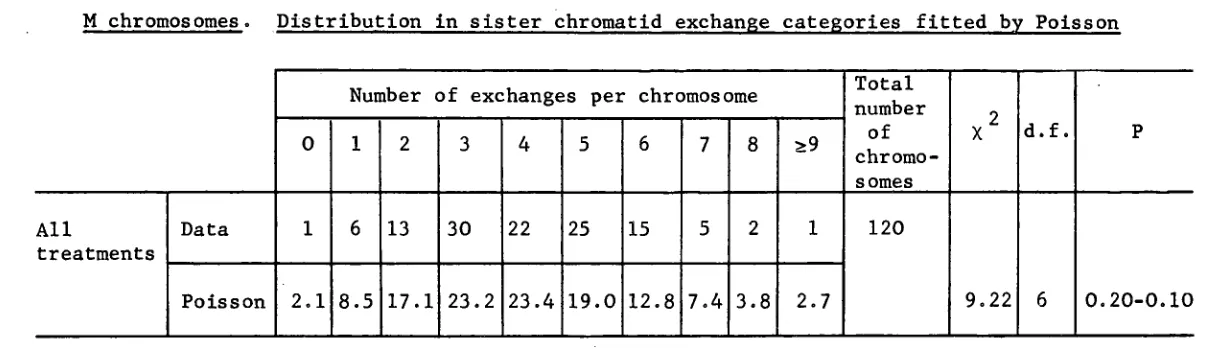
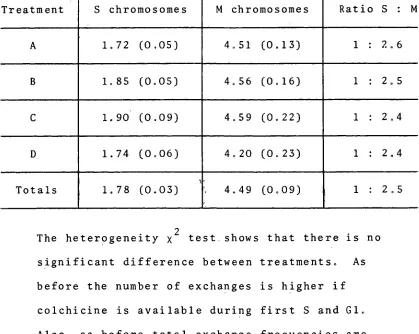
The tests show that the distributions of total exchanges per chromosome are not Poisson distributions. In both cases the distributions are under-dispersed.
29
Table 8.
Frequency of total exchanges in S chromosomes
Treatment
No. of exchanges per chromosome Total chromosomes
scored
0 1 2 3 4 5 6
A 55 223 175 81 27 13 0 574
B 32 143 130 86 21 4 1 417
C 7 40 45 24 9 0 0 125
D 21 131 108 49 14 2 1 326
Total 115 537 458 240 71 19 2 1442
Between treatments x2
Table 9.
Frequency of total exchanges in M chromosomes
Treatment
No. of exchanges.per chromosome Total chomosomes
scored 0 1 2 3 4 5 6 7 8 910
A 1 8 13 35 34 38 26 19 5 3 0 182 B 0 4 6 20 26 25 17 8 3 1 1 111 C 00 2 20 11 11 9 4 1 3 0 61 D 0 3 61914 9 7 5 1 1 1 • 66 Total 1 15 27 94 85 83 59' 36 10 8 2 420 N.B. Replicates from treatment A were heterogeneous
2
Between treatments X d f 14.27 0.70> P> 0.50 15 ..
2
[image:41.536.88.494.76.655.2]31
Table 10.
Mean number of exchanges per chromosome (including standard errors in brackets)
Treatment S chromosomes M chromosomes Ratio S : M
A 1.72 (0.05) 4.51 (0.13) 1 : 2.6
B 1.85 (0.05) 4.56 (0.16) 1 : 2.5
C 1.90 (0.09) 4.59 (0.22) 1 : 2.4
1.74 (0.06) 4.20 (0.23) 1 : 2.4
Totals 1.78
,
(0.03) 4.49 (0.09) . 1 : 2.5
[image:42.535.72.491.157.491.2]S chromosomes. Distribution in total exchange categories, fitted by Poisson
Number of exchanges per chromosome Total
number of X2 d.f. P 0 1 2 3 4 ..5 chromosomes
All
treatments
Data 115 537 458 240 71 21 1,442
[image:43.723.58.646.116.306.2]Table 12.
M chromosomes. Distribution in total exchange categories, fitted by Poisson
Number of exchanges per chromosome Number of chromo-
somes
2
X df .. P 0 1 2 3 4 5 6 7 8 9 10
All
treatments Data Poisson
1 4.7
15 21.0
27 47.2
94 70.9
85 79.7
83 71.7
59 53.8
36 34.6
10 19.5
8 9.7
2 7.2
420
d. Classes of isolabelling
Chromosomes with isolabelling can be classified depending on whether they have terminal, complete or intercalary isolabelling. Metacentrk chromosomes in particular, were observed with up to three regions of
35
Table 13.
Frequency of classes of isolabelling on isolabelled S chromosomes
Treatment Complete Terminal Intercalary Total
Chromosomes with isolabellin
A 34 184 51 269 250
B 14 140 45 199 189
C 5 35 18 58 54
D 12 96 31 139 135
Totals 65 455 145 665 628
Between treatments X2
[image:46.535.92.503.378.593.2]6 d.f. 7.94 0.30> P> 0.20
Table 14.
Frequency of classes of isolabelling on isolabelled M chromosomes
Treatment Complete Terminal Intercalary Total
Chromosomes with isolabelling
A 4 87 91 182 126
B 2 57 62 121 85
C 0 27 32 59 45
D 0 28 32 60 44
Totals 6 199 217 422 300
Between treatments X 2
3 c.f. 2.57 0.50> P>0.30
N.B. Completely isolabelled M chromosomes were included with
terminals for X2 analysis. The contingency test indicates that
e. Single and twin sister chromatid exchanges
Where 3 or 4 metacentric chomosomes were available for scoring in one tetraploid cell, sister chromosomes were paired on the basis of their label distribution patterns, in some cases assisted by their exchange
distribution patterns. Sister chromatid exchanges were then scored as twins (an exchange at the same place in both sister chromosomes) or singles. Results are given for those chromosome pairs where it was considered sisters were unequivocaly chosen and for those where this was
possibly ambiguous (Table 15). Table 15.
Frequency of single and twin sister chromatid exchanges in M chromosome pairs of tetraploid cells
Treatment
Unequivocal pairs Ambiguous pairs Single
exchanges
Twin exchanges
Single exchanges
Twin exchanges
A 101 48 69 32
B 59 34 30 17
C 18 9 10 9
Total 178 91 109 58
2
d f
X 2 .. 0.47 0.80>P>0.70 2.38 0.50>P>0.30 Number of
chromosome pairs
37
Correction for "false" twins
Since there is a relatively high frequency of sister chromatid exchanges per M chromosome it is probable that "false" twins will be scored. For a true sister
chromosome pair these would result from two single exchanges occurring at the second division in similar regions of both chromosomes.
To obtain an estimate of this error, "false" twins and singles were scored in diploid second division cells. In such cells the two M chromosomes are non-sisters in origin i.e. no true twins are possible. An analysis of 77 , pairs of M chromosomes in diploid cells gave 197 single
exchanges and 30 "false" twin exchanges (a ratio of
6.57 : 1). Therefore of a total of 257 exchanges, 60 have been mis-scored as twin exchanges. This data can be used
to obtain new estimates of single and twin exchanges. If x and y are the frequency of "false" twin and single exchanges respectively, then the error due to
2x
"false" twins will be equal to
2x-T- Paired non-sister M
chromosomes will give "false" twins from three origins ( 1 ) Paired first division exchanges
(ii) A first division exchange in one chromosome paired with a second division exchange in the other.
38
If p is the probability of occurrence of a sister chromatid exchange at the first division and p' the probability of an exchange at the second division, then the above events will correspond to p2, 2 p p' and (p') 2
respectively.
Mann and Prescott (1964) and Brewen and Peacock (in press) have shown that the probability of an exchange at the first division is equal to the probability of an
exchange at the second division. Therefore p = p' and the above events will occur in the ratio 0.25 : 0.50 : 0.25 respectively.
( 2 x)
The error term --- will apply if all pairs of M
(2x+y)
chromosomes in tetraploid cells are chosen incorrectly. However if all pairs are chosen correctly then only (p')2
events can contribute "false" twins. In this case the
1 ( 2 x)
correction factor will be equal to
4 (2x+y) and will be
applicable to the data from unequivocal pairs in Table 15. If chromosome pairs are chosen at random then the correction factor will be 2 ( 2 x) + 1 [1 ( 2 x) ] which is
3 (2x+y) 3 4 (2x+y)
3 ( 2 x)
equal to
-2x+y)' and will be applicable to the data from
4 (
ambiguous pairs in Table 15.
The correction factor is applied to the data from tetraploid cells in the following fashion.
If n is the observed number of single exchanges then
39
n ( )
- C.F. where C.F. is the appropriate correction
/
factor. Thus if t were the observed number of twin exchanges, the adjusted number T would be equal to t (N - n).
2
1 2x
Minimum correction factor =
4 (2 x y) = 0.06
3 2x
Maximum correction factor =
4 (2 x y) = 0.17
Actual and adjusted data are presented in Table 16.
All adjustments will be an overestimate of the true situation since as well as second division exchanges being paired as "false" twin exchanges they will also remove true twins. A second division exchange occurring at the same region as a first division exchange will remove a true twin and result in a single exchange. Therefore if the loss of true twins from superimposed second division exchanges is ignored the corrections used will be the maximum applicable. Even the application of this maximum correction to the total data does not result in a
Frequencies of single and twin sister chromatid exchanges in paired M chromosomes from tetraploid cells
Single exchanges
Twin
exchanges Ratio
2
X 1 d.f. P
Unequivocal pairs
actual 178 91 1.96 : 1 0.04 0.90 - 0.80
adjusted 189 85.5 2.21 : 1 0.55 0.50 - 0.30
Ambiguous pairs
actual 109 58 1.88 : 1 0.14 0.80 - 0.70
adjusted 132 46.5 2.88 : 1 4.26 0.05 - 0.02
Total pairs
actual 287 149 1.93 : 1 0.17 0.70 - 0.50
41
f. Single and twin isolabelling segments
Isolabelling was scored as segments; being either twin or single segments on sister M chromosome pairs. The data obtained is given in Table 17 combined from
unequivocal and ambiguous pairs. Table 17.
Frequencies of single and twin isolabel segments in M chromosomes of tetraploid cells
Treatment Single segments Twin segments
A 88 38
B 88 36
C 41 8
Total 217 82
Between treatments x2
2 d.f. 3.67 0.20>P>0.10
Data from 179 pairs of M chromosomes; giving a ratio of 2.65 : 1. An estimate of "false" twin isolabel segments was also made. Analysis of 30 pairs of non-sister M chromosome pairs from diploid cells gave 47 single and 9 "false" twin isolabel segments i.e. a ratio of 5.22 : 1. Since the method of scoring tended to overestimate
Position of sister chromatid exchanges on S chromosomes
[image:53.533.50.499.82.696.2]In order to determine if exchanges were localised to broad equal regions of the S chromosomes, exchanges were scored as being proximal, distal or median with regard to the centromere from 2 samples of S chromosomes.
Table 18.
Position of sister chromatid exchange in S chromosomes
All
chromosomes
Proximal Median Distal 2
X 2 d. if. P
85 106 99 2.36 0.50 - 0.30 Chromosomes
with one exchange
95 144 125 10.17 <0.01
h. Centromere "exchanges" in M chromosomes
Apparent exchanges at the centromere can arise from twisting at the centromere. The centromere regions of M chromosomes are frequently seen stretched or possibly broken. A sample of M chromosomes without isolabelling where exchanges or apparent exchanges could be scored without this complication was therefore selected. From 56 M chromosomes with a mean frequency of non-centromere
43
Therefore of a total of 229 exchanges, 8.3% were found at the centromere.
Although the centromere regions of many M chromosomes analysed for single and twin exchanges were unlabelled, of those that were adequately labelled 16 single and 9 twin "exchanges" were seen.
Discussion
Throughout this report the term "sister . chromatid exchange" as used by Taylor (1958) has implied that the cross-over labelling patterns found on sister chromatids of second division chromosomes have resulted from an actual exchange of chromatid segments. This has been accepted by subsequent workers e.g. Peacock (1963) and Mann and Prescott (1964).
• However Stahl (1964) has pointed out a possible
sub-units mimics chromatid exchange with non-identity of sub-units. Thus an independent demonstration of chromatid exchange is needed, but seems to be lacking at this time"
(Stahl, 1964 p.80).
Peacock and Brewen (in manuscript) have provided this demonstration by scoring the distribution of labelled
segments of third division endoreduplicated chromosomes in Chinese Hamster cells. This method enabled them to
distinguish between the Stahl and Taylor hypothesis. They concluded that sister chromatid exchanges are the visible result of a physical exchange of sister chromatid segments.
Sister chromatid exchanges
a. Frequency of exchanges
As can be seen from Table 19, sister chromatid
exchanges have been observed in a wide range of organisms, and it is obvious that the frequency of exchanges per
chromosome varies considerably from organism to organism. Taylor (1958) observed that in Bellevalia romana the
frequency of exchanges was nearly proportional to
chromosome length. The present study also shows close
45 Table 19.
Sister chromatid exchange frequencies in a number of organisms
Organism Chromosome class Number of chromosomes scored Mean sister chromatid exchangesPer chromosome Ratio of chromosome lengths Ratio of S.C.E. ° per chromosome
Author
Bellevalia I (large
2.0719112 metacentric) 72 1.21 1.0 1.0 Taylor (1958) II (medium
subtelocentric) 52 0.74 0.8 0.6 III, IV (small
metacentrics) 80 0.84 0.7 0.7
'Mi.= cepa Approximately
equal long 112 0.91 Zweidler
(1964) chromosomes
Chinese I (largest hamster
cell line
metacentric) 335 0.74 Mario and
Prescott
CHEF-125 overall 1061 0.28 (1964)
Potoroue tridmotylis (marsupial cell line) large group small group 156 64 0.54 0.13 Walen (1965)
Human Group A 0.41
P ooPPP "' •• ■ CO 0 Herreros and
leucocyte' B 0.32 Gianelli
C 0.30 (1967)
D 0.21
E 0.09
1, 0.04
G 0.05
Geniaea I (large
australaeiae autosomes) 180 1.14 0.9 0.8 Peacock (1968)
(Orthoptera; Acrididae) meiotic II (medium autosomes) X (largest
335 0.82 0.6 0.6
chromsomes chromosome) . 32 1.45 1.0 1.0 Vioia /him" S
subtelocentric 776 0.73 1.0 1.0 Peacock (1963) M
' metacentric 144 1.29 2.4 1.8
Vicia faba
(var Coles
S 814 1.64 1.0 1.0 (this study)
Dwarf M 120 4.05 2.4 2.5
Prolific)**
* estimated from Tjio and Puck (1958).
however trends are consistent throughout (see Appendix II). The reason for these discrepancies is unknown. The
constancy between experiments in this study (which were carried out in two different laboratories) is good.
b. Effect of colchicine
Taylor (1959) reported a significant effect of time of availability of colchicine on exchange frequency in
Bellevalia romana. Peacock (1963) reported that
colchicine did not effect exchanges in Vicia faba. These results show that there may be a slight colchicine effect, in that, when colchicine is provided before and during
label sister chromatid exchanges are slightly increased
(contra Taylor, 1959). Table 3 shows that for S
chromosomes there is a significant difference between treatments; however the results overall (Tables 3, 4 and 5) indicate little effect (if any) in Vicia in contrast to that in Bellevalia.
(The results of Peacock (1963) with isolabelled chromosomes removed from the analysis are reported in Appendix II.)
c. Exchange distribution
47
distribution of exchanges for M chromosomes is considered in Table 7, while S chromosomes are considered for each treatment separately, since there is a significant
difference between treatments. Two of the four
distributions for the Sichromosomes deviate significantly from a Poissonian form. The variance/mean ratios given, in Appendix I for individual distributions indicate an under-dispersion of data.
The deviations from the Poisson could be interpreted as meaning that the occurrence of a sister chromatid
exchange reduces the prospect of a further exchange.
Alternatively a non-random distribution of exchanges along the length of the chromosomes could be responsible for the deviations from the Poisson form. However observations of the approximate positions of sister chromatid exchanges along the length of S chromosomes (Table 18) do not support the possibility of non-random exchange
distributions. Where S chromosomes have one sister chromatid exchange there is a tendency for this not to occur proximal to the centromere.
Poisson distribution. If the explanation is accepted exchange events are independent.
Single to twin sister chromatid exchange ratios
Peacock and Brewen (in manuscript) have shown that sister chromatid exchanges involve the physical exchange of chromatid segments. However given this mode of origin a number of hypotheses giving expectations of the ratio of singles to twins can be formulated.
Taylor (1958) considered that sister chromatid
exchanges were spontaneous sister strand cross-overs and derived his expectations accordingly. He realised (Taylor, 1959) that exchanges could be due to endogenous radiation from the incorporated tritium, however he rejected this possibility in the case of Bellevalia since he found that
exchanges were influenced by colchicine; the higher frequency of exchange in the first interphase not
persisting in all experiments. Wolff (1964) pointed out that the ratio originally found by Taylor (1958) i.e. 0.37 : 1, was compatible with that to be expected if
exchanges were radiation induced and followed dose square kinetics. He contended that if colchicine could be
49
Brewen and Peacock (in press) have provided some
support for Wolff's contention that exchanges are
radiation induced, since they found that tritiated
thymidine induces sister chromatid exchange in a human
ring chromosome.
Radiation induced exchanges could follow either
linear (one hit) or dose square (two hit) kinetics. A
summary of single : twin expectations for these various
[image:60.532.77.492.318.532.2]possibilities is given in Table 20.
Table 20.
Expectations of single to twin sister chromatid exchange ratios
Exchanges occurring independent of
H3 thymidine dose
Exchanges induced by
tritium radiation; following dose square kinetics
Exchanges induced by
tritium radiation; following linear kinetics
Sub-units rejoining non-randomly
(= polarity)
2 : 1 1 : 2 1 : 1
Sub-units rejoining at random
(= non-polarity)
The ratios that Taylor (1959) obtained varied with colchicine treatment from approximately 1 : 2, through 1 : 1, to 2 :1. Since these ratios constituted a significant departure from a 10 : 1 ratio Taylor (1959 p.70) concluded: "The two strands of a chromosome or a chromatid are structurally different in a way that
prevents re-union of unlike strands". In contrast to this study, in his original experiments Taylor (1958) found no twin exchanges (i.e. "false" twins) in diploid second division cells. Hence any correction that could be applied to the data would result in little change, and demonstrates the confidence with which sister chromosome pairs were chosen.
Therefore Taylor provided a further parallel between the behaviour of chromatid sub-units and the DNA double helix;, from the demonstration of semi-conservative
segregation of DNA at the chromosomal level (Taylor et al 1957).
Obviously this point is of considerable importance in drawing inferences about chromosome structure. The
relative paucity of Taylor's (1959) data and the
51
Other data bearing on single : twin exchange ratios is that of Walen (1965) and Herreros and Gianelli (1967). A note giving ratios but no data has been presented by Sparvoli, Gay and Kaufmann (1966).
Walen (1965) examined sister chromatid exchanges in endoreduplicated cells of
Potorous tridactylis.
In such cells homologous chromosomes occur in pairs so there is no ambiguity in selecting sister pairs. She found 63 single exchanges and 15 twin exchanges on 55 chromosome pairs, i.e. 4.2 : 1. In a partial breakdown of the results obtained, Walen (1965, Fig. 10, p.923) records exchanges occurring at the centromere or elsewhere along the length of the chromosome from 41 of the original 55 chromosome pairs. From this table it is obvious that exchanges atthe centromere (particularly single exchanges) occur in a disproportionately higher frequency (>20%) than would be expected if exchanges were randomly distributed along the chromosomes. Twisting at the centromere can mimic an
exchange, however Walen (1965 p.926) states: "the lack of flexures at the centromere in this material, implying a relatively rigid continuity, implies that erroneous
classification from this source has probably contributed little to the observed results."
and twin exchanges. Table 21 presents their data
[image:63.531.69.478.86.519.2]separately for centromere and non-centromere exchanges. Table 21.
Data from Herreros and Gianelli (1967)
Single exchanges
Twin
exchanges Ratio Centromere
exchanges 191 55 3.5 : 1
Non-centromere
exchanges 288 128 2.2 : 1
Total 479 183 2.6 : 1
2
5.46 0.02>P>0.01 X1 d.f.
This contingency analysis shows that a significantly different ratio is obtained for exchanges at the centromere, precluding bulking the data to obtain a
definitive final ratio. An examination of exchange events shows that the mean frequency (over chromosome groups) of exchanges at the centromere is 38%, which implies a non-random distribution of exchanges along the chromosome (and varies from 26 to 62% between groups) with exchanges
localised at the centromere. However as stated previously twisting at the centromere can mimic an exchange therefore actual exchanges at the centromere cannot be ascertained. The unknown reason for the high frequency of centromere
53
and Gianelli (1967) negate to some extent the influence of these data in a consideration of the organisation of
chromosomal sub-units.
Mann and Prescott (1964) examined third division metaphases in a Chinese hamster cell line and found that, "one fifth of all second cycle exchanges scored in third division metaphases took place at the centromere" (p.166) in chromosome I (the largest metacentric). Centromere exchanges were not scored in second division exchanges since they could have arisen by twists at the centromere. This is unfortunate since it would have provided an
estimate of centromere twisting in these comparatively large chromosomes. Cuevas-Sosa (1967) examined colchicine anaphase chromosomes of human lymphocytes and a neoplastic cell line for exchanges at the centromere. Therefore
chromatids were separated at the centromere reducing considerably the prospect of an influence of centromere twisting. Although reporting sister chromatid exchanges, their frequencies are not recorded, therefore there is no sound basis for comparison with his finding of 48
centromere exchanges in 2300 lymphocyte chromosomes (50 cells) and 49 centromere exchanges in 3750 neoplastic cell line chromosomes (estimated because chromosome
(p.339) at the centromere does not however indicate that the frequency of exchanges at the centromere was
considerable in relation to those along the remainder of the chromosomes.
Sparvoli, Gay and Kaufmann (1966) analysed third division prophase chromosomes of Haplopappus gracilis and found a ratio of single to twin exchanges of 10 : 1 (no data given therefore possible influences of colchicine and/or centromere exchanges cannot be assessed).
The frequency of "false" twin exchanges will be influenced by exchange frequency per chromosome which is itself proportional to chromosome length. However the removal of true twins by superimposed second division exchanges could possibly negate this effect of "false" twins to an unknown extent.
Experiments to date have produced single to twin sister chromatid exchange ratios ranging from 1 single to 2 twins; to 10 singles to 1 twin, providing no clear
support for any one ratio given in Table 20.
Single and twin sister chromatid exchanges in Vicia faba
The contingency analyses show that colchicine has no influence on the frequency of single and twin exchanges and also there is no difference between the two sets of data (x2
55
correction factor to the data from Table 15 gives a final ratio of 321 single exchanges to 132 twin exchanges (Table 16) i.e. a ratio of 2.43 : 1, which is not significantly different from a 2 : 1 ratio (x 2 1 d.f. 3.50 , 0.10>P>0.05). If a higher frequency, than expected from random
selection, of "ambiguous" chromosome pairs were true sister pairs, as seems likely by the closeness of the
ratio for unequivocal and ambiguous chromosome pairs, then the final adjusted ratio would be closer to 2 : 1 than that obtained. This is reinforced by the fact that the ratio obtained from ambiguous pairs deviated from the "false" twin ratio (6.57 : 1) more than would be expected if selection had been at random. Therefore in Vicia faba
sister chromatid exchanges occur independently of tritium dose and sub-units are dissimilar and exhibit polarity. This conclusion is compatible with part of the data of Taylor (1959) and part of that of Herreros and Gianelli
(1967). Taylor's results were complicated by the effect of colchicine, which does not influence Vicia data, while that of Herreros and Gianelli (1967) was complicated by the different ratios obtained for centromere single and twin exchanges. In Vicia results indicate that the centromere is not a region with a preponderance of exchanges, (in M chromosome); while although data is
different single : twin ratio at the centromere from that obtained. Frequently the M chromosomes used for scoring single and twin exchanges were not labelled at the
centromere, indicating it is one of the later regions to be replicated (Evans, 1964).
The data obtained is therefore compatible with the conclusion that the two chromosome replication sub-units are not identical, in an analagous manner to the two chains of the DNA molecule.
Isolabelling
La Cour and Pelc (1958) were the first to report isolabelling at the second division in Vicia faba.
Peacock (1963) carried out an extensive investigation of labelling on Vicia chromosomes and reported up to 33% and 22% isolabelling of M and S chromosomes, respectively. Iordanskii (1964) also reported isolabelling in Vicia.
Taylor (1958) found a few cases of isolabelling in
BeZZevaZia romana; as did Walen (1965) in Potorous tridactylis, Gay (1965) in Vicia, Crepis, Allium and
HapZopappus and Cuevas Sosa (1967) in human leucocytes.
57
This study reports a high frequency of isolabelling, showing an increased incidence with increased chromosome length and/or sister chromatid exchange frequency.
Neither the frequency of isolabelling nor the type of isolabelling were influenced by time of application of colchicine (Tables 1, 2, 13 and 14), in agreement with Peacock (1963).
Peacock (1963) considers four possible origins of isolabelling.
(i) Residual isotope incorporation
Evens (1964) has shown that in Vicia root tips a supply of H3 thymidine is not found a few minutes after removal of the isotope. He showed that the use of a cold thymidine chase extended the period of availability of isotope. A chase was used by Peacock (1963) but not in the present experiments.
(ii Interchromosomal exchange
Taylor (1962) suggested that exchanges between the four chromatids of adjacent homologous chromosomes might result in isolabelling. Wolff (1964) also put forward this possibility. Such exchanges would result in "iso-unlabelled" segments on one homologue. Since twin isolabelling has been observed in
observed in high frequencies (contra Wolff's 1964 expectation).
(iii) Multiple exchanges
The location of grains in relation to the point of origin of the 6 ray from H 3 decay is at times
imprecise, in that grains may not lie directly over the region of origin (Perry 1965). Hence grains may appear opposite each other on different chromatids following an exchange event. Multiple exchanges in a region will enhance this grain scatter, so
isolabelling could therefore be scored. In order to obtain a uniform basis of scoring, chromosome
labelling patterns were drawn and scored as they actually appeared. No attempt was made to see if grain overlap was a consequence of a sister
59
(iv) Polyneme structure
If the chromosome were composed of more than one lateral strand of DNA, both segregational and iso-labelling could be obtained at the second division, i.e. there is a lateral multiplicity of DNA per chromatid.
Peacock (1963, 1965) puts forward models demonstrating segregation of multi-stranded
chromosomes and explains isolabelling on the basis of lateral multiplicity of Vicia chromosomes.
Taylor (1966) has presented a model of chromosome duplication which is adaptable to either a single or a multi-stranded chromatid.
Although the incidence of isolabelling increases with chromosome length (as do sister chromatid exchanges) the scoring of isolabelling in terms of exchange events
introduces considerable heterogeneity in the replicate experiments of treatment A (see Appendix I), and also results in considerable departure of exchange
The relatively high frequency of "false" twin isolabel • segments and the uncertainty with regard to actual
isolabel segments make the computation of decisive ratios meaningless.
Also it may be incorrect to equate isolabel events with exchange events. Therefore apart from stating that a high incidence of isolabelling has been found on second division chromosomes, that incidence increases with chromosome length and/or exchange frequency, and that isolabelling can occur in twin and single segments, this study is unable to provide any information which could confirm or deny Peacock's (1963) explanation of
61
REFERENCES
,Anderson, R.L. and T.A. Bancroft, 1952. Statistical Theory in Research. McGraw-Hill: New York,, Brewen, J.G. and W.J. Peacock, 1958. The effect of
tritiated thymidine on sister chromatic exchange in a ring chromosome. (In press).
Busch, H., W.C. Starbuck, E.J. Singh and Jae Suk Lo, 1964. Chromosomal proteins. In, The role of chromosomes in development, Ed. M. Locke : 51-71. Academic Press, New York.
Cuevas-Sosa, A., 1967. Crossing-over and the centromere. Cytogenetics 6: 331-341.
Darlington, C.D., 1947. Nucleic acid and the chromosomes. Symp. Soc. Exp. Biol. 1: 254-269.
1960. Chromosomes and the theory of heredity.. Nature. 187 : 892-895.
Evans, J.H., 1964. Uptake of H 3 thymidine and patterns of DNA replication in nuclei and chromosomes of Vicia
faba. Exptl. Cell Res. 35 : 381-393.
Ficq, A., 1959, Autoradiography. In, The Cell, Eds,
J. Brachet and A.E. Mirsky 1 : 67-90. Academic Press, New York.
Filner, P., 1965. Semi-conservative replication of DNA in a higher plant cell. Exptl. Cell Res. 39 : 33-39. Gay, H., 1965. Organisation of chromosomes in higher
forms. Carnegie Inst. Wash, Year Book 64 : 539-554. 1966. Chromosome organisation in Eucaryotes.
Carnegie Inst. Wash. Year Book 65 : 581-584.
Haut, W.F. and J.H. Taylor, 1967. Studies of bromouracil deoxyriboside substitution in DNA of bean roots