.-.
I J
,
'1
Flowering and seed production in Eucalyptus nitens
by
Dean Ronald Williams B.App.Sc. (Hons)
Submitted in fulfilment of the requirements for the degree of Doctor of Philosophy
University of Tasmania April 2000
Declarations
This thesis does not contain any material which has been accepted for a degree or diploma by the University of Tasmania or any other institution. To the best of my knowledge and belief this thesis contains no material previously published or written by another person except where due acknowledgment is made in the text of the thesis.
Dean R. Williams
This thesis is not to be made available for loan or copying for two years following the date this statement was signed. Following that time the thesis may be made available for loan and limited copying in accordance with the Copyright Act 1968.
Abstract
This project examined silvicultural and environment factors which affect precocious and abundant flowering in trees of the economically important plantation species Eucalyptus nitens with the aim of optimising seed production.
iii
Two separate studies were undertaken to examine how flowering and seed quality were affected by the macroenvironment. The first studied an altitudinal gradient which would span the range where operational seed orchards might be located. Flowering abundance and seed production was greatest on sites where growth rate was highest. Seed weight, germination success and germination rate decreased as site altitude increased. The second study examined the effects of water availability. Flowering abundance was highest in trees experiencing water stress, whilst seed quality remained unaffected by parental water status. Overall, the maternal tree had a greater influence on seed quality traits than the environmental effects studied.
On the microenvironmental scale, the effect of tree spacing on flower abundance and capsule survival was studied at two sites where trees were 5 and 13 years old. As the spacing between trees increased so too did reproductive yield, not only per tree but also per hectare. Furthermore, it appears that as trees mature, tree density needs to be decreased to maintain the maximum reproductive yield per hectare.
To overcome the strong genetic control of flowering precocity a hormone manipulation approach was tested. The gibberellin biosynthesis inhibitors paclobutrazol, chlormequat chloride and prohexadione were applied to seedlings and their relative effects compared. These treatments reduced both growth rate and endogenous levels of GA1 to varying degrees, with paclobutrazol the most effective. However, none of the treatments promoted precocious flowering. Further environmental and/or chemical manipulation would be required to induce precocious flowering in E. nitens seedlings.
The application of nitrogen fertiliser to juvenile trees stimulated precocious and abundant flowering. This was due in part to accelerated growth rate but nitrogen also acted independently of growth rate. In contrast, phosphorus had no effect on growth or reproductive output but did cause trees to undertake vegetative phase change earlier. Nitrogen fertiliser combined with hormone manipulation with paclobutrazol was applied to juvenile and mature plantation grown trees to promote precocious and abundant flowering. There was an additive effect in combining the treatments in promoting both precocious and abundant flowering.
The production of pedigree seed traditionally required three visits to the mother tree to carry out controlled pollination. To improve the efficiency of this process, a number of novel controlled pollination procedures were tested on both E. nitens and E. globulus. A new single visit pollination protocol for E. globulus was successfully developed, whilst the techniques applied to E. nitens yielded no advantage over the traditional method. This new protocol for E. globulus is expected to reduce the cost of pedigreed seed production by more than half.
Acknowledgments
I would firstly like to thank my supervisors, Brad Potts and Jim Reid for their tireless enthusiasm and support for this project.
I thank the Cooperative Research Centre for Temperate Hardwood Forestry for the scholarship and the partner companies and organisations for supplying the much needed help, resources and support which made this project possible.
More specifically I thank: Percy Badkin of Baral;
Chris Beadle, Dale Worledge, Phillip Smethurst, Anne LaSala of the CSIRO Division of Forestry and Forest Products;
Sandra Hetherington of Fletcher Challenge Paper; Peter Kube and Bill Neilsen of Forestry Tasmania;
Kelsey Joyce, Mike Powell, Wayne Tibbits of North Forest Products; Peter Gore of Southern Tree Breeding Association Inc;
Shone Batge, Paul Black, Ian Cummings, Neil Davidson, Noel Davies, Greg Dutkowski, Tracy Jackson, Gaye Johnson, Andrew McDonald, Alex Mitchell, John Ross and Paul Tilyard of the University of Tasmania.
Thanks goes to Chris Browne and Hutch of Osleach who kept my tongue from hanging out.
Thanks to Mum and Dad who were always there for me through my extensive scholastic career.
v
Table of Contents
Declarations ... ! . . . • . . . ii
Abstract ... iii
Acknowledgm.ents ... ... iv
Table of Contents ... v
Format of Presented Chapters ... viii
Chapter 1: Introduction ... _ .... 1
Chapter 2: Macroenvironmental effects on flowering and seed production ... 6
2.1 Introduction ... 6
2.2 Methods and Materials ... 9
2.2.1 The effect of water stress on flowering and seed production ... 9 v •• 2.2.1.1 Site description ... 9
I,.
2.2.1.2 Flowering phenology ...l'.t-2.2.1.3 Seed collection ... -... 13
2.2.1.4 Seed germination ... 14
2.2.1.5 Statistical analysis ... 15
2.2.2 The effect of altitude on flowering and seed production ... 19
2.2.2. l Site description ... : ... 19
2.2.2.2 Growth measurements ... 21
2.2.2.3 Flowering phenology ... 21
2.2.2.4 Seed collection ... 22
2.2.2.5 Seed germination ... 23 ·
2.2.2.6 Statistical analysis ... 23\
2.3 Results ... 24{
2.3.l The effect of water stress on flowering and seed production ... 24
2.3.1.1 Flowering phenology and growth ... 24
2.3.1.2 Seed quality ... 28
2.3.2 The effect of altitude on flowering and seed production ... 32
2.3.2.1 Flowering phenology and growth ... 32
2.3.2.2 Seed quality ... 37
2.4 Discussion ... 44
Chapter 3: The effect of tree spacing on the production of flowers and capsules ... 5 4 3.1 Introduction ... 54
3.2 Methods and Materials ... 57
3.2.1 Study sites ... 57
3.2.2 Flowering and capsule survey ... 58
3 .2.3 Trial measurement. ... 60
3.2.4 Statistical analysis ... 60
3.3 Results ... 62
Chapter 4: Response of Eucalyptus nitens seedlings to gibberellin
biosynthesis inhibitors ... 7 9
4.1 Introduction ... 79
4.2 Methods and Materials ... 81
4.2.1 Plant material ... -... 81
4.2.2 PGR application ... 82
4.2.3 Gibberellin analysis ... _ ... 83
4.2.4 Statistical analysis ... 84
4.3 Results and Discussion ... 85
Chapter 5: The effect of fertiliser and paclobutrazol on flowering precocity and abundance . ... 8 9 5.1 Introduction ... 89
5.2 Methods and Materials ... 92
5.2.1 Fertilisation with nitrogen and phosphorus ... -... -... 92
5.2.1.1 Site description ... 92
5 .2.1.2 Trial assessment ... 93
5.2.1.3 Statistical analysis ... 94
5 .2.2 Fertilisation with nitrogen and co-application of paclobutrazol ... 97
5.2.2.1 The effect on flower initiation and abundance in juvenile
( <
4 years old) trees ... : ... 975.2.2.2 The effect on flower initiation and abundance in adult (> 4 years old) trees ... 100
5.3 Results ... 101
5.3.1 Fertilisation with nitrogen and phosphorus ... 101
5.3.1.1 The effect on the first two seasons of flower bud production (reproductive maturity) ... 101
5.3.1.2 Vegetative phase change (vegetative maturity) ... 106
5.3.2 Fertilisation with nitrogen and co-application of paclobutrazol. ... 111
5.3.2.1 The effect on flower initiation and abundance in juvenile ( < 4 years old) trees ... · ... : 111
5.3.2.2 The effect on flower initiation and abundance in adult (> 4 years old) trees ...•... 117
5.4 Discussion ... 124
Chapter 6: Testing single visit pollination procedures for Eucalyptus globulus and E. nitens ... . 132
6.1 Introduction ... 132
6.2 Methods and Materials ... 135
6.2.1 Effect of style treatments in E. globulus and E. nitens ... 135
6.2.1.1 Genetic material. ... 135
6.2.1.2 Crossing methods ... 135
6.2.1.3 Seed collection and testing ... 137
. 6.2.1.4 Statistical analysis ... 138
6.2.2 Testing a single visit pollination protocol ... 139
6.2.2.1 Genetic material. ... 139
6.2.2.2 Crossing method ... 139
6.2.2.3 Seed collection and testing ... 141
6.2.2.4 Statistical analysis ... 142
6.3 Results and Discussion ... 142
6.3.1 Effect of style treatments ... 142
vii
Chapter 7: Discussion . ... " ... ·~ ... 15 2 Conclusions ... 15 8
References ... . 16 0
The format of presented chapters
Two of the chapters of this thesis have been published as scientific papers in refereed journals. The structure of these papers has been retained within the thesis with minor
changes to maintain the flow and coherence with the accompanying chapters. These
changes include: ·
• the removal of abstracts, summaries and general introductory statements,
• the general acknowledgments and bibliographies have been amalgamated with those of the unpublished chapters of the thesis,
• the addition of chapter numbers to tables and figures.
Each chapter represents a discrete investigation and can stand alone as a report of scientific research.
The refereed publications from this thesis are:
Williams, D.R., Ross, J.J., Reid, J.B. and Potts, B.M. (1999), Response of Eucalyptus
nitens seedlings to gibberellin biosynthesis inhibitors. Plant Growth Regulation
27: 125-129.
Chapter 1: Introduction 1
Chapter 1
Introduction
The forest plantation estate in Australia is poised to treble by the year 2020 through planting an average of 80,000 hectares per year (2020 Vision; Anon 1999). The 2020 Vision for Australian plantation forestry aims to reverse the current $1.5 billion trade
deficit for forest products and create up to 40,000 jobs in rural areas. This dramatic increase in the plantation estate is driven by economic considerations and political pressure to move production out of native forests and the need to counter greenhouse gas
production (Borough et al. 1998).
Eucalypt plantations will be a major means of achieving the 2020 Vision target due to the high demand for eucalypt pulp for paper production. The profitability of these plantations will to a large extent depend upon the quality of genetic stock and the initial costs of plantation establishment. The cost of the planting stock is incurred at the beginning of the plantation and must be discounted over a 20 year rotation. Clonal propagation of
always in short supply. High demand and continued selection of superior genotypes means seed orchards play a critical role in the future productivity of the forest industry.
Eucalyptus globulus and E. nitens are the main temperate hardwood plantation eucalypts in Australia (Tibbits 1997) and E. nitens is particularly suitable for plantations in frost-prone regions. In Australia, the total plantation area of E. nitens in 1995 was approximately 46,000 hectares and this is projected to increase to about 66,000 hectares (or by about 45%) by 2000 (Tibbits 1997). Eucalyptus nitens appears to be the more problematic of
the two temperate eucalypts with respect to flowering and seed production and is the focus of this thesis.
Flowering in E. nitens is subject to the vagaries of the environment in which it grows. In natural stands good flower crops occur infrequently, as little as once every 4 years
(Moncur 1998). When trees are taken out of their natural range for domestication it can reduce this frequency further or inhibit flowering altogether as experience has shown in orchard plantings of E. nitens in South Africa (Eldridge and Griffin 1990). Where to locate an orchard is one of the most critical and irreversible decisions to be made and
necessitates sound knowledge of what are desirable environmental characteristics.
Drier environments have induced heavy flower~crops in E. viminalis (Moncur 1998) and
Chapter 1: Introduction 3
reproductive performance from flower initiation through to seed production and germination success, a picture may be obtained of what benefits or drawbacks typical environmental characteristics have on reproduction. Chapter 2 reports on such a survey where five sites were monitored and sampled over two consecutive years. Four of these sites were located in an altitudinal transect in south-eastern Tasmania where site elevation ranged from 60 m to 650 m above sea level. The fifth site was an established irrigation trial situated in a low rainfall area of south-eastern Tasmania where water availability to the
trees was strictly controlled and monitored.
Once a suitable site has been selected with all the desirable environmental characteristics for seed production one of the next important decisions is the orchard design and more specifically the spacing between trees. A good eucalypt orchard design is one which is the
best compromise between: productivity per tree which increases with wider spacing (Moncur 1998), rates of outcrossing which decrease with wider spacing (Potts and Wiltshire 1997) and resource utilisation which becomes more efficient over a smaller area
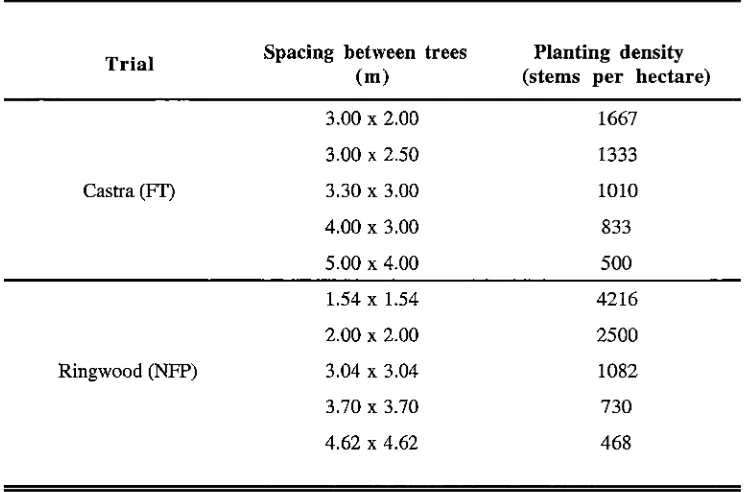
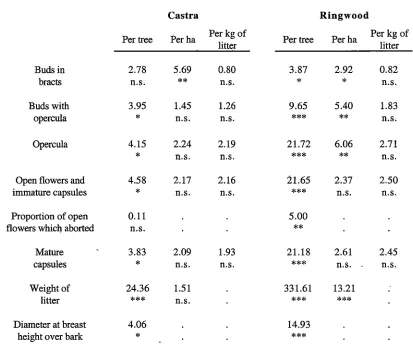
(Bouvet 1997). Despite tree spacing appearing to have important implications on whole eucalypt orchard productivity, it has been given very little attention compared to the improvement in productivity of single trees. Chapter 3 reports on a study of the effect of tree spacing on the production of flowers and capsules by ,E. nitens. This study utilised
two established spacing trials and presents the results on both a per tree basis and per
hectare basis as alternate measures of assessing productivity.
When the E. nitens orchard is established, both in the best location and with the optimal
tree spacing for seed production, the time interval until the first good crop may take from 4 to 10 years without further intervention (Moncur 1994). In the closely related E.
globulus, flower initiation has been chemically induced through application of the
and Reid 1995). Paclobutrazol is also effective in stimulating flowering in adult trees of
E. nitens (Griffin et al. 1993). However, application of paclobutrazol to juvenile E. nitens
has had no (Griffin et al. 1993) or low (Moncur 1998) rates of success. Furthermore, there are some concerns surrounding the use of paclobutrazol regarding its high levels of residual activity, the persistence of which has been detected for up to 6 years after
treatment (Hetherington and Jones 1990). There is a strong relationship between reduced levels of apical GA1 and increased flowering abundance in E. nitens (Moncur and Hasan 1994). This suggests that other gibberellin biosynthesis inhibitors with lower residual
activity might be as effective and more attractive than paclobutrazol for general use. Chapter 4 investigates the affect of applying two alternative gibberellin biosynthesis inhibitors, chlormequat chloride and prohexadione to 11 month old E. nitens seedlings on
GA levels, precocious repr9ductive development and growth and compares them to paclobutrazol.
Apart from hormonal manipulation, there are other silvicultural treatments which can promote precocious and abundant flowering in trees. Treatments to accelerate growth in conifers can reduce the time from planting to first seed crop (Chalupka.and Cecich 1997) and increase seed production (Griffin et al. 1984). Earlier and more abundant flowering in
trees of E. regnans has been achieved by accelerating growth through the application of
fertiliser (Cameron and Kube 1983). However, some environments conducive to good
growth of E. nitens result in poor flowering (Eldridge and Griffin 1990). In conifers, a
combined treatment of fertilisation and hormone manipulation has vastly improved flowering over what could be achieved if only one of the treatments was used (Daoudi et
al. 1994). Chapter 5 begins with an investigation of young E. nitens nitrogen and
Chapter 1: Introduction
combined treatment with nitrogen fertiliser and paclobutrazol on juvenile ( < 4 years old)
and mature (> 4 years old) trees, and whilst there are concerns with the use of paclobutrazol, its effectiveness cannot be disputed.
5
Once the orchard is well located, well spaced and appropriately treated with nutrients and
hormone regulators and is producing vast quantities of open pollinated seed it may well be
time to consider the next generation of selections for orchard production. The only reliable
way to produce seed of a guaranteed pedigree is through controlled pollination and this is
most critical in the production of superior genotypes. The traditional method of controlled
crossing in eucalypts requires three visits to the female tree for: (1) emasculation and
flower isolation, (2) pollination at peak stigma receptivity and (3) de-isolation of the
fertilised flower. Chapter 6 tests alternative pollination and isolation techniques which
could potentially reduce the number of visits to the flower from three to one. These
techniques are applied to both E. nitens and E. globulus and their success would mean a
significant reduction in the cost of pedigree seed production and open the way for mass
pollination.
This thesis takes a broad investigative sweep through issues affecting flowering and seed
production in E. nitens with the particular aim of improving the commercial productivity of
seed orchards. With the median price for a kilogram of cleaned E. nitens seed currently
Chapter 2
Macroenvironmental effects on flowering and seed production
2.1 INTRODUCTION
The commercial requirement of seed production is the antithesis of the natural production
system. It is highly desirable that commercial quantities of genetically improved seed be produced as abundantly, cheaply and reliably as possible soon after it is developed from breeding programs. In reality, heavy seed crops are produced infrequently (anywhere from 1-4 years), after an extended (4 to 10 years) non-reproductive juvenile phase in canopies meters off the ground which by then are difficult to access (Moncur 1994).
Long term flowering patterns of eucalypts can be asynchronous between and within years (Ashton 1975, Loneragan 1979, Griffin 1980, Yates et al. 1994, Setterfield and Williams
1996, Pook et al. 1997). Within a site there can be both heavy and light flowering of
adjacent trees in any year with uniform flowering occurring only when there is a
Chapter 2: Macroenvironmental effects on flowering and seed production 7
A number of silvicultural techniques to shorten the inter-generational period and increase flowering regularity and abundance have been tested and had varyi~g degrees of success on E. nitens. Techniques to reduce the inter-generational period by inducing precocious
flowering include treatment of seedlings with gibberellin biosynthesis inhibitors either alone (Griffin et al. 1993, Moncur 1998, Chapter 4) or with fertiliser (Chapter 5). Similar
techniques have also been used to promote regular and abundant flowering (Griffin et al.
1993, Moncur and Hasan 1994, Swain and Chiappero 1998, Chapter 5) and efforts have also included growth in espaliers (Moncur et al. 1994b ), and induction of water stress
(Moncur 1998). However, most cases have suffered from the vagaries of an
environmental component often identified as temperature (Moncur et al. 1994b, Swain and
Chiappero 1998), the significance of which was highlighted in Moncur and Hasan (1994). To overcome this, Moncur (1998) suggests grafted material in pots be moved between environments to optimise flower and seed production. However, the system would only suit small trees and is not suitable for large scale seed production. The alternative is to carefully locate the orchard in an area where the environment is favourable to seed production or one which can be manipulated favourably and cost effectively.
In a survey of 23 sites across Tasmania with altitudes ranging from 40 to 720 metres above sea level (masl), Moncur et al. (1994a) identified site characteristics which seemed
to favour greater flower and seed production. These desirable sites were generally warmer with a drier winter and promoted a longer flowering period. This survey was carried out over 2 consecutive flowering years, the second year having a higher proportion of trees
There has been considerable study done on maternal environment effects on seed quality and progeny performance in many species (Roach & Wulff 1987), including gymnosperm forest tree species (Skr!Zippa 1994, Andersson 1994, Lindgren and Wei 1994, Johnsen et
al. 1995, Schmidtling 1996). The maternal environment can not only affect the number
and size of seeds, but seed germination capacity and rate (Roach & Wulff 1987). Indeed, evidence of a maternal environment after-effect has been found in trees of Pinus species of
5-6 years of age (Lindgren and Wei 1994, Schmidtling 1996). Commercially, this could affect the seed producer, nursery production system and plantation management.
This chapter revisits four sites studied by Moncur et al. (1994a) which were along an altitudinal transect, covering most of the range in that study (60 to 650 masl), four and five years after their second census. This new sample would allow for a comparison of age and size effects on the reliability of flowering. The effect of water availability alluded to in Moncur et al. (1994a) is also examined more intensively by studying an established and intensively managed E. nitens water relations trial. The effect of these environments on reproduction was studied on three levels. Firstly, the effect on flower and capsule production and flowering synchrony was studied. Secondly, the effects on seed production, number of seeds per capsule and individual seed weight were assessed.
Chapter 2: Macroenvironmental effects on flowering and seed production
2.2 METHODS AND MATERIALS
2.2.1 The effect of water stress on flowering and seed production
2.2.1.1 Site description
This study was conducted on an existing eucalypt water relations trial established by the CSIRO Division of Forestry (now CSIRO Forestry and Forest Products) in 1990. The trial design, management and measurement techniques are extensively detailed in
Honeysett et al. (1996), White et al. (1998) and White et al. (1999) and will only be
briefly described here. The trial consists of a 2 ha plantation established on an ex-pasture site in a low rainfall area of south-eastern Tasmania (Lat 42°49'S Long 147°36'E), close to Lewisham and approximately 9 km East of Hobart Airport (Honeysett et al. 1996)
(Table 2.1).
Table 2.1 Meteorological data for 1995 from 1998 from Hobart Airport 9 km west of the Lewisham
irrigation trial (supplied by the Commonwealth Bureau of Meteorology).
Hobart Airport Mean daily Mean daily Annual Annual
42°50'24"S minimum maximum total total
147°30'00"E temperature temperature precipitation evaporation
4 mas I {°C) (°C) (mm) (mm)
1995 7.90 16.60 631.00 1229.10
1996 7.70 16.50 563.40 1187.90
1997 7.50 17.30 449.50 1262.00
1998 8.20 17.80 503.00 1403.60
The site was planted in August 1990 with seedlings from Forest Resources improved seed of juvenile persistent E. nitens in blocks of 11 rows of 19 trees in 6 replicates at an
inter-row spacing of 3.5 m and within inter-row spacing of 2 m. Within each block, a study sub-plot of five rows by six trees was established. The blocks were randomised with block
plantings of a second seed lot of E. nitens (Barrington Tops) and two provenances of E.
globulus. The site was intensively managed to exclude weed competition and predators.
The automatic microsprinkler irrigation system was installed in October 1991 with three
replicates irrigated and three replicates rainfed. Irrigation was supplied to maintain a soil water deficit in the irrigated replicates of between 20 and 40 mm. Supplementary
irrigation was given to the rain fed replicates to avoid severe water stress. The three irrigated replicates (replicates 1-3) were located adjacent and down slope from the rainfed replicates (replicates 4-6) to avoid lateral movement of irrigation water into the rainfed replicates (Honeysett et al. 1996). In 1995, the two down-slope rainfed replicates
(replicates 4 and 5) began receiving a cyclic regime of a water stress phase followed by an
irrigation phase to avoid the next droughting event (semi-irrigation) and these phases were alternated across the two replicates with each period of droughting. A stress cycle was defined as a period when the pre-dawn leaf water potential in the rainfed treatments was significantly lower that that of the irrigated treatment (Honeysett et al. 1996).
Measurements of soil water through the profile was made approximately twice monthly
Chapter 2: Macroenvironmental effects on flowering and seed production 11
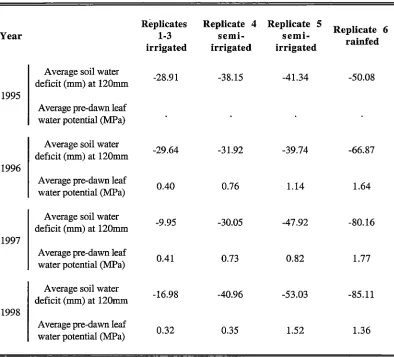
Table 2.2 Annual average soil water deficit and pre-dawn leaf water potential for 1995 to 1998 of the
treatments in the irrigation trial located near Lewisham in south-eastern Tasmania (data supplied by D.
Worledge CSIRO Forestry and Forest Products).
Replicates Replicate 4 Replicate 5
Replicate 6
Year 1-3 semi-
semi-irrigated irrigated irrigated rainfed
Average soil water
-28.91 -38.15 -41.34 -50.08
deficit (mm) at 120mm 1995
Average pre-dawn leaf water potential (MPa)
Average soil water
-29.64 -31.92 -39.74 -66.87
deficit (mm) at 120mm 1996
Average pre-dawn leaf
0.40 0.76 1.14 1.64
water potential (MPa)
Average soil water
-9.95 -30.05 -47.92 -80.16
deficit (mm) at 120mm 1997
Average pre-dawn leaf
0.41 0.73 0.82 1.77
water potential (MPa)
Average soil water
-16.98 -40.96 -53.03 -85.11
deficit (mm) at 120mm 1998
Average pre-dawn leaf
0.32 0.35 1.52 1.36
2.2.1.2 Flowering phenology
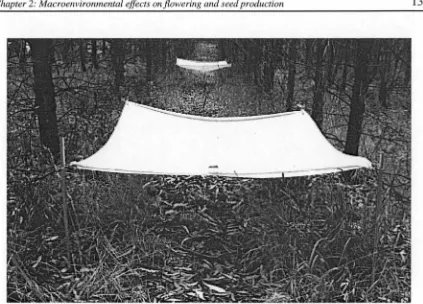
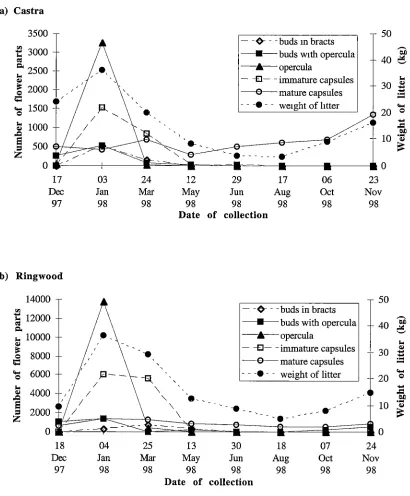
The flowering phenology was assessed by using traps to sample the litter fall from the canopy analogous to those used by Ashton (1975). On the 30th of November 1996, 15 litter traps were erected across five of the replicates, one in replicate 1, two in each of replicates 2 and 3 and five in each of replicates 4 and 6. The traps were constructed from a square of Weathashade® 70% shade cloth suspended from an 80 cm galvanised steel post at each comer and covered an area of 3.24 m2 (Fig. 2.1). Tra,ps were weighted in the
centre, forming a shallow funnel to prevent trap contents being blown out. The traps
were placed randomly, whilst avoiding placement directly over a microsprinkler, in tl;le periphery trees surrounding the study sub-plots but no closer than two rows from the outside of the block. The traps were orientated such that each comer was as close as possible to a tree trunk and with sufficient ground clearance not to interfere with the spray pattern of the micro-sprinklers. Litter was collected from each trap weekly in December to March inclusively and fortnightly in the other months. Litter from each trap and collection was air dried at room temperature in open paper bags. The dried contents in each bag were hand sorted and the number of (i) immature umbels (still enclosed in bracts), (ii) immature flower buds (operculum attached), (iii) opercula, (iv) open
flowers/immature capsules (operculum shed but valves still closed) and (v) mature capsules (valves open) were counted. From this data not only were specific event~ and temporal changes in reproductive development traced but a flower bud and capsule budget
Chapter 2: Macroenvironmental effects on flowering and seed production
Figure 2.1 Litter traps constructed from knitted nylon mesh suspended from steel droppers designed to collect flower parts as they fall from the canopy. The surface area of the trap = 3 .24 m2
•
2.2.1.3 Seed collection
13
In December 1997 mature capsules were collected from 12 to 14 periphery trees in each
treatment regime (irrigated, semi-irrigated, rainfed) none of which were in the outside
rows of the block or surrounding the traps. Once trees with mature capsules were identified, trees were then selected for harvesting based on the accessibility of umbels for
collecting by cutting away umbel bearing branchlets using a telescopic pruner. For each
tree, umbels were removed from branchlets and grouped according to the number of
capsules in the umbel ( 1-7). The capsules in each umbel size class were dried at room
temperature to facilitate seed release. The seed was cleaned of chaff, sorted according to
viability and insect damage (Hardner and Potts 1995) and counted to give an average
class from each tree was bulked together and weight to obtain an average individual seed weight.
2.2.1.4 Seed Germination
To examine if the water limited maternal environment had affected the response of seeds to imbibition under conditions of depressed osmotic potential, germination of the seeds was carried out using a solution of polyethylene glycol (PEG). The gig weight ratio of PEG
8000 to water required to make a solution of a nominal water potential ('¥) of -0.2 MPa at
20°C was calculated using the formula:
[PEG] = (4 - (5.16 'PT- 560'¥ + 16)05
) I (2.58T- 280) ... [Eqn. 2.1 (Michel 1983)]
where '¥=water potential in bars (1bar=0.1 MPa)
T= temperature in °C
A germination substrate was prepared by filling a 9 cm diameter disposable petri dish with
Chapter 2: Macroenvironmental effects on flowering and seed production 15
fluorescent tubes at a photo flux density of 100 µmol.m-2.s-1 and arranged in 5 completely
randomised replicates. The seeds from each tree were thus present in each replicate twice,
once imbibing in distilled water and once imbibing in PEG solution.
Dishes were examined every two to three days for germination. Seeds where the radicle
had ruptured the testa were considered to have germinated and were removed. To prevent
desiccation, distilled water was added to dishes to maintain 1 to 2 ml of free water in the
base of the dish. Scoring was maintained until germination had ceased, typically one
week without germination (Battaglia 1993).
2.2.1.5 Statistical analysis
For statistical analysis, the appropriate data was transformed as necessary to optimise the
normality of the residuals and homogeneity of the variances. All results from transformed
data were back transformed for presentation. For each trait, specific a priori contrasts
between the treatments were undertaken using Tukeys adjustment and least squares means
and standard errors of the treatment effects calculated. The statistical models were initially
fitted with the PROC GLM procedure in SAS (SAS 1992) to examine the need to
transform the raw data. The models were then fitted again to the data (which was
transformed as necessary) using the PROC MIXED procedure in SAS (SAS 1992) to
Growth measurements
For growth, the statistical model fitted based on single tree cross sectional area at breast height (CSA) was:
CSA = mean + treat+ error ... (Eqn. 2.2),
where treat is the fixed effect of irrigation treatment regime (irrigated, semi-irrigated,
rainfed).
Flowering phenology
In Tasmania E. nitens normally commences flowering in mid-summer (Tibbits 1989) and for this experiment a datum was established to provide a temporal reference point for flowering events (Griffin 1980). The datum was assigned to the first week in which the litter was collected in the first season (the first week in December 1996) and was
designated flowering week 1. All events were timed from week 1 through to week 52 (last week in November 1997), the end of the first flowering year, after which the second
flowering year was started at week 1 (first week in December 1997) and finished at week 52 (last week in November 1998). For calculation of flowering synchrony, a cut off point for the collection of opercula was used and defined as 2% of the total number of opercula collected in a given year. This was done to reduce the effect of opercula caught in the aerial litter (Wright and Calderon 1995).
Chapter 2: Macroenvironmental effects on flowering and seed production 17
flm:yering date Gorchov (1990)], (iv) total flowers (based on opercula), (v) pre-flowering
buds lost annually, (vi) proportion of pre-flowering buds lost, (vii) proportion of immature capsules and (viii) total mature capsules of undetermined age, from each
irrigation treatment regime (irrigated, semi-irrigated and rainfed) based on individual trap
data for each flowering year. The model fitted was:
trait= mean+ year+ treat+ treat*year + trap(treat) + error ... (Eqn. 2.3),
where year is the fixed effect of flowering year (1 or 2), treat is the fixed effect of the
irrigation treatment regime (irrigated, semi-irrigated, rainfed), treat*year is the fixed two
way interaction between irrigation treatment and flowering year and trap( treat) is the
random effect of the trap (1-5) within a treatment regime. The trap( treat) effect was used
to obtain an approximate test of the significance of the treatment effect, whereas the
significance of the year and treat*year effects were tested against the error.
Seed Collection
A statistical model was fitted to the data in each umbel size class for the average number of
viable seeds per capsule and average viable seed weight for each tree harvested from the
three irrigation treatment regimes. The model fitted was:
trait= mean+ umbel+ treat+ umbel*treat + tree(treat) + error. .... (Eqn. 2.4),
where umbel is the fixed effect of the umbel size class (1-7), treat is the fixed effect of the
way interaction between umbel size and irrigation treatment and tree( treat) is the random effect of the tree within an irrigation treatment. The tree( treat) effect was used to obtain an approximate test of the significance of the treatment effect whilst the significance of all other terms was tested against the error. Analysis was also undertaken to examine and remove the effect of the number of viable seeds per capsule on seed weight by including the number of viable seeds per capsule as a covariate in Eqn. 2.4. Pearsons correlations between viable seeds per capsule and seed weight were carried out using PROC CORR
procedure in SAS (SAS 1992) for all seeds collected and for seeds collected in each treatment.
Seed Germination
The rate of germination for each dish was determined by calculating the time taken from the commencement of imbibition to reach 50% of the final cumulative germination (t50). A
value for (t50) was calculated by regressing probit transformed percentage germination data against the natural logarithm of elapsed time (Battaglia 1993).
A statistical model was fitted to the data for the rate of germination (t50) and proportion of
seeds which germinated for each dish. The model fitted was:
trait= mean+ rep+'¥+ treat+ '¥*treat+ tree(treat) + tree(treat)* '¥ + error .... (Eqn. 2.5),
where rep is the random effect of replicate (1-5), 'P is the fixed effect of the applied water
potential (0 or -0.2 MPa), treat is the fixed effect of the irrigation treatment regime
Chapter 2: Macroenvironmental effects on flowering and seed production
water potential and the irrigation treatment, tree(treat) is the random effect of tree within
irrigation treatment and tree(treat)* 'I' is the random interaction between tree within an 19
irrigation treatment and the applied water potential. The tree(treat) effect was used to
obtain an approximate test of the significance of the treat effect. The tree( treat)* 'I' effect
was used to obtain an approximate test of the significance of the tree( treat), '¥*treat and 'I'
effects, whiJst the significance of the tree(treat)* 'I' and rep terms were tested against the
error. The effect of seed weight was examined and removed by inclusion of tree means for individual seed weight as a covariate in Eqn. 2.5.
2.2.2 The effect of altitude on flowering and seed production
2.2.2.1 Site descriptions
This study was conducted in a species and provenance growth trial established by the CSIRO Division of Forestry (now CSIRO Forestry and Forest Products) which consisted of four sites in an altitudinal transect at 60, 240, 440 and 650 masl in the Esperance
Valley, south-eastern Tasmania (ea. Lat 43°15' S, Long 146°50' E) (Turnbull et al. 1993).
The environmental characteristics, establishment and management of the sites are described in detail in Turnbull et al. (1993) and Beadle et al. (1996) and will only be
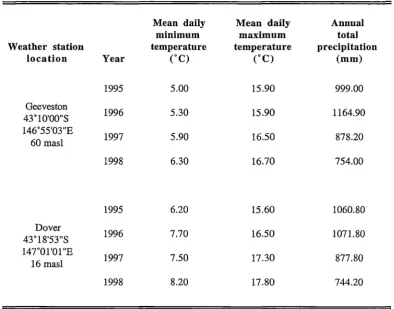
Table 2.3 Meteorological data for 1995 to 1998 from weather stations at Geeveston and Dover in
south-eastern Tasmania (supplied by the Commonwealth Bureau of Meteorology).
Mean daily Mean daily Annual
minimum maximum total
Weather station temperature temperature precipitation
location Year (°C) (°C) (mm)
1995 5.00 15.90 999.00
Geeveston
1996 5.30 15.90 1164.90
43°10'00"S 146°55'03"E
1997 5.90 16.50 878.20
60 masl
1998 6.30 16.70 754.00
1995 6.20 15.60 1060.80
Dover
1996 7.70 16.50 1071.80
43°18'53"S 147°0l'Ol"E
1997 7.50 17.30 877.80
16 masl
1998 8.20 17.80 744.20
After clearing, sites were planted in 1983 with 6 adjacent species blocks with a 2 x 2 metre spacing between trees. The E. nitens species block was planted as a 17 x 17 tree block
with a central 11 x 11 tree measurement block. Half of the E. nitens species block was
planted with seedlings of Errinundra provenance (now classified as E. denticulata, [Cook
and Ladiges 1991]), the remaining half in which this study was undertaken consisted of trees of the Toorongo provenance of E. nitens CSIRO seed lot 13611. The sites were
Chapter 2: Macroenvironmental effects on flowering and seed productzon 21
2.2.2.2 Growth measurement
In December 1998 all E. nitens trees at each site were measured for diameter over bark at
breast height.
2.2.2.3 Flowering phenology
On the lst of December 1996, 4 litter traps were erected in the E. nitens blocks at each of
the four sites. The traps were randomly located under trees in the central measurement block. The traps were constructed (see Fig. 2.1) and collections were made at the same frequency for the same 24 month period as in section 2.2.1.2. The maximum and
Table 2.4 Mean annual minimum and maximum temperatures for December 1996 to November 1998
(based on weekly and fortnightly observations) for plantat10ns along an altitudinal transect in south-eastern
Tasmania.
Year
1996/97
1997/98
2.2.2.4 Seed Collection
Site altitude (masl) 60 240 440 650 60 240 440 650
Mean minummn (°C) 2.29 3.51 0.85 0.27 0.81 3.08 0.53 0.12
Mean maximum (°C) 22.01 20.71 18.85 16.12 22.38 20.48 18.18 15.77
In March 1998 mature capsules were collected from 9 to 11 E. nitens trees at each site.
Trees were selected for harvest based on the number of accessible capsules for collecting by cutting away umbel bearing branchlets using secateurs on a telescopic pole. After their
Chapter 2: Macroenvironmental effects on flowering and seed production 23
2.2.2.5 Seed Germination
Seeds from each of six trees from each site were used for germination testing.
Germinations were carried out in petri dishes prepared as described in section 2.2.1.4
except seeds were imbibed with only distilled water. For each tree, 15 seeds were placed into each of 10 petri dishes containing the moistened germination substrate. The petri
dishes were placed in growth cabinets and arranged randomly in five replicates of one dish per tree in each replicate in each of two cabinets. Conditions in the first cabinet were as described in section 2.2.1.4 whilst conditions in the second cabinet were identical to the
first cabinet except the temperature was maintained at a constant 12°C instead of 20°C. Dishes were scored for germination and maintained as described in section 2.2.1.4.
2.2.2.6 Statistical analysis
Data from the flowering phenological study, seed collection, seed germination and growth was analysed as described in section 2.2.1.5 with only minor modifications to the
statistical models. In the flowering phenological, seed collection and growth studies, irrigation treatment regime (irrigated, semi-irrigated, rainfed) was replaced with site
In the seed germination study, Eqn. 2.5 was modified to:
trait= mean+ rep(temp) +temp+ alt + temp*alt + tree(alt) + tree(alt)*temp + error. ... (Eqn. 2.5a),
where rep( temp) is the random effect of replicate within germination temperature (1-5),
temp is the fixed effect of germination temperature (12 or 20°C), alt is the fixed effect of
the altitude of the site from which seed was harvested (60, 240, 440 and 650), temp*alt is
the fixed two way interaction of germination temperature and site altitude from which seed
was harvested, tree(alt) is the random effect of the tree (1-6) at an altitude and
tree(alt)*temp is the random interaction between tree at an altitude and germination
temperature. The rep(temp) and tree(alt) effects were used to obtain an approximate test of
the significance of the effect of germination temperature and site altitude respectively. The tree(alt)*temp effect was used to obtain an approximate test of the significance of the effect
of germination temperature, the interaction between germination temperature and site
altitude, and each tree at each site altitude. All other terms were tested against the error.
2.3 RESULTS
2.3.1 The effect of water stress on flowering and seed production
2.3.1.1 Flowering phenology and growth
The total number of flowers which opened in both years was significantly affected by the
Chapter 2: Macroenvironmental effects on flowering and seed production 25
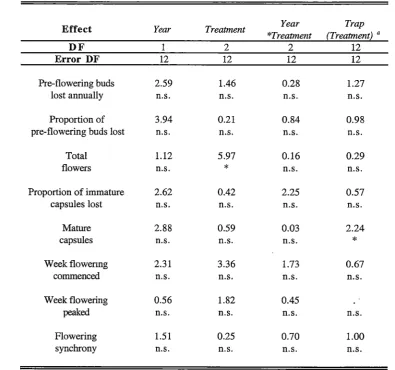
significantly reduced by subjecting trees to a cyclic regime of water stress and irrigation (Figure 2.2). The number of flowers produced appears to be limited by the number of buds initiated rather than the rate of bud abortion between initiation and flower opening as there was no significant difference between treatments in the proportion of pre-flowering buds lost in either year (Table 2.5). The result for the proportion of pre-flowering buds lost is a robust estimate despite the buds being of indeterminate age as there was no
significant variation in the number of pre-flowering or total flowers between years (Table 2.5).
There was no significant difference in tree cross sectional area between the rainfed and semi-irrigated treatments (p >0.05) despite the significant difference in flower abundance (Table 2.5). In contrast, the fully irrigated trees had significantly greater stem cross sectional areas than those in the rainfed or semi-irrigated treatments (p <0.001) but
produced flowers at a rate which was intermediate to both and not significantly different to either (Figure 2.2). This suggests tree size in this case is not a major controlling effect on flower abundance. The number of mature capsules collected was not significantly affected by water availability in either year, and did not differ significantly from year to year (Table 2.5).
Table 2.5 ANOV A table for the effects of year and irrigation treatment on the reproductive phenology of
mature trees in a plantation situated in a low rainfall area ( <500 mm.year-1
) of south-eastern Tasmania.
Levels of significance are shown whilst F values are given for fixed effects and Z values are given for
"random effects. Key: DF = degrees of freedom, n.s. = not significant (p > 0.05),
*
=
p < 0.05.Effect Year Treatment Year Trap
*Treatment (Treatmenti a
DF 2 2 12
Error DF 12 12 12 12
Pre-flowering buds 2.59 1.46 0.28 1.27
lost annually n.s. n.s. n.s. n.s.
Proportion of 3.94 0.21 0.84 0.98
pre-flowering buds lost n.s. n.s. n.s. n.s.
Total 1.12 5.97 0.16 0.29
flowers n.s.
*
n.s. n.s.Proportion of immature 2.62 0.42 2.25 0.57
capsules lost n.s. n.s. n.s. n.s.
Mature 2.88 0.59 0.03 2.24
capsules n.s. n.s. n.s.
*
Week flowenng 2.31 3.36 1.73 0.67
commenced n.s. n.s. n.s. n.s.
Week flowering 0.56 1.82 0.45
peaked n.s. n.s. n.s. n.s.
Flowering 1.51 0.25 0.70 1.00
Chapter 2: Macroenvironmental effects on flowering and seed production 27
Table 2.6 The timing of flowering events of mature trees over two consecutive seasons in a plantation which is receiving different irrigation regimes and situated in a low rainfall area ( <500 mm.year-') of so uth-eastern Tasmania. These events are based on litter trap means where the week 1 datum was the first week in December in both 1996 (first season) and 1997 (second season). Flowering synchrony expresses the standard deviation of the weeks in which flowers opened (Gorchov 1990).
Year Irrigation regime Week flowering Week flowering Flowering
started peaked synchrony
irrigated 5.80 9.30 1.47
1996/97 semi-irrigated 8.09 9.50 1.46
rainfed 6.00 9.90 1.39
irrigated 6.20 8.50 1.37
1997/98 semi-irrigated 6.44 8.83 1.08
rainfed 5.20 10.20 1.42
40 a 0.03
~
35 a a.
0.025 i..
Q: ~
"' E 30
ab
i
0.02 -;=
i.. 25 0 ,-...
a. ~ ~
c.. I.I "'
20 0.015 a. +I
"'
"'"'
i..
ab "' E
a.
er;: 15
"'
._,0.01 0
0 i..
~ I.I
10 b
b 0.005 E a.
5 r'1 ...
0 0
irrigated semi- rainfed irrigated semi- rainfed
irrigated irrigated
1996/1997 season 1997/1998 season
Figure 2.2 The number of flowers which opened (bars), based on opercula collected in litter traps over two seasons and mean tree cross sectional area at breast height (o ±se) in a plantation receiving different irrigation regimes and located in a low rainfall area (<500 mm.year-1
) of south-eastern Tasmania. The plantation was established in mid 1990 and irrigation treatments commenced in late 1991. Values for the
2.3.1.2 Seed quality
Seed production
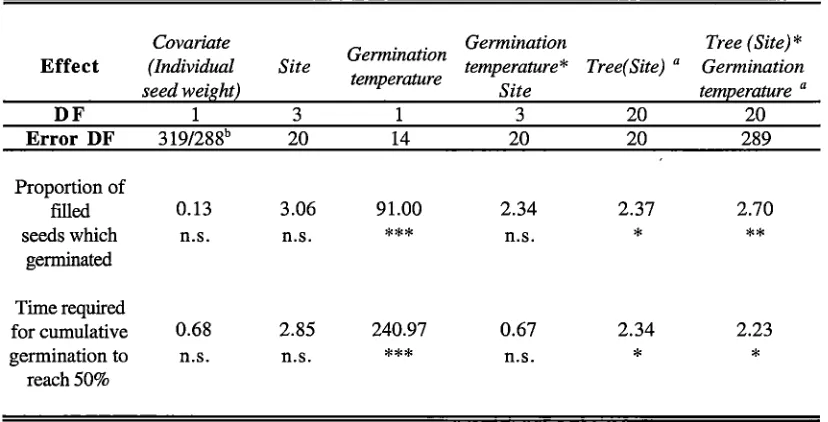
The tree from which the seed was harvested had a highly significant affect both the number of seeds per capsule and individual seed weight (Table 2.7). The more seeds
which developed in a capsule, the lighter their weight as individual seed mass was negatively correlated (r
=
-0.31) with the number of seeds per capsule. This negative effect on seed weight of the number of seeds per capsule was highly significant (F = 62.03, p <0.001). However, the effect of the maternal tree on seed weight was not due to the number of seeds per capsule as the tree effect on seed weight remained stronglysignificant (Z
=
4.00, p <0.001) when the number of seeds per capsule was accounted for by covariate analysis.The number of viable seeds per capsule and the seed weight was npt significantly affected by the availability of water to the maternal parent (Table 2.7) .and this is counter to the
significant effects water availability had on growth and flowering. The mean numbers of seeds per capsule were 3.8, 4.3 and 3.4 from trees in the irrigated, semi-irrigated and rainfed treatments respectively. On a capsule per umbel basis, the mean number of seed
Chapter 2: Macroenvironmental effects on flowering and seed production
29
Table 2.7 ANOVA table for the effects of irrigation treatment and the number of capsules in an umbel
on the characteristics of seeds collected from trees m a plantation situated in a low rainfall area ( <500
mm.year-1
) of south-eastern Tasmania. Levels of significance are shown. F values are given for fixed
effects whilst Z values are given for "random effects. Key: DF = degrees of freedom, n.s. = not significant
(p > 0.05),
***
= p < 0.001.Capsules per Capsules per Tree
Effect Treatment umbel
umbel
*Treatment (Treatment) a
DF 2 6 12 36
Error DF 36 177 177 177
Viable seeds 1.91 0.63 1.71 3.76
per capsule n.s. n.s. n.s.
***
Individual 0.86 0.47 1.36 3.95
Seed germination
There was a significant reduction in both the success and rate of germination of seeds which were imbibed at a reduced water potential (Figures 2.3 and 2.4), whilst the maternal tree had a significant effect only on the rate of germination (Table 2.8). The water
availability of the maternal environment did not significantly affect the success or rate of germination, nor was there a significant interaction between imbibing water potential and the water availability of the maternal environment or the maternal genotype (Table 2.8).
When seed weight was accounted for, the significance of the main effects and their
interactions remained unchanged whilst the effect of seed weight on the success and rate of germination was not significant (p <0.05)
Table 2.8 ANOV A table for the effects of maternal tree irrigation treatment and the water potential
during germination on the proportion and rate of germination of filled seeds harvested from trees under
different irrigation regimes in a plantation situated in a low rainfall area ( <500 mm.year-1
) of south-eastern
Tasmania. Levels of significance are given whtlst F valued are given for fixed effects and Z values are
given for "random effects. Key: '¥ = water potential, DF = degrees of freedom, n.s. = not significant (p >
0.05),
***
= p < 0.001.Germination Tree
Effect Treatment Germination 1F
*
Tree (Treatment)1F
Treatment (Treatment) a *Germination 1Jf a
DF 2 1 2 15 15
Error DF 15 15 15 15 140
Proportion of
filled 0.80 44.64 0.70 1.82 1.54
seeds which n.s.
***
n.s. n.s. n.s.germinated
Time required
for cumulative 0.01 400.46 1.54 2.31 0.00
germination to n.s.
***
n.s.*
n.s.Chapter 2: Macroenvironmental effects on flowering and seed production
"'O 100
CU
.... 90
=
=
80·5
""
70CU
tlJ)
tll 60
"'O 50 CU CU tll 40 "'O
-2:! 30
iE 20
....
0 10~ 0
a
-' irrigated a - semi-irrigated a -rainfedImbibed at -0.2 MPa
a a a
-
-
~irrigated semi- rainfed irrigated
Imbibed at 0 MPa
31
Figure 2.3 The percentage of filled seeds which germinated when imbibed at different water potentials.
The seeds were harvested from trees receiving different irrigation regimes in a plantation situated in a low
rainfall area (<500 mm.year·1
) of south-eastern Tasmania. Values with the same letter and within the same
imbibing water potential are not significantly different (p >0.05). The overall significance of the imbibing
water potential effect on germination success was p <0.001.
10 a
9 a a
8
,.-._ 7
tll ...., 6
=
"'O 5' - ' a a a
'°' 4
.,, ... 3 2 1 0
irrigated semi- rainfed irrigated semi- rainfed
irrigated irrigated
Imbibed at -0.2 MPa Imbibed at 0 MPa
Figure 2.4 The time taken in days from the commencement of imbibition for seedlots to reach 50% of the final cumulative germination (t50) when imbibed at different water potentials. The seeds were harvested
from trees receiving different irrigation regimes in a plantation situated in a low rainfall area ( <500
mm.year-1
) of south-eastern Tasmania. Values with the same Jetter and within the same imbibing water
2.3.2 The effect of altitude on flowering and seed production
2.3.2.1 Flowering phenology and growth
There was a significant effect on both the start and peak of flowering as site altitude
increased from 60 to 650 m (Table 2.9). The commencement of flowering was delayed by approximately 3 weeks whilst the peak of flowering was delayed by approximately 2
weeks at the 650 m site compared to the 60m site in both years (Table 2.10). Both the commencement and peak of flowering occurred significantly earlier in the second year compared to the first by about 1.5 weeks (Table 2.10). Flowering synchrony did not change significantly between years (Table 2.9) and was only affected by site in the first year where flowering at the 240 m site was significantly more asynchronous than
flowering at both the 440 m and 650 m sites (Table 2.10).
The site of the trials significantly affected stem radial growth (F
=
5.29, p <0.01), flower abundance, the loss of unopened flowers and immature capsules and the fall of maturecapsules (Table 2.9). However, there was no clear relationship between growth or reproductive traits and increasing site altitude (Figures 2.5 to 2.8). Site effect on tree survival could not be determined due to previous destructive sampling whilst the numbers
Chapter 2: Macroenvironmental effects on flowering and seed production
33
Table 2.9 ANOV A table for the effect of year and site on the reproductive phenology of mature trees rn
trials along an altitudinal transect in south-eastern Tasmania. Levels of significance are shown whilst F
values are given for fixed effects and Z values are given for "random effects. Key: DF = degrees of freedom,
n.s. = not s1gmficant (p > 0.05), *
=
p <0.05, **=
p <0.01, ***=
p <0.001Effect Year Site Year*Site Trap(Site) a
DF 1 3 3 12
Error DF 12 12 12 12
Pre-flowering buds 3.23 16.88 0.84 1.36
lost annually n.s. *** n.s. n.s.
Proportion of 28.14 13.18 18.16 1.57
pre-flowering buds lost *** *** *** n.s.
Proportion of immature 4.89 9.46 11.64 1.33
capsules lost * ** *** n.s.
Mature 11.88 8.26 5.30 2.27
capsules ** ** * *
Week flowering 24.05 10.21 0.49 1.62
commenced *** ** n.s. n.s.
Week flowenng 26.41 17.44 3.59
peaked *** *** * n.s.
Flowenng 1.83 5.54 1.71
synchrony n.s. * n.s. n.s.
The proportion of unopened flower buds which were lost was greatest at the 650 m site in
Table 2.10 The timing of flowering events over two years in plantations along an altitudinal transect in
south-eastern Tasmania. The data is based on litter trap means where the week 1 datum was the first week
in December in both 1996 (first season) and 1997 (second season). Values in each season and series with
the same letter are not significantly different (p >0.05).
Year Site altitude Week flowering Week flowering Flowering
(masl) started peaked synchrony
60 3.25 a 8.25 ab 1.43 ab
1996/97 240 6.00 b 8.00 a 1.83 a
440 6.50 b 9.25 be 1.11 b
650 7.00 b 10.00 c 1.07 b
60 2.25 a 6.00 a 1.17 a
1997/98 240 5.00 b 7.75 b 1.36 a
440 5.00 b 8.50 b 1.27 a
650 5.25b 8.50 b 1.04 a
450 a 0.05
400 0.045 co:
Q,I
'"'
350 0.04 co:
....
i
e
a 0.035 -;'"'
300=
Q,I
i
0.03 0 ,-...Q.,
250 ~
"
Q,>"'
"'
~
~
a 0.025 Q.I +I'"'
"'
....Q,I 200
"'
e
~ 0.02
"'
.._,0
150 0
fi: 0.015
'"'
b b
"
100 b 0.01
e
b Q,I
50 b 0.005 VJ ....
0 0
60m 240m 440m 650m 60m 240m 440m 650m
1996/1997 season 1997/1998 season
Figure 2.5 The number of flowers which opened (bars), based on opercula collected in litter traps, over
two seasons and mean tree cross sectional area at breast height (o ±se) measured in December 1998 in trials
along an altitudinal transect in south-eastern Tasmania. The trials were planted in late 1983 and respective
altitudes in metres (m) are shown. Values for the number of flowers in the same season and with the same
letter are not significantly different (p >0.05). The effect of season on flowering was not significant (p
Chapter 2: Macroenvironmental effects on flowering and seed production 35
....
70"'
a.s
"'
60"O
=
~ 50
1)1)
.5 i... 40
QJ
:::
0 30
c
~ b
:;.. 20 a
oll
....
b a a0 10 b
~ 0
60m 240m 440m 650m 60m 240m 440m 650m
1996/1997 season 1997/1998 season
Figure 2.6 The proportion of flower buds aborted prior to opening based on litter trap collections made
over two years in trials along an altitudinaJ transect in south-eastern Tasmania. The trials were planted in
late 1983 and respective altitudes in metres (m) are shown. Values for the number of flower buds in the
same season and with the same letter are not significantly different (p >0.05). The effect of season on
flowering was not significant (p >0.05).
100
90
80 a
....
"'
.s
70"'
60i... QJ
a
ab ::: 50
0 c
....
400 b
~ 30 b
20 b
c
be
10
0
60m 240m 440m 650m 60m 240m 440m 650m
1996/1997 season 1997 /1998 season
Figure 2.7 The percentage of flower buds which opened but were lost before maturing into capsules.
The calculations were based on the ratio of the number of open flowers and immature capsules to the
number of opercula which were collected in litter traps over two seasons in trials along an altitudinal
transect in south-eastern Tasmania. The trials were planted in late 1983 and respective altitudes in metres
(m) are shown. Values in the same season with the same letter are not significantly different (p >0.05).
140 a
"'a
120"'
~c. 100
"'
~
"3 80
"'
c.cc IJ 60
40
20
60m
b
Ix:
c
240m 440m 650m
December 1996 - November 1997
a
ab
Ix:
c
60m 240m 440m 650m
December 1997 - November 1998
Figure 2.8 The number of mature capsules collected in litter traps over two seasons in trials along an
altitudinal transect in south-eastern Tasmania. The trials were planted in late 1983 and the respective
altitudes in metres (m) are shown. Values in the same season with the same letter are not significantly
Chapter 2: Macroenvironmental effects onflowenng and seed production
Table 2.11 ANOV A table for the effect of year and site, with tree cross sectional area included as a
covariate, on the reproductive phenology of mature trees in trials along an altitudinal transect in south-37
eastern Tasmania. Levels of significance are shown whilst F values are given for fixed effects and Z values
are given for "random effects. Key: DF = degrees of freedom, n.s. =not significant (p > 0.05), *
=
p <0.05, **=
p <0.01, ***=
p <0.001.Effect Covariate Year Site Year*Site Trap(Site) a
(Tree size)
DF 1 1 3 3 12
Error DF 12 12 11 12 12
Pre-flowering buds 0.62 3.23 10.77 0.84 1.34
lost annually n.s. n.s. ** n.s. n.s.
Proportion of 0.27 28.14 7.97 18.16 1.56
pre-flowering buds lost n.s. *** ** *** n.s.
Total 0.68 0.08 13.13 6.39 1.78
flowers n.s. n.s. *** ** n.s.
Proportion of immature 0.79 4.89 8.33 11.64 1.30
capsules lost n.s. * ** *** n.s.
Mature 0.00 11.88 7.14 5.30 2.19
capsules n.s. ** ** * *
2.3.2.2 Seed quality
Seed production
The number of seeds per capsule was significantly affected by number of capsules per umbel and the tree from which the seed was harvested (Table 2.12). The number of seeds per capsule increas~d by up to 25 % as the number of capsules per umbel increased from 1
,
there was a trend for the number of seeds per capsule to decrease as site elevation increased (Figure 2.9).
Individual seed weight was significantly affected by the site and the tree from which it was harvested (Table 2.12). There was no direct relationship between seed weight and site altitude as seed weight was greatest at the 240 m site whilst the 650 m site produced the lightest seed (Figure 2.10). Individual seed weight was not significantly affected by the
number of capsules per umbels (Table 2.12). This suggests the total mass of seed per capsule increases as the number of capsules per umbel increases. The significant tree effects on individual seed weight could not be accounted for by the number of seeds per
capsule (Table 2.13). Nevertheless, neither the significant tree effect nor the site effect on seed weight was accounted for by variation in the number of seeds per capsule although the site effect was diminished
In general, individual seed weight was significantly decreased with increasing numbers of seed per capsule (p <0.001) and the significant (p <0.05) interaction-between the covariate and site suggests the relationship differed between sites. The covariate partially accounted for some of the effects of site on individual seed weight as the level of significance of the site effect was reduced (Table 2.13). The interaction between the effects of site and the number of seeds per capsule were due to differences in the magnitude, direction and
Chapter 2: Macroenvironmental effects on flowering and seed production 39
Table 2.12 ANOV A table for the effects of site, tree and the nwnber of capsules in an umbel on the
characteristics of seeds harvested from trees in trials situated along an altitudinal transect in south-eastern
Tasmania. Levels of significance are shown whilst F valued are given for fixed effects and Z values are
given for •random effects. Key: DF =degrees of freedom, n.s. = not significant (p > 0.05), *** = p <
0.001.
Effect Site Capsules per Capsules per Tree(Site) a
umbel umbel*Site
DF 3 6 18 36
Error DF 36 205 205 205
Viable seeds 1.49 11.29 0.86 4.08
per capsule n.s. *** n.s. ***
Individual 17.76 1.13 1.24 3.83
seed weight *** n.s. n.s. ***
3 a
-
a 2.5 Q.l '3ab ab
-a
b b ...-
....--
-"'
c. 2
ell
~
-a a c
-
....--
c-""
Q.l 1.5
c.
"'
"C Q.l Q.l rFJ 0.5 060 240 440 650 1 2 3 4 5 6 7
Site altitude (masl) Number of capsules per umbel
Figure 2.9 The mean number of viable seed per capsule from different sized umbels harvested from trial
sites along an altitudinal transect in south-eastern Tasmania. Capsules were harvested in March 1998 dried
at room temperature and the seeds were hand sorted. Values in the same series and with the same letter are
0.7
a
0.6
-,-.._
OJ)
0.5
e
.._,
b a a a a
-
' b a a a-I" ~
-
-
--
-
-....
0.4.c:
OJ)
·~
1·;;.
c
<' .. .
-~ 0.3 "
'O
~
0.2
~
rJ"1 '
0.1
0
60 240 440 650 2 3 4 5 6 7
Site altitude (masl) Number of capsules per umbel
Figure 2.10 The mean individual weight of seeds from capsules in different sized umbels harvested from
trees in trial sites along an attitudinal transect in south-eastern Tasmania. Capsules were harvested in
March 1998 dried at room temperature and the seeds were hand sorted and weighed. Values in the same
series and with the same letter are not significantly different (p >0.05).
Table 2.13 ANOV A table for the effects of site and the number of capsules in an umbel, with the
number of seeds per capsule included as a covariate, on the individual weight of seeds collected from trees
in trials situated along an attitudinal transect in south-eastern Tasmania. Levels of significance are shown
whilst F valued are given for fixed effects and Z values are given for "random effects. Key: DF =degrees of
freedom, n.s. = not significant (p > 0.05),
***
= p < 0.001.Covariate Site* Capsules
Covariate Capsules
Effect (Viable seeds
(Viable seeds Site per umbel per Tree(Site) a
per capsule)
per capsule) umbel*Site
DF 1 3 3 6 18 36
Error DF 201 201 36 201 201 201
Individual 11.33 3.14 6.24 2.1 1.19 3.67