KAllA, N.: Altitudinal variation inPinus brutiaTEN. and its implication in genetic conservation and seed transfer in southern Turkey. Silvae Genetica 46: 113-120 (1997). - ISIK,K. and ISIK, F.: Genetic variation in Pinusbrutiain Turkey: Branching and crown traits. Silvae Genetica 48: 293-302 (1999). - IRIK, F., ISTK,K.and LEE, S. L.: Genetic variation in Pinus brutia in Turkey: Growth biomass and stem quality traits. Forest Genetics 6 (2): 89-99 (1999). - KAllA, N., KOIWL,L.,ISIK,K and SCHILLER, G.: Genetic diversity in Pinus brutia'1'1'1\': Altitudinal varia-tion. Silvae Genetica 46 (2-3): 155-161 (1997). - KAYA, Z. and ISIK, F.: The pattern of genetic variation in shoot growth ofPinus brutiaTEN. Populations sampled from the Taurus Mountains in Turkey. Silvae Genetica 46 (2-3): 73-81 (1997). - KOSKI, V. and A:-I'I'ol.A, J.: National tree breeding and seed product.ion programme for Turkey, 1994 to 2003. 52 pp. (199:~). - LAIVIIJETH, C. C., DOUGHERTY,P.M., GLADSTONE,W.1., MCCULLOUGH, R. B. and WI':LLS, O. 0.: Large scale planting of North Carolina loblolly pine in Arkansas and Oklahoma: A case of gain versus risk. Journal of Forestry 82 (12): 736-741 (1984). - LI, B. and MCKEAND, S. E.:Stability of loblolly pine families in the southernU'.S. Silvae Genetica 38 (3-4): 96-101 (1989). - MCKEAND, S. E., LI, B., HA'I'CH~:I{,A. V. and WEIJ{,R. J.: Stability parameter estimates for stem volume for loblolly pine families growing in different regions in the southeastern United States. Forest Science 36 (1): 1017 (1990). -NAIlAL, 1.: Le pin d'Alep. (Pinus hulepensisMILL.) (The Aleppo pine),
Annls.Ec.Natn.Eaux Forets 19: 479-686 (French) (1962). - OWI:-IO,F:
Genotype-environment interaction and genotypic stahility in lohlolly pine.II.Genotypic stability comparisons. Silvae Genetica 26 (1): 21-26 (1977l. - PALMDERG, C.: Geographic variation and early growth in south-eastern semi-arid Australia ofPinus halepensisMILL. and theP
brutia TEN. species complex. Silvae Genetica 24 (5-6): 150-160 (1975).
- ROIJEHTSON, A.: The sampling variance of genetic correlation coefficient. Biometrics 15: 428-469 (1959). - SAS/STAT User's Guide: Version 6, Fourth Edition, Volume 1. Cary, NC: SAS Institute Inc. 943 pp. (1989). - SAS/STAT User's Guide: Version 6, Fourth Edition, Volume 2. Cary, NC: SAS Institute Inc. 846 pp. (1989). - SCHMIDTLI:'olG,
R. C.: Use of provenance tests to predict response to climatic change: Loblolly pine and Norway spruce. Tree Physiology 14: 805-817 (1994). - SELIK, M.: Botanical investigation onPinus brutiaespecially in com-parison withPinus halepensis.Istanbul University, Faculty of Forestry Journal 8a: 161-198 (1958). - SHUKLA, G. K.: Some statistical aspects of partitioning genotype-environmental components of variability. Heredity 29: 237-245 (1972). - SOKAL,R. R. and ROHLF, F. ,J.: Biometry. Third edition.W.H. Freeman and Company, New York. 887 pp. (1995). - SPENCER, D.: Dry country pines: Provenance evaluation of thePinus
halepensis-brutia complex in thc semi-mid rcgion of southeast
Austra-lia. Australian Forests Research 15: 263-279 (1985.). - STONECYPHEH, R. W., Plf:SCH, R. F., HELLAND, G. G., CHAI':IIAN, ,J. G. and RENO, H. J.: Results from genetic tests of selected parents of Douglas-fir (Pseudolsuga menziesii(Muui.)FllANCO) in an applied tree improvement program. Forest Science Monograph 32, volume 42, Number 2, 35 pp. (1996). - TULuKcu, T., TUNCTANER,K. andTorr.n, F.:Investigations on comparisons of some Aleppo pine(Pinus halepensisMILL.) and Turkish red pine(Pinus brutiaTEN.) origins in Marmara and Black Sea regions. Poplar and Fast Growing Exotic Forest Trees Research Institute, Izmit, Turkey. Annual Bulletin No. 23: 1-12 (1987). - USTA,H. Z.: Yield studies in Pinus brutia plantations. SIW Anatolia Forest Research Institute Technical Bulletin No. 219, 138 pp. (Turkish with English Summary) (1991). - WEINSTEIN, A.: Provenance evaluation ofPinus halepensis, P. brutia and P. elderica in Israel. Forest Ecology and Management 26(3): 215-225 (1989). - WELLS,O. 0.: Southwide pine seed sources study. Loblolly pine at 25 years. Southern Journal of Applied Forestry 7 (2): 63-71 (1983). - WIIITE, T.L. and CIIING,K K:
Provenance study of Douglas fir in the Pacific Northwest region. IV. Field perforrnanre at age 25 years. Silvae Genetica 34: 8489 (1985). -WRiCKE, G.: Uber eine Methode zur Erfassung del' iikologischen Streu-breite in Feldversuchen. Z. Planzenzucht 47: 82-92 (1962). - ZOBEL,B. and TAl.IH:rn, J.: Applied Forest Tree Improvement. .Iohn Wiley Sons, Inc. 505 pp. (1984). - ZOBEL, B., VAN WYK, G. and STAHL,P: Growing Exotic Forests. John Wiley Sons, Inc. 508 pp. (1987).
Linkage Maps of
Eucalyptus globulus Using RAPD and Microsatellite Markers
By P.C. BUNDOCK]), M. HAYDEN2)andR.E.VAILLANCOURT
Co-operative Research Centre for Sustainable Production Forestry and School of Plant Science, University of Tasmania, GPO Box252-55,Hobart, Tasmania7001,Australia
(Received 22nd August 2000)
Abstract
The construction of linkage maps based on RAPD markers using an F1 intraprovenance cross in Eucalyptus globulus
subsp. globulus is reported. Twenty-one microsatellite loci originating fromE. globulusand four otherEucalyptus species were added to the RAPD maps. Linkages between micro-satellites previously reported forE. grandis / E. uroph.yllawere found to be conserved inE. globulusallowing confident assign-ment of homology for several linkage groups between maps of these species. Homology was also identifiable between most linkage groups of the twoE. globulusparents based on micro-satellites and RAPD loci segregating from both parents. At a LOD score threshold of 4.9 the male parent has 13 linkage groups covering1013cM with101framework markers ordered at LOD3.0. The female parent has 11linkage groups covering
701 cM with97 framework markers. On the female map there were more regions of segregation distortion than expected and genetic mechanisms to explain distorted segregation are
dis-cussed. Several linkages that arise between pairs ofE. globulus
linkage groups as the LOD score is reduced are supported by interspecific homologies identified using microsatellite loci. Key words: SSR, blue gum, genomic map, genetic map, segregation distortion.
I) Present address: Centre for Plant Conservation Genetics, Southern Cross University, PO Box 157, Lismore, NSW 2480, Australia Please address correspondence to:
PETER BUNDOCK, Centre for Plant Conservation Genetics, Southern Cross University, PO Box 157, Lismore, NSW 2480, Australia. Phone: (02) 66 203581
Int Ph: +61 2 66 203581 Fax: (02) 66 269129 Int Fax: +61 2 66 269129 e-mail: [email protected]
Introduction
In temperate regions Eucalyptus globulus is the most signifi-cant hardwood tree species grown as a source of fibre for the manufacture of paper products, whilst in tropical regions E.
grandis,E. urophylla and their hybrids are the most commonly
planted Eucalyptus for pulpwood (ELDRIDGE et al., 1993). Worldwide there has been considerable effort to select and breed genetically superior Eucalyptus trees and it has been recognised that molecular markers have potential application in both breeding and deployment (cg. WILLIAMS, 1995; KERR et al., 1996; DALE and CHAPARRO, 1996; GRATTAPAGLIA, 1997). Con-sequently linkage maps composed of DNA based markers have been constructed and published for several species of Eucalyp-tus. The crosses used for generating the segregating mapping populations were either interspecific F1s (GRATTAPAGLIA and SEDEROFF, 1994; VERHAEGEN and PLOMION, 1996; MARQUES et al., 1998) or an F2 cross using grandparents from widely dis-junct populations (BYRNE et al., 1995). This would virtually ensure that parent trees would be genetically distant from one another. Using genetically distant parent trees is likely to increase the efficiency of mapping. However since Eucalyptus
globulus is generally grown as a pure species, intraspecific
(and also intraprovenance) crosses are required in most breed-ing programs. An AFLP map of E. globulus has been published, however it was based on an interspecific F1 cross with E.
tereticornis (MARQUES et al., 1998). In this paper we report on
the first maps published for Eucalyptus globulus based on a pure species cross and the first published Eucalyptus maps using an intraprovenance cross.
Like the previously published maps for E. grandis and E.
urophylla (GRATTAI'AGLIA and SEDEROFF, 1994; VERIIAEGEN and
PLOMION, 1996), the E. globulus maps in this study are based on RAPD markers. Although RAPD markers are extremely useful for map construction, especially using an F1cross, they
have limited transferability because they are dominant mark-ers with only two alleles. Co-dominant markmark-ers such as micro-satellite loci on the other hand, are expensive to isolate but have much broader transferability and are also potentially fully informative in crosses other than an Fl' Including micro-satellite markers as a significant component of Eucalyptus genomic maps should increase the informativeness, trans-ferability and reliability of these maps - factors important to their future applicability. BYRNE et al. (1996) reported that four microsatellite loci isolated from E. nitens were amplifiable and polymorphic in several other species in the genus, demonstrat-ing the potential transferability of microsatellites between species of Eucalyptus. BRONDANI et al. (1998) list primer sequences used to amplify twenty microsatellite loci that originate from E. grandis and E. urophylla and also show the location of these loci on RAPD maps from a cross between these two species. These primer sequences have been used in the present study to add E. grandis / E. urophylla microsatellite loci to the RAPD maps of E. globulus. In addition microsatellite loci originating from E. globulus,E. nitens and E. sieberi have been mapped in this cross. This has aided the identification of linkage group homology between the two E. globulus parental RAPD maps, and enabled the identification of homology be-tween the E. globulus linkage groups reported in this paper and the E. grandis and E. urophylla linkage groups of BRON-DANI et al. (1998).
Materials and Methods
Plant Material and DNA Extraction
The mapping population consists of a single full-sib family of 165 progeny from an E. globulus subsp. globulus
intraprov-enance cross, carried out by CSIRO Division of Forestry and North Forest Products (Australia) and planted at a number of field sites (VAILLANCOURT et al., 1995a). Both parents originate from King Island which is located in Bass Strait between con-tinental Australia and Tasmania. The male parent (G164) is located at a distance of several kilometres from the mother tree of the female parent (KI2) and on this basis the two parents would not be expected to be closely related (SKABO et al., 1998). The female parent is an open pollinated progeny planted in a seed orchard.
Two grams of frozen leaf material was ground to a smooth powder in liquid nitrogen using a mortar and pestle. The DNA was extracted using the CTAB extraction protocol of DOYLE and DOYLE (1990). The CTAB extraction buffer was modified by the addition of polyvinylpyrolidone (PVP-40, Sigma) at 2% (w/v). Two volumes of ice-cold ethanol (-65% final concentration), rather than isopropanol, was found to precipitate higher quali-ty DNA for PCR. By routinely adding a phenol, phenol-chloro-form extraction step, readily PC Rable DNA was almost always obtained. DNA was quantified using a Hoefer DNA Fluoro-meter (TKO 100) and Hoechst 33258 dye.
Molecular Marker Assays
Ten-mer RAPD primers were obtained from the University of British Columbia (VBC; Dr. J. B. HOBBS, c/o Biotechnology Laboratory, Wesbrook Building, 6174 University Boulevard, Vancouver, B.C. V6T1Z3) and Operon Technologies Inc. (OP; 1000 Atlantic Ave., Alameda, CA 94501, USA). Four hundred UBC RAPD primers comprising sets 1,2,3 and 5 and OP kit B were screened to identify those that amplified strong, reliable and polymorphic RAPD bands. DNA from the two parents and six progeny were used for the screening of the RAPD primers.
Amplification conditions are based on those of WILLI&vIS et al. (1993). RAPD reactions (20 ].lL) were composed of the follow-ing components: 50 mM KC1, 10 mM Tris-HCl pH 9.0 @25°C, 0.1% Triton
xioo,
200 ]..lM dNTPs, 3 mM MgClz, 150 ug/rnl, Bovine Serum Albumin (BSA), 0.25 p M RAPD primer, 1.6 units Taq DNA Polymerase and 20 ng genomic DNA and overlaid with 30 ul, of mineral oil prior to amplification. An MJ Research Inc. PTC-100 programmable thermal controller was used for amplification using the following cycling profile: 94°~2 min, [94° - 1 min, 35° - 1 min, 72° - 2 min] x 40, 72° - 5 min, 10°_ hold. Reactions were electrophoresed in 1.5% agarose gels at 22 volt. hours/em in 1 x TBE buffer. Fluorescence from ethidium bromide (incorporated into the gel at 0.2 ug/ml.lwas used to photograph the RAPD bands using Polaroid 665 film. Polymorphic bands were scored manually from the Polaroid negative. RAPD markers inherited from one parent only and segregating in an apparent 1:1 pattern were classed as originat-ing from either the male or the female parent, creatoriginat-ing two separate data sets depending on the parent of origin. A third data set was created for those RAPD markers that originated from both parents and had a 3:1 segregation pattern.
All of the microsatellite loci that were used in this study were originally isolated as dinucleotide repeats. There were three sources of microsatellite primer sequences: EMCRC
(EucalyptusMicrosatellites from Co-operative Research Centre
for Sustainable Production Forestry) loci originate from
Euca-lyptus globulus DNA enriched for microsatellite sequences;
The primer design for the EMCRC and CSIRO microsatellite loci are subject to confidentiality agreements which disallows their publication here. The reaction conditions used for the EMBRA microsatellites were essentially those of BRONDANI et al. (1998) with the following modifications: 0.1 % Triton X-I00, 0.1 mg/mL BSA, no DMSO and annealing at 57°C. All amplifi-cations were carried out on an MJ Research Inc. PTC-I00 Thermal Cycler. All amplifiable loci were screened for their potential to be mapped on both parental maps with sizing of alleles carried out on polyacrylamide gels using an Applied Bio-systems automated DNA sequencer. Reaction product fragment sizes were calculated using GENESCAN software based on an internal standard. Metaphor (FMC) agarose gels l3.5% (w/v) in 1 x TBE buffer] were used to separate microsatellite reaction products for scoring all microsatellite loci in the progeny. Depending on the size of the microsatellite and the size differ-ence between alleles, the running of the gels varied from 20 volt.hours/em at 4° to 16 volt. hours/em at room temper-ature. Ethidium bromide (0.4 ug/ml.)was incorporated into the gels which were scored from Polaroid (665) photographs of the fluorescing PCR products.
A number of different enzymes were tested for their ability to be detected using frozen mature leaf tissue as a source and starch gel electrophoresis for separation with only one poly-morphism reliably detectable. The methods used for detecting enzyme activity and starch gel electrophoresis were based on those of MORAN and BELL (1983).
Linkage Analysis
All loci segregating 1:1 from both parents were tested for evidence of linkage to each 3:1 segregating locus using a chi-squared goodness of fit test. Only those progeny that were found to be homozygous absent at the 3:1 locus were used in the test where a 1:1 segregation pattern would be expected for an unlinked (1:1) marker. Linkage is indicated where a signifi-cant departure from the 1:1 pattern arises, in this study where
IX<1X10⁻⁴
The program MAPMAKER Version 3.0b (UNIX) was used to determine linkage groupings and ordering of markers within linkage groups for loci segregating in a 1:1 pattern (LANDER et al., 1987; LINCOLN et al., 1992). Data for loci segregating 1:1 was entered as F~backcross data and markers were scored as either present (H), absent (A) or undetermined (-) for each offspring. Because MAPMAKER recognises linkage in coupling phase only, each marker needed to be represented by an original and also an inverse (repulsion phase) form in the data set. This allowed linkages in repulsion to be recognised by MAPMAKER as de facto linkages in coupling to inverse mark-ers.
The LOD score threshold for declaring linkage using MAP-MAKER was calculated based on the maximum number of independently segregating ('unlinked') positions expected in the genome and the required type I error. This is based on the expected number of linkage groups, an estimate of the genome size and a prior definition of linkage in map units. The expect-ed number of linkage groups is 11 since cytological observa-tions suggest this to be the haploid number of chromosomes in Eucalyptus (POTTS and WILTSHIRE, 1997). An upper estimate for the size of theEucalyptus genome from other mapping studies is approx. 1500 eM. Linkage can be defined arbitrarily as two markers being less than 50 eM (Kosambi) apart. The number of 'independently segregating positions' is thus the maximum number of positions that are 50 eM or more apart in the genome (ie. 41). There are 820 unique pairwise linkage tests that can be made between these 41 positions. For a probability of Type I
error of 0.01 for the genome as a whole, the appropriate LOD score threshold is - 10glO (820/0.01)
=
4.9. Thus a LOD score threshold of 4.9 for declaring linkage between markers was used with the "group" command of MAPMAKER with a conse-quent estimated probability of Type I error of 0.01 for each linkage map. Since the maximum recombination fraction at which linkage is declared will vary according to the number of progeny which have been scored in common for a marker pair, the recombination fraction parameter was left as non-restric-tive (ie. r = 0.49) when using the "group" command of MAP-MAKER.For ordering of markers within each linkage group a sub-group of six or less markers were chosen that were well spaced from one another and had a minimum of missing data. The most likely marker orders for the subgroup were found using the "compare" command of MAP MAKER with a LOD 3.0 thresh-old for alternative marker orders. The "build" command of MAPMAKER was used to identify any remaining markers in a linkage group that could be added to the order established for the initial subgroup of markers at LOD 3.0. Framework mark-er ordmark-ers wmark-ere used as the basis for data checking using the error detection system in MAPMAKER and discernible errors corrected. Error correction did not affect marker ordering as tested using the "ripple" command of MAPMAKER on the corrected data sets. The "build" command was used after error correction to add any previously unplaced framework markers to the corrected data sets at LOD 3.0 and to add accessory markers at LOD 2.0. Several markers which had missing data and that significantly inflated the length of a linkage group due to dubious double crossovers were excluded from the framework and placed as accessories. Accessory markers were located on the framework map alongside the nearest frame-work marker. Unplaced microsatellite loci in a linkage group were assigned to the most closely linked framework marker using the "near" command of MAPMAKER.
Test for Segregation Distortion
All loci classified as segregating 1:1 were tested for distortion from this expected ratio using a chi-squared goodness of fit test. Loci segregating from one parent with significant depar-ture from a 1:1 pattern atlX
=
0.05 were compared with expect-ed ratios for 2:1 and 3:1 segregation. To determine the frequen-cy of segregation distortion in the genomes of the two parents, the number of regions (rather than markers) expected to have distorted segregation was estimated for each map. (A region is defined as a group of linked markers or a lone mapped mark-er.) Estimates are based on the number of 'independently segregating positions', which is the size of each linkage group in eM divided by 50 rounded upwards and summed for the entire map. The expected number of regions with distorted segregation is the number of these 'independently segregating positions' multiplied by the threshold value used for declaring distortion as significant (eg. 0.05,o.on
Since distortions from a 1:1 ratio can alter the probability of linkage between two markers, pairs of framework markers with strong distortion and with weak linkages were checked for any extreme altera-tions to their probability of linkage. Two point LOD scores for these marker pairs were also recalculated based on an adjusted El value for no linkage.Results
Screening and Scoring of Molecular Markers
appar-(a) Map of the Male Parent
Group 1
Group 6
131-1 Group 3
237-2 290-5
Group 4 6.3- 20-7
24,9- 1 . 9
-18-3 ' 4.8
-63-6 29.8- 42-1,63-3 18-1
9 . 9 - 12,3
-11.7- 131-2 235-2
2 . 4 - 243-51235-2,10.4 EMBRA5 8.2 -
12.3-42-7 8 . 0 - EMBRA12 20-6,
21.0- 6 , 1 - 297-9, [EMBRAS', 6.5] 15,5- [EMBRA3, 3.8]
256-1,20-51478-4, 2.0 16.3
-EMBRA17 5 . 5 - 244-2 25-3! 2.0 20-1
3.5 - 235-5,91-2
EMCRC1b 256.512.0
11.15.9
-808-3 17.1- 264-4
32.7-806-1 7 . 5
-EMBRA18 2 . 2
-I 4.3 - 215-4
I 275-2 EMBRA16,
31.5-69.0- I
i
264-3 3 1 12.,5- Ir-'
so.ar,::;:::
266-2 I [EMBRA6,1.31
9 , 7 - 41.7- I
15,1 _ 245-210,6 5-3
I EMCRC81230-4,
4.9- I 14.2
18-6 1 263-5, 5.0 243-2, 275-5
1
18-3
12,4- 12.4- 1 3 4 -
24.9-EMBRA7, 460-3,266-6 297-3 EMBRAl11202-1 '
4.4 282-3,478-1
15.6- 21.3- 8.7
-246-4 Group 5 246-6
42-4 Group 2
Group 8
Group 7 CSIRO 03, 249-2
1
273-1, 31.6 Group 11EMCRC7 245-1,6.6 28.2- Group 9
232~316.6
25.3- 264-1 (232-8
131-3 14.4-
577.3
-200-2 . 249-1
806-2 28-1
4.3 -493-1
15.0-
10.0-19-1 30.2 - 30-2
9.2 - 12.0- 63-1
234-6 4.3 - 269-21264-2, 1.1
235-1 290-4, 240-1 3,6 - 807-21297-1,2.4
17.5- 6.4
-261-1
244-3 17.9- 26,a- 8.9
-8 . 1 - 19-2
243-4 CSIRO 13, 202-2 9,8
-6.7 - 10.5- 808-1 '
caz
191-2 249-4
9 . 3 - 6.5
-498-1 266-4
29.2-12.1- 218-1
16-5 ' 21.3- 17.1- 290-3~261-1,4.5
18,7- 4.9 - 263-1 807-1 282-5,12.1
237-4 217-1 Group 12
5.6 -
16,4-5.7 - 249-5
230-2 215-6
37.0-16.2- rEMCRC10
263-3 25.1-
93-5,6 - 498-6 . 266-1 1 460-2, 2.2
234-2 215-1
9.3 - Group 10 Group 13
EMCRC6
[image:4.595.117.481.72.562.2]
17,2-CSIRO 10
Table I. - The source, amplifiability and informativeness of microsatellite loci used for mapping.
Source No. tested No, amplifiable Heterozygosity inE. globulus parents
Neither One Both
EMERAa 20 15 4 4 7
EMCRCb 12 11 4 5 2
CSIROc 10 9 2 4 3
total 42 35 10 13 12
a)EMBRA=Eucalyptus grandis / E. urophylla - BRONDANI et al. (1998) b)EMCRC=E. globulus
(b) Map of the Female Parent
Group1 Group 4
Group 3
r""
807-2, 243-3, 238-4 17.2~
282-2
232-2,240-2 7 . 3 - 28.3~
4-1 4 . 9
-246-1, 282-2
4 . 9 -
16.3-81-1 EMBRA5 I EMBRA16
2.5"""",,-63-7 38.4- :
2 . 6
-29.6- 4.2~ 218-3
F"
30-1 8 . 6
-81-1,266-5,237-1
10.1-4 . 3 - 42-2 "-j230-8, 8.8
EMCRC1b 217-2 9.6
-10.0- 13,5- 249-3 .
EMBRA18 234-4,241-3
3 . 0 - EMCRC4 15"8
-
5.5-273-3", 23-3 '
3.7~ 63-2, [EMBRA11, 1.9]
202-3 5.7~ 215-5"
16.9- 8.9- 269-5', 237-3 ' GroupS
275-4',275-3 '
234-3
11.3-
7.3-37-2
230-14,282-1 6 . 1
-1"><
10,4- 81-4 5.7- 238-6
7.4- 23-1,212-1, [EMBRA7, 1.31
9.8-263-6 24.5- EMBRA3, 264-5,
6.7-25_11478-3,0.0 460-4,4-2
7 . 8 - 249-710.0 273-6
21.2-261-2
13.5-
19.2-EMCRC9
234-4 37-3-j262-3,15.8
Group 2 Group 6
Group 7 Group 8
CSIR003 256-1
7 . 1
-EMCRC7
19.51 2 . 9
-230-1"
273-2
8.5-
3.8-264-6 ' 20-4"-j285-3, 8.5
6 . 1 -25-2
23.2-34.7 - 42-5 "
8.4-5 . 7 - CSIRO 13',234-1', 285-2 290-1
42-3-j63-9,1.8
4.3-5 . 6 - 269-7,246-3
297-8
12.7-6 , 8 - 282-4 '
245-3-j269-3, 1.3 3 , 7 - 263-7
5 . 6 - 4-4-j218-2,0.6 18.2-3.5 273-5
14.3 - 262-2
19-3,28-8
15,1-212-6
37.1
-9.8-
I
CSIRO 10241-4,241_1
1
240,3,8.5 249-3 498-3,4.5Group 9
Group10
14.3
-f
212_ 5
238-1 5.8- 23-2
12.2-5-1
6.:3,-230-3
89-. 245-4-j234-7, 4.6
: (
238-2, 297-2 6 , 9
-297-5'
Group11
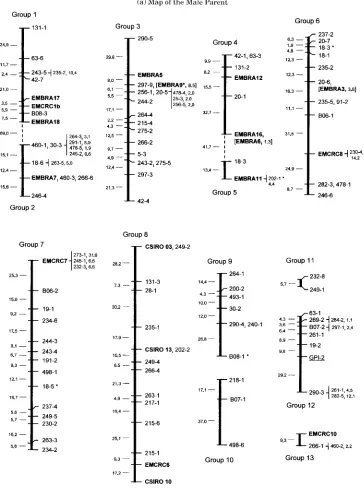
Figure 1. - Linkage maps ofEucalyptus globulus using RAPD and microsatellite markers.
Framework marker orders were determined using the program MAPMAKER at a LOD threshold of 3.0. Microsatellite loci are in bold text. Microsatellitcs that are not framework or accessory markers are bracketed and listed next to the nearest framework marker in the linkage group. RAPD loci amplified from DBC primers are listed by the DBC number followed by the ranked size of the amplified band from large to small. RAPD loci amplified with OP primers are listed using the OP designation followed by the ranked size of the amplified band. The isozyme locus, GPI-2 is underlin-ed. The distance between framework markers is in Kosambi centimorgans on the left-hand side of each linkage group. Markers that mapped to the same position are listed separated by a comma. Accessory markers that were placed at LOD 2.0 are located in smaller text alongside the nearest framework marker with the two point distance in centimorgans from this marker. Loci which had distorted segregation atcc:0.05 are followed by a single asterisk, those with distortion at thecc 0.01 level are followed by a double asterisk. A dashed line between linkage groups indicates linkage at a reduced LOD score threshold.(a) Map of the male (G164) parent,(b) Map of the female (KI2) parent.
ent 1:1 pattern with 173 inherited from the male parent and 153 inherited from the female parent, resulting in five markers segregating 1:1 per primer. Twenty loci were scored as being heterozygous in both parents and segregating in an apparent 3:1 pattern.
male E. globulus parent was heterozygous at 10 and the female parent heterozygous at 8 loci. This compares with the parent trees in BRONDANI et al. (1998) where the E. grandis parent is heterozygous at 10 and theE. urophylla parent at all 11 of the loci scored in common. Although seven CSIRO microsatellites were found to be potentially mappable, only the three fully informative loci (ie. segregating from both parents) were assay-ed for all progeny and usassay-ed in the linkage analysis. All EMCRC and EMBRA microsatellites that were found to be segregating from one or both parents were used for genotyping and linkage analysis. All of the 21 microsatellite loci that were scored for segregation in the progeny originate from species of Eucalyptus in the subgenus Symphyomyrtus except for CSIRO-03 which is from E. sieberi belonging to the subgenus Monocalyptus. The male parent was found to be heterozygous for 18 of these loci and the female parent heterozygous at 14 loci with 11 loci heterozygous in both parents. Of the total of 32 microsatellite markers obtained from the 21 loci only one (EMBRA 10) remain-ed unlinkremain-ed at LOD 4.9. Of the three enzyme systems found to have scorable activity using frozen adult leaf material (MDH, AAT and GPI) only glucosephosphate isomerase 2 (GPI-2, E.C. 5.3.1.9) was polymorphic. Ninety-one progeny were scored for polymorphism at GPI-2 which was heterozygous in the male parent only. Twenty percent of markers were scored for segregation in 94 progeny only with 35% scored in a non-over-lapping set of 71 progeny and 43% assayed across all 165 pro-geny.
Linkage Maps
For the male parent (GI64) a total of 192 loci segregating 1:1 were used in the initial linkage analysis. Thirteen linkage groups were defined over a range of LOD score values from 4.25 to 4.95 with 15 markers (7.6%) remaining unlinked. There were 101 framework markers ordered with 19 accessory mark-ers added to the framework map (Figure Iai. The 101 frame-work markers map to 90 positions covering a total distance of 1013 cM (Kosambi mapping function). There are 77 intervals between markers on the linkage groups with an average size of 13 cM and a maximum size of 37 cM. Linkage group frame-works varied in size from two positions covering 5.7 cM (Group 11) to 13 positions covering 195 cM (Group 8). Three groups (5, 11 and 13) consist of only two framework markers each. At LOD 4.20 twelve linkage groups form as a consequence of Groups 4 and 5 coalescing and forming a new interval of 41.7 cM whilst at LOD 4.0, Groups 1 and 2 form a single linkage group with a new interval of 69.0 cM (dashed lines on Figure
la.).Thus at LOD 4.0, eleven linkage groups form, which is the observed haploid number of chromosomes in Eucalyptus.
For the female parent (KI2) 167 loci segregating 1:1 were used in the analysis. These formed into 11 linkage groups from LOD score thresholds ranging from 4.35 to 6.15 with 15 mark-ers (approx. 9%) remaining unlinked at LOD 4.9. There were 97 framework markers at 75 positions on the linkage map of 11 groups with 11 accessory markers (Figure Ib). The framework spans 64 intervals covering 701 cM with an average interval size of 11 cM and a maximum interval size of 37.1 cM (Kosambi mapping function). Three groups (4, 9 and 11) are composed of two framework positions only. The largest group (Group 3) has 18 framework positions and covers 148 cM with the smallest group (Group 11) being 6.9 cM. Using a LOD of 4.3 with the group command of MAPMAKER, ten linkage groups form rather than 11, with Groups 4 and 5 coalescing to form a new interval of 38.4 cM (dashed line Figure Jb).
Linkage Group Homology
The presence of microsatellite loci mapped in both parents indicates there is homology between eight linkage groups from
the male parent with nine linkage groups from the female parent (Table 2). Groups 1 through to 8 are proposed as homo-logous between parents, with Group 9 of the female parent homologous with one end of Group 8 of the male parent. Homo-logy with four linkage groups of the E. grandin / E. urophylla maps of BRONDANI et al. (1998) is also suggested based on the sharing of EMBRA microsatellite loci (Table 2). In the four cases where more than one EMBRA microsatellite was found on an E. globulus linkage group, conservation of linkage of EMBRA loci was found between E. globulus and E. grandis / E.
urophylla. Of the 20 RAPD loci segregating in a 3:1 pattern, 11
were found to link(0; = 0.0001) to framework loci segregating 1:1 in both of the parental maps. This indicated homology be-tween five pairs of linkage groups of the two parents (Figure 2). Homology is also indicated for each of these pairs of linkage groups on the basis of sharing of microsatellite loci (Figure 2). There is also strong evidence for linkage of a 3:1 locus (226-3) to Group 10 of the male parent and an unlinked marker of the female parent.
Evidence for Linkage Based on Homology
In several instances EMBRA microsatellite loci that are present on one group of the E. grandis and/or E. urophylla maps of BRONDANI et al. (1998) are present on two E. globulus linkage groups (Table 2). Linkage Group 9 of the E. urophylla map of BRONDANI et al. (1998) has microsatellite loci which occur on both linkage Group 1 (EMBRA 17 and 18) and linkage Group 2 (EMBRA 7) of the male E. globulus parent (Table 2 and Figure lti),Similarly linkage Group 1 of both the E. gran-dis and E. urophylla maps has loci which occur on Group 4 (EMBRA 6, 12 and 16) and Group 5 (EMBRA 11) of the maleE.
globulusparent (Table 2 and Figure Ja).Ithas been noted that
at reduced threshold LOD scores linkage was detected between these two pairs of groups in the male parent (see Linkage Maps above). The evidence thus suggests that Groups 1 and 2 belong to a single linkage group and that Groups 4 and 5 similarly belong in a single group and that the arrangement of the EMBRA loci on these groups has been conserved between species.
Linkage Groups 1 and 2 of the female parent also share microsatellite loci (EMBRA 18 and 7) with Group 9 of E.
urophylla and linkage Groups 4 and 5 have microsatellite loci
(EMBRA 16 and 11) that map to Group 1 of both theE.grandis and E. urophylla maps (Table 2, Figure 1b). At a reduced thresh-old LOD score linkage is detected between Groups 4 and 5 of the female parent (see Linkage Maps above) but not, however, between Groups 1 and 2. Again the evidence supports conserva-tion in the arrangement of EMBRA loci on Groups 4 and 5. Linkage between Groups 1 and 2 in the female parent can be inferred from the linkage between the homologous groups in the male parent and from the arrangement of EMBRA micro-satellites in both the male parent andE. urophylla.
The three CSIRO microsatellites map to one group in the male parent (Group 8) but to two groups (Groups 8 and 9) in the female parent (Table 2, FigureLa,lb).Since the linkages in Group 8 of the male parent are of high likelihood and assuming the distribution of microsatellites is the same between the two parents it is likely that Groups 8 and 9 of the female parent belong to one linkage group. Ifall the linkages inferred from homology in both the E. globulus parents are taken as correct then the male parent would have eleven linkage groups and the female parent eight.
Segregation Distortion
Table 2. - Homology of linkage groups betweenE. globulus parent trees and betweenE. globulusandE. urophylla / E. grandisbased on the mapping of shared microsatellite loci.
Microsatellite Male parent Female parent E. urophylla/
locus linkage group linkage group E. grandisgroup"
EMCRClb
EMBRAI7 9
EMBRAI8 9
EMBRA7 2 2 9
EMBRA5 3 3 5
EMBRA9 3 5
EMBRA6 4
EMBRAI2 4
EMBRAI6 4 4
EMBRAII 5 5 I
EMBRA3 6 6 8
EMCRC7 7 7
CSIROO3 8 8
CSIROl3 8 8
CSIROlO 8 9
") E.urophylialE.grarulis linkage group no. fromBI(()NIlA~[et a1. (1998)
"-
Group 8Group 1
Group 7 CSIRO 03
131-1
"" 269-8-.. 238-4 Group 3 ~
EMCRC7 131-3
297-7
,.
131-1
EMBRA5 B06-2 285-3 25-2
-,
20-4EMCRC1b CSIRO 234-7,
234-4 202-2
EMBRA18 202-1 13 285-2
215-4 EMCRC4
212-2
498-1
-"18-6 ...
18-2 19-3,28-8
'"",00'
r""
25-1
.;
212-6 [EMBRA71EMBRA7, 297-4
266-6 275-7 234-3
cJ
215-1!
Group 2
9
Figure2. - Linkage of 3:1 segregating RAPD markers to loci on both parental maps. Linkage group homology inferred from 3:1 loci is supported in each case by the mapping of one or more fully informative microsatellite loci. RAPD loci segregating 3: 1 are located between each pair of homologous linkage groups and numbered in bold text along with framework microsatellite loci. Framework RAPD loci which were most strongly linked to each 3:1 locus are shown in plain text. Otherwise coding ofRAPDand microsatellite loci is as per(igure 1.
and include three framework markers (Figure La; asterisked markers). With 28 'independently segregating positions' on the map of the male parent (sec Materials and Methods), 1.4 regions are expected to have distorted segregation at(X = 0.05.
There is thus approximately three and a halftimes the number
of regions expected to have distortion at (X = 0.05. There were
no markers with segregation distortion at(X=0.01 segregating
segregation distortion at a = 0.05 is 9.6 and based on this method of assessment there would be fewer markers observed to have distorted segregation than expected.)
In the overall data set of the female parent there are twenty-three markers with distorted segregation at a = 0.05. These map to seven regions and include 17 framework markers
(Figure lb, asterisked markers). The female parental map of
701 eM has a total of 19 'independently segregating positions' with 0.95 regions expected to have segregation distortion at a
=
0.05. There are thus seven times the expected number of regions with distorted segregation at a=
0.05. There are eight markers overall with distorted segregation at a threshold of a = 0.01. These map to four regions with three being frame-work markers on linkage Group 8 and one frameframe-work marker on each of Groups 3, 4 and 5 (Figure 1b, double asterisks). Since there are 0.19 regions expected to have distorted segre-gation at a=
0.01 there are approx. 21 times the expected number of regions with segregation distortion at a=
0.01. (Assuming that segregation of each marker results from random and independent events, then 8.35 markers would be expected to have segregation distortion at IX=
0.05 and 1.67markers at a =0.01. Using this assumption there are 2.8 times the expected number of loci with distortion at(X = 0.05 and 4.8
times the expected number ofloci with distortion at(X
=
0.01.).For the regions with segregation distortion at a =0.01 in the female parent the region on Group 3 and the region on Group 8 have markers which have been scored on the full array of prog-eny and there are linkages in repulsion with markers that also have distorted segregation. Thus it is extremely unlikely that the segregation distortion is due to 'unreliability of RAPD markers', at least for these two regions. Lone markers, both of which gave strong unambiguous banding, represent the other two regions with strong distortion in the female parent. It
would thus appear very likely that the observed distortions are not artifactual and the excess segregation distortion requires explanation.
All marker loci with significant segregation distortion were found to have segregation ratios between 1:1 and 2:1, as distinct from the 3:1 ratio expected from an unlinked duplication of a locus. None of the linkages involving framework markers with segregation distortion were found to have probabilities (of linkage) which were unduly affected by the distortion. In the most severe case on Group 8 of the female parent (Figure 1b), RAPD loci 42-5 and 20-4 are 23.2 eM apart. For two loci with the same degree of distortion, the probability of linkage at this level or closer is 7.8 x 10⁻¹⁰, which although 70 times larger
than two loci segregating in a perfect 1:1 ratio, still provides very strong evidence for linkage. The two point LOD score calculated using 8=0.5 for no linkage was 11.05 and an adjust-ed LOD score of 10.96 was obtainadjust-ed using 8=0.455.
Estimates of Genome Size
Some idea of the completeness of the two maps overall can be gained from the fact that 32 out of 33 microsatellite and allo-zyme markers were placed into linkage groups with only one marker (EMBRA 10) remaining unlinked at LOD 4.9. For the male parent all 19 of the non-RAPD markers were placed into linkage groups and for the female parent one marker out of 14 remained unlinked at LOD 4.9. A method of estimating the overall length of the genome as detailed in VALLE.JOS et al. (1992) was used. The following formula was used for estima-tion: G
=
2MXIK where G is the estimate of genome size, M is the no. of locus pairs, X is the largest estimated map distance value among the K observed no. of locus pairs that are linked with a LOD score of Z or greater (Z=4.9). This method gave anestimated genome length for the male parent of 1277 eM with 79%of the genome covered by the framework map. The female parent was estimated to have a genome of size 1133 eM with 62%of the genome estimated to be covered by the framework map.
Discussion
Utility of Microsatellite Loci
Microsatellite loci are extremely useful for the identification of linkage group homology and for enabling the integration of linkage information(DIBet al., 1996; DIETRICH et al., 1996). In this study linkage analysis of eleven fully informative micro-satellite loci has enabled the identification of homology be-tween eight (pairs of) linkage groups from the RAPD maps of the parents. In addition homology with four linkage groups of
E. grandis IE. urophylla have been identified based on the
mapping of eleven EMBRA microsatellite loci (BRONDANI et al., 1998). In all cases where it could be examined, linkages be-tween EMBRA microsatellites that were found in E. grandis I
E. urophylla were conserved in E. globulus. The close
corre-spondence of microsatellite distributions may be a reflection of the fact that all three of these species belong to the subgenus
Sympliyomyrtus, although E. globulus belongs in a different
section to E. grandis and E. urophylla. In total 21 micro-satellite loci from five different species of Eucalyptus have been placed on the two parental maps detailed here.
A potential outcome of identifying linkage group homology between maps is that the arrangement of loci on one map can be used to infer linkage between groups on the second map. In this study such homology has been used to support several weak linkages found between linkage groups. The two lines of evidence lend support to one another to indicate that these linkages are likely to be correct. Importantly homology was based on a between species alignment of micro satellite loci. This illustrates the potential power of microsatellites to draw upon mapping information from both within and between species to aid in map construction. This information could be used in strategies to search for markers to fill in gaps in a linkage map eg. using bulked segregant analysis (MICHELMORE et al., 1991).
Using homology to infer linkage has had a considerable influence on map construction in this study, impacting on the number of linkage groups and the structure of the maps. If all the linkages inferred from homology in both the E. globulus parents are taken as correct then the male parent would have eleven linkage groups and the female parent eight. Cytological studies indicate that n = 11 in Eucalyptus (POTTS and WILT-SHIRE, 1997). So for the male parent, eleven linkage groups matches the number expected based on chromosome counts. However for the female parent there are three linkage groups less than expected from chromosome counts.Itis likely that by scoring additional RAPD markers inherited from the female parent these three linkage groups would be defined, especially since some of the 15 unlinked markers (approx. 9%) probably belong to these three groups.
Mapping in Eucalyptus Using an Intraprovenance Cross
origi-nate from the same island provenance, it might have been expected that map construction would be hampered due to low genetic divergence of the parents and a consequent paucity of RAPD loci segregating in a fully informative manner. However if there is low genetic divergence between the two parents in this study it has not proven to be a significant hindrance and has been overcome by using the easy to implement strategy of screening a large number of RAPD primers and selecting a subset which detect a maximum number of polymorphisms. Approximately one in every six primers screened was selected for genotyping, yielding five loci segregating 1:1 on average per selected primer. This compares with GRATTAl'AGLIA and SEDEROFF (1994) where half of the screened primers were used for genotyping, yielding an average of 3.7 markers per primer and VERHAEGEN and PLOMION (1996) where almost
%
of screen-ed primers were usscreen-ed for genotyping, yielding 3.2 markers per primer. In both these cases anE. grandis x E. urophylla inter-specific cross was used.Segregation Distortion
Commonly, the frequency of segregation distortion expected due to chance is calculated using the total number of markers that have been scored in the data set. However, since linked markers are not independent, a more meaningful method of calculating the degree of expected segregation distortion for linkage maps may be to calculate the expected number of regions with segregation distortion. The number of linkage groups and their sizes determines the expected number of regions. In this study this has been shown to provide a differ-ent basis on which to judge the expected extdiffer-ent of segregation distortion. For example in the male parent at a
=
0.05, the ratio of the observed to expected was 3.5 (somewhat more than expected) whilst for calculations based on the number of mark-ers the ratio of observed to expected is 0.625 (fewer than expected). The method of calculating the extent of segregation distortion can thus have a significant bearing on the assess-ment of whether excess distortion is occurring.In this study it has been found that the number of regions with significantly distorted marker ratios in the map of the female E. globulus parent in particular is much greater than would be expected by chance alone. This greater than expected frequency/degree of skewing of Mendelian segregation ratios is not uncommon in plants (ZAMlR and TADMOR, 1986; BRADSHAW and STETTLER, 1994), with Eucalyptus being no exception (BYRNE et a!., 1994; VAILLANCOURT et a!., 1995b; VERHAEGEN and PLOMlON, 1996; MARQUES et al., 1998). A number of selection based genetic mechanisms have been suggested to explain these distorted marker ratios. These include incompatibility systems (GEBHARDT et a!., 1991), preferential chromosome loss (VAILLANCOURT and SLINKARD, 1992), expression of genetic load (SORENSEN, 1969; BRADSHAW and STETTLER, 1994; VAILLANCOURT et a!., 1995b), meiotic drive (GILLET and GREGORTUS, 1992) and haploid expressed deleterious alleles. Itis to be noted however that the four regions with strong distortion (a
=
0.01) in the female parent in this study do not align with regions of distor-tion in the homologous linkage groups of the male map. This excludes incompatibility as an explanation since incompatibili-ty systems in higher plants usually operate to exclude fertilisa-tion by the male or in the case of rare haplo-homophasic systems would operate to cause distorted segregation in both sexes (GILLET and GREGORIUS, 1992). If genetic load is consider-ed as an explanation for the observconsider-ed segregation distortion then a deleterious recessive allele must be segregating from the parent with the distortion. The second parent could be either heterozygous or homozygous for the deleterious recessive. However the observed non-alignment of distorted regionsexcludes the possibility that both parents are heterozygous for a deleterious recessive allele at the same locus since the genet-ic maps of both parents would be expected to have distorted segregation in the same region. To invoke genetic load as an explanation the male parent in particular would need to be homozygous for deleterious recessive alleles at several loci, which is probably unlikely, as it is a naturally established tree. Genetic load would therefore appear not to be a satisfying explanation for the segregation distortion.
Chromosome loss is also an unlikely explanation for the distortion as it is usually only considered in cases where one parent is an interspecific or intersubspecific hybrid. Itis to be noted however that hybridisation is common in the genus Eucalyptus (POTTS and WILTSHIRE, 1997), and it is not known if there are small chromosomal rearrangements between and within species. Meiotic drive and haploid expressed deleterious alleles remain as possible explanations for segregation distor-tion of any region since there is no evidence for selecdistor-tion operating at any particular stage of development. Other models based on post-fertilisation selection, ego selection for co-adapted allelic combinations, might also explain the skewed segregation ratios.
Conclusion
RAPD maps were readily constructed for two parents of an intraprovenance cross ofE. globulus demonstrating the utility of RAPD markers for map construction in Eucalyptus from intrapopulation crosses. Microsatellite markers that originate from several Eucalyptus species have been mapped enabling the identification of homologous linkage groups betweenE. glo-bulus and E. grandis / E. urophylla. The conservation of linkage of microsatellite loci and transfer of loci between crosses in different species indicates the potential for the construction of a consensus map based on microsatellites. Segregation distor-tion in the genome was observed to a greater extent than expected by chance and a biological cause is suspected although several of the usual genetic mechanisms to account for the distortion appear to be unlikely.
Acknowledgments
We would like to thank GRRG DUTKOWSKI, PAUL TILYARD, ,JOHN OWEN, IAN BAIL and CARL GROSSRR for collecting leaf material, DOROTHY STRANR for assistance with the EMCRC microsatellites, GAVIN MORAN for assistance with the CSIRO microsatellites and BRAD POTTS for comments on the manuscript. We also acknowledge CSIRO and North Forest Products for permission to use the mapping population, the Australian Research Council for providing a scholarship for PB. and the Cooperative Research Centre for Sustainable Production Forestry for funding the project.
References
BRADSHAW,H.D. and STETTLER, R. F.: Molecular genetics of growth and development in Populus. II. Segregation distortion due to genetic load. Theor. Appl, Genet. 89: 551-558 (1994). - BRONllANl, R. P
v.,
BRONDANl, C., TARCHINl, R. and GRATTAPAGLIA, D.: Development, characterization and mapping of microsatel1ite markers in Eucalyptusgro.ndis and E. urophvlla. Theor. Appl. Genet. 97: 816827 (1998).
-BYRw;, M., MARQURZ-GARCTA, M. 1., URRN, '1', SMITH, D. S. and MORAN, G. F.: Conservation and genetic diversity of microsatollitc loci in the genus Eucalyptus. Aust. ,J.Bot. 44: 331-341 (1996). - BYRNE, M., MORAN, G. F., MURRELL,J. C. and TIBBITS,W.N.: Detection and inheritance of RFLPs in Eucalyptus nitens. Heredity 73: 1828 (1994). -BYRNE, M., MURRELL,J.C., ALLEN, B. and MOHAN, G. F.: An integrated genetic linkage map for eucalypts using RFLP, RAPD and isozyme markers. Theor. Appl. Genet. 91: 869-875 (1995). - DALE, G. and CHAPARRO,J.: Integration of molecular markers into tree breeding and improvement programs. In: DIETERS, M.J. et al. (Eds.): Tree
micro-satellites. Nature 380: 152-154 (1996). - DIETRICH,W.F. et al.: A com-prehensive genetic map of the mouse genome. Nature 380: 149-152 (1996). - DoYL~,J. J. and DOYLE, J. L.: Isolation of plant DNA from fresh tissue. Focus 12: 1:3-15 (1990). - ELDRIDGE, K, DAVITlSON, J., HARWOOD, C. and VAN WYK, G.: Eucalypt domestication and breeding. Oxford University Press, New York (1993). - GEBHARDT, C. et al.: RFLP maps of potato and their alignment with the homoeologous tomato genome. Theor. Appl. Genet. 83: 49-57 (1991). - GILLET, E. and GREGORlUS, H.-R: What can be inferred from open-pollination progenies about the source of observed segregation distortion? - A case study in
Castanea sativa MILL. Silvae Genetica 41: 82-87 (1992). - GIlATTA-PAGLIA, D.: Opportunities and challenges for the incorporation of genomic analysis in Eucalyptus breeding. In: Proc. IUFRO Conf. On Silviculture and Improvement of Eucalypts, Vol. II, pp. 129-136. Salva-dor, Brazil, 24 to 29 August, EMBRAPA (1997). - GRATTi\PAGLIA, D. and S,:m:RoFF, R: Genetic linkage maps of Eucalyptusgrandisand
Eucalyp-tus uroph.yllti using a pseudo-testcross: mapping strategy and RAPD markers. Genetics 137: 1121-1137 (1994). - MRR, R J., JARVIS, S. F. and GODDARD, M. E.: The usc of markers in tree breeding programs. In: DIETERS, M. J. et al. (Eds.): Tree improvement for sustainable tropical forestry. pp. 498-505. Proc. QFRI-IUFRO Conference, Queensland, Aus-tralia (1996). - LANDER, E. S., GREEN, P, ABRAHAMSON, J., BAllLOW, A., DALY, M. J., LINCOLN, S. E. and NEWBURG, L.: MAPMAKER:An interac-tive computer package for constructing primary genetic linkage maps of experimental and natural populations. Genomics 1: 174-181 (1987).-LINCOLN, S., DALY, M. and LANDEll, E.: Constructing genetic maps with MAPMAKERlEXP 3.0. Whitehead Institute Technical Report, 3ededn. Cambridge, Mass. (1992). - MARQUES, C. M., ARAU,JO, J. A., FERREIRA,.J.
G., WHETTEN, R, O'MAIU:V, D. M., LILI, B.-H. and SEDEROFF, R: AFLP genetic maps of Eucalyptus globulus and E. tereiicorriis. Theor. Appl. Genet. 96: 727-737 (1998). - MICllLcLMOIlE, R
w.,
PARAN, 1. and MSSELI, R V: Identification of markers linked to disease-resistance genes by bulked segregant analysis: a rapid method to detect markers in specific genomic regions by using segregating populations. Proc. N atl.Acad. Sci. USA 88: 9828-9832 (1991). - MORAN, G. F. and B,:LL, J. C.:
Eucalyptus. In: TANKSLEY, S. D. and ORTON, T. J. (Eds.): Isozymes in plant genetics and breeding. Part B. pp. 42:3-441. Elsevier Science Publ., Amsterdam (1983). - POTTS, B. M. and WILTSHIRE, R J. E.: Eucalypt genetics and genecology. In: WILLIAMS, J. and WOINARSKI,.J.
(Eds.): Eucalypt ecology: Individuals to ecosystems. pp. 56-91. Cam-bridge University Press, CamCam-bridge, UK (1997). - SKABO, S., VAILLAN-COURT, R E. and POTTS, B. M.: Fine-scale genetic structure of
Eucalyp-tus globulus ssp. globulus forest revealed by RAPDs. Aust.•J.Bot. 46: 583-594 (1998). - SORENSEN, F.: Embryonic genetic load in coastal Douglas-fir, Pseudotsuga menziesii var 'menziesii'. Am. Nat. 103: 389-398 (1969). - VAILLANCOURT, R E., POTTS, B. M., MANSON, A., ELDRIDGE, T.and REID,.J.B.: Using RAPDs to detect QTLs in an inter-specific F2hybrid of Eucalyptus. In: POTTS, B. M. et al. (Eds.): Eucalypt plantations: Improving fibre yield and quality. pp. 430-433. Proc. CRC-IUFRO Conf., Hobart, Australia (1995b). - VAILL~'1COLJRT,R E., POTTS, B. M., WATSON, M., VOLKER, P W., HODGE, G. R, REITl, .J.B.and WEST, A.K:Detection and prediction of heterosis in Eucalyptus giobulus, For. Gen. 2: 11-19 (1995a) - VAILLANCOURT, R E. and SLI.'1KAIUl, A. E.: In-heritance of new genetic markers in lentil (Lens M[[~LER).Euphytica 64: 227-236 (1992). - VALLEJOS, C. E., SAKIYAMA, N. S. and CHASE, C. D.: A molecular marker-based linkage map of Phaseolus vulgaris L. Genetics 131: 733-740 (1992). - VERHAEGEN, D. and PLOMTON, C.: Genetic mapping in Eucalyptus urophylla and Eucalyptus grandis using RAPD markers. Genome 39: 1051-1061 (1996). - WILLIAMS, C. G.: Beyond marker-assisted selection: Use of genomic mapping in breeding strategy. POTTS, B.M. et al. (Eds.): Eucalypt plantations: Improving fibre yield and quality. pp. 438-442. Proc. CRC-IUFRO Conf., Hobart, Australia (1995). - WILLIAMS, .J. G. K, HANAfo'I':Y, M. K, RM~'\LSKI,J. A. and TINGEY, S. V: Genetic analysis using random amplified polymorphic DNA markers. Methods. Enzymol. 218: 704-740 (1993). - ZAl\lIR, D. and TADMOR, Y: Unequal segregation of nuclear genes in plants. Bot. Gaz. 147: 355-358 (1986).
Buchbesprechung
Grundlagen und Methoden der Pflanzensystematik.
UTB fur Wissenschaft: GroBe Reihe. Von O. SI']{]NG und H. BUSCHMANN. 1998. Verlag Quelle und Meyer, Wiesbaden. ISBN 3-8252-8176-1. 139 Seiten mit zahlreichen Abbildungen und Tabellen. DM 34,80.
Die biologische Systcmatik bietet wichtige Grundlagen fur aile naturwissenschaftlich ausgerichtctcn Fachgebiete. Diese wiederum haben durch eigenen Erkenntnisgewinn die Ent-wicklung der Systematik nachhaltig beeintlusst und gepragt. Systematik lasst sich heute als die Wissenschaft definieren, "die sich mit der Vielfalt der Organismen, ihrer Differen-zierung, ihrer verwandtschaftlichen Beziehungen und ihrer entwicklungsgeschichtlichen Entstehung befasst". Im ersten Teil des Buches gehen die Autoren auf die historische Entwick-lung der Systematik ein und schildern verschiedene Artkon-zepte sowie die Prozesse der Artentstehung. AuBerdem werden Nomenklatur und Taxonomie einschlieBlich ihrer Regeln crlau-tert. Dcr zweite Teil des Buches gibt einen Ubsrblick uber praktische Methoden zur Erfassung von taxonomischen
Merk-malen bei Organismen. Hierbei wird ein Bogen gespannt von den eher traditionellen, morphologischen, anatomischen und cytologischen Merkmalen, uber strukturelle Mcrkmale der Chromosomen und uber Kreuzungsstudien, uber die Periode der Chemosystematik bis hin zur makromolekularen Periode. Die Bedeutung molekularer Techniken zum Nachweis von Proteinen und Nuklcinsauren und ihr Einsatz in der modernen Systematik werden ausfuhrlich dargestellt. In einem letzten Kapitel wird dcr Frage nachgegangen, wie sich die Fulle der inzwischen vorliegenden Daten von den verschiedensten Merk-malen im Hinblick auf eine phylogenetische Interpretation aus-werten lassen. Ein Literaturverzeichnis (8 Seiten), ein Glossar (3 Seiten), eine kurze Ubersicht uber einige phylogenetische Fachbegriffe, die haufig in der englischsprachigen Literatur verwendet werden, sowie ein Index beschlieBen das Buch. Die viclcn instruktiven Zeichnungen, SIW-Abbildungen und uber-sichtlichen Tabellen sind didaktisch gut gewahlt, Als Ein-fuhrung in die Systematik kann das Buch empfohlen werden.
B.R.STEPHAN(Grosshansdorf)
Herausgeberin: Bundesforschungsanstalt fUr Forst- und Holzwirtschaft: Schriftleitung: Institut fur Forstgenetik und Forstpflanzenziichtung, Siekerlandstrasse 2, D-22927 Grosshansdorf - Verlag:.J.D. Sauerliinder's Verlag, Finkenhofstrasse 21, D-60322 Frankfurt a. M. - Anzcigcn-verwaltung: J. D. Sauerlanders Verlag, Frankfurt am Main. - Satz und Druck: Graphische Kunstanstalt Wilhelm Herr, D-35390 Giessen
Printed in Germany.