DOI 10.1007/s10518-012-9348-9
O R I G I NA L R E S E A R C H PA P E R
Tsunami damage to coastal defences and buildings in the
March 11th 2011 M
w9.0 Great East Japan earthquake
and tsunami
Stuart Fraser · Alison Raby· Antonios Pomonis· Katsuichiro Goda ·Siau Chen Chian ·
Joshua Macabuag· Mark Offord· Keiko Saito · Peter Sammonds
Received: 8 September 2011 / Accepted: 8 March 2012 © Springer Science+Business Media B.V. 2012
Abstract On March 11th 2011 a Mw9.0 mega-thrust interface subduction earthquake, the Great East Japan Earthquake, occurred 130 km off the northeast coast of Japan in the Pacific Ocean at the Japan Trench, triggering tsunami which caused damage along 600 km of coastline. Observations of damage to buildings (including vertical evacuation facilities) and coastal defences in T¯ohoku are presented following investigation by the Earthquake Engi-neering Field Investigation Team (EEFIT) at 10 locations in Iwate and Miyagi Prefectures. Observations are presented in the context of the coastal setting and tsunami characteris-tics experienced at each location. Damage surveys were carried out in Kamaishi City and Kesennuma City using a damage scale for reinforced concrete (RC), timber and steel frame
S. Fraser (
B
)Massey University/GNS Science Joint Centre for Disaster Research, Massey University Wellington Campus, P.O. Box 756, Wellington, New Zealand
e-mail: S.A.Fraser@Massey.ac.nz A. Raby
School of Marine Science and Engineering, Plymouth University, Plymouth, UK A. Pomonis·K. Saito
Cambridge Architectural Research Limited, Cambridge, UK K. Goda
Department of Civil Engineering/Cabot Research Institute, University of Bristol, Bristol, UK S. C. Chian
Department of Engineering, University of Cambridge, Cambridge, UK J. Macabuag
Building Design Partnership, London, UK M. Offord
Sellafield Ltd, Warrington, UK P. Sammonds
buildings adapted from an earlier EEFIT tsunami damage scale. Observations show that many sea walls and breakwaters were overtopped, overturned, or broken up, but provided some degree of protection. We show the extreme variability of damage in a local area due to inundation depth, flow direction, velocity variations and sheltering. Survival of many RC shear wall structures shows their high potential to withstand local earthquake and significant tsunami inundation but further research is required into mitigation of scour, liquefaction, debris impact, and the prevention of overturning failure. Damage to steel and timber build-ings are also discussed. These observations are intended to contribute to mitigation of future earthquake and tsunami damage by highlighting the key features which influence damage level and local variability of damage sustained by urban coastal infrastructure when subjected to extreme tsunami inundation depths.
Keywords Great East Japan tsunami·Vertical evacuation·Field observations· Tsunami fragility·Flow velocity estimates·Damage scale
1 Introduction
On March 11th 2011 at 14:46 local time (05:46 GMT), a Mw9.0 mega-thrust interface sub-duction earthquake, officially named as the Great East Japan earthquake, occurred 130 km off the northeast coast of Japan in the Pacific Ocean at the Japan Trench, triggering tsunami that caused damage along a 600 km stretch of coastline in the T¯ohoku region. Coupled co-seismic rupture (lasting approximately 5 min) of several major fault segments in an area of prior slip deficit resulted in a large fault plane 400–500 km in length by 100–200 km in width (Geo-Spatial Information Authority of Japan 2011a;Shao et al. 2011). The rupture process resulted in significant deformation of the sea bed over a large area, which generated the tsunami. This deformation occurred as close as 70 km to the T¯ohoku coastline, leading to relatively short tsunami arrival times in the three worst-affected prefectures: Iwate, Miyagi, and Fukushima.
Tide gauge records show that the first small tsunami waves with amplitudes of tens of centimetres arrived at the coastline within 10 min of the earthquake (Okumura 2011), while the most damaging waves arrived after only 25 min in some locations in Iwate Pre-fecture. Maximum run-up of 40.545 m was recorded at Omoe Aneyoshi in Miyako City (The 2011 Tohoku Earthquake Tsunami Joint Survey Group 2011), while inundation heights of between 5 and 15 m occurred in many locations. At Onagawa Town, Miyagi Prefec-ture, the tsunami had a maximum inundation height of 18.4 m (Takahashi et al. 2011a) and resulted in overturning of reinforced concrete (RC) buildings, discussed in Sect.6.6. Over 1 million buildings suffered earthquake or tsunami damage and as of the same date 19,185 people are confirmed dead or remain missing (National Police Agency of Japan 2012).
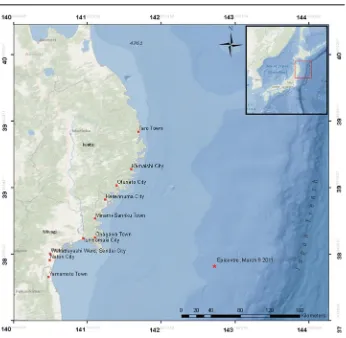
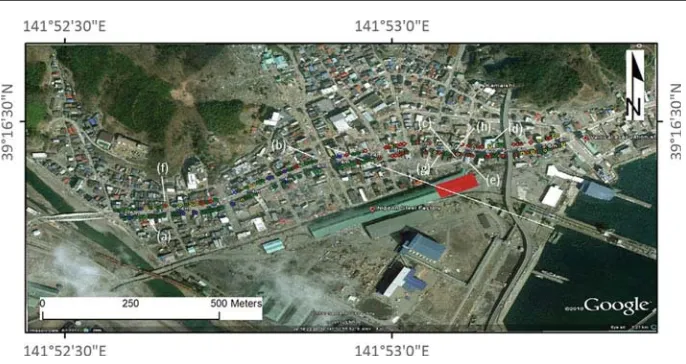
Fig. 1 Locations of tsunami damage investigations carried out by EEFIT, with an indication of the extent of plains and rias coastline
A post-tsunami field mission was conducted by the authors representing the Earthquake Engineering Field Investigation Team (EEFIT) of the Institution of Structural Engineers (IStructE) between May 28th and June 3rd 2011 in Iwate and Miyagi Prefectures. Our inves-tigations covered the coastline between Tar¯o Town in the north and Yamamoto Town in the south (Fig.1), while observations of ground shaking damage (Goda et al. 2012) also incorpo-rated inland areas. The full mission field report (EEFIT 2011) presents comprehensive field investigation results from all locations visited and includes observations on ground shaking, tsunami damage, and emergency response and recovery.
[image:3.595.126.472.129.467.2]and presentation of observations. We make no assumptions of building damage or tsunami characteristics where it was apparent that post-event debris clearance had taken place.
Post-event damage observations such as those presented here are vital to record and understand the performance of defence infrastructure and buildings for loss estimation and development of effective mitigation strategies. Inundation depth and velocity data must be collected in the field to aid validation of numerical tsunami inundation modelling, and these data combined associated assessments of damage are used in establishing tsunami fragility curves, such as in the methods applied byKoshimura et al.(2009). The objective of our field mission was to record and present such observations to supplement findings by Japanese and international researchers, and contributed to the already existing body of data on tsunami fragility in Japan (e.g.Hatori 1984andShuto et al. 1986, inShuto 1993). Primary field observations presented in this paper, notably building damage surveys relating inundation depth to damage level enabled us to refine the EEFIT tsunami damage scale for reinforced construction (EEFIT 2006) and propose new damage scales for steel frame and timber frame buildings for use in damage assessment following future events (Tables3,4,5).
The paper provides an overview of the March 11th tsunami, its severity and effects (Sect.2), and a brief comparison with previous tsunami in T¯ohoku (Sect.3). Section4describes coastal defences in place in the T¯ohoku region, while Sect.5briefly discusses the provision of verti-cal evacuation structures in this region and their efficacy on March 11th. EEFIT observations are then discussed for 10 locations (ordered from north to south) in Sect.6, where we present details of 2 building damage surveys, 3 updated tsunami damage scales (revised scale for RC, new scales for steel and timber frame buildings) and further interpretation of our obser-vations. In order to place the damage in context with the characteristics and severity of the event, damage observations of defences and buildings in each location are preceded by a short description of the location and summary of casualty figures. A summary of observations is provided in Sect.7, with conclusions on the use of such information in enhancing tsunami mitigation strategies in the future.
2 The Great East Japan tsunami of March 11th 2011
Following the occurrence of the Mw9.0 earthquake at 14:46, wave heights of 6.7 m (recorded at 15:12, 18 km off Kamaishi) and 5.6 m (at 15:14, off the coast of Rikuzentakata) were detected by offshore GPS tsunami monitoring buoys (Fujita 2011). Considering the effects of shoaling as the wave enters shallow water, this suggested that the tsunami wave height could be up to 10 m once it reached the shoreline. Within 10 min of the earthquake the initial waves, only tens of centimetres in height, had reached 3 tide gauges between Choshi, Ibaraki Prefecture and Miyako, Iwate Prefecture (Okumura 2011). More significant waves exceeding 3 m in height began to reach the coast from about 25 min after the earthquake (e.g. ¯Ofunato City,IOC/UNESCO 2011). The tsunami caused damage along 600 km of coastline, with estimates of area inundated between 400 and 500 km2(300 km2of this in Miyagi Prefecture) and affecting some urban areas particularly badly—Ishinomaki City and Yamamoto Town both suffered inundation of 46 % of their total area (CEDMHA 2011).
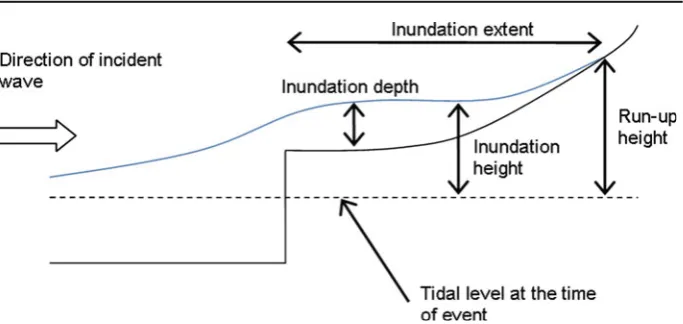
Fig. 2 Schematic diagram defining tsunami terminology used in this paper (afterPort and Airport Research Institute 2011)
steep topography except where tsunami propagates up a river valley or channel. In contrast, the coastal plains are extensive areas of flat land often used for agriculture, and experienced substantially lower run-up values but greater inundation extent (up to 7 km in this event; Geo-Spatial Information Authority of Japan 2011b), as there is less steep topography to restrict tsunami flow. Tsunami terminology used in this paper is defined in Fig.2.
The location of greatest run-up and inundation height occurred in the rias: the maximum recorded value of tsunami inundation height was 40.545 m at Omoe Aneyoshi (The 2011 Tohoku Earthquake Tsunami Joint Survey Group 2011). This exceeds the previous highest ever recorded wave height in Japan, of 38.2 m at Ryori Bay, Iwate Prefecture in 1896 (United States Geological Survey 2011). Additional observations of inundation height greater than 30 m were recorded to the north of Tar¯o Town, in Miyako City. Elsewhere in the rias coastline, inundation height of around 10 m was common and our surveys in Kamaishi City showed inundation heights of 7.0 to 9.0 m (Sect.6.2). Inundation height of 9.5 m was measured in the inner port area of ¯Ofunato City and in Onagawa Town, inundation height of 14.8 m was measured in the port area and 18.4 m immediately to the west of the port (Takahashi et al. 2011a). The coastal plains experienced inundation heights of 4.1–5 m in the port of Ishinomaki City, 7.3–8.0 m in Sendai Port and 9.7 m at Arahama Beach. Inundation height was 5.7 m at Sendai Airport terminal (Port and Airport Research Institute 2011).
3 Comparison of tsunami with past significant events
There have been several previous catastrophic tsunami in the T¯ohoku region. The Sanriku coast (roughly corresponding to the extent of the rias, north of Ishinomaki City) has suffered repeated damage, particularly from the local 1896 Meiji-Sanriku (22,000 deaths;Tanaka et al. 2008), 1933 Showa-Sanriku (3,064 deaths;Takata 2009) earthquakes and the distal 1960 Chilean earthquake (142 deaths;Takata 2009). During each of these events, Iwate Pre-fecture experienced tsunami heights exceeding 10 m, and the 1896 event was comparable with the 2011 event (Earthquake Research Institute 2011). Minor damage was recorded in ¯Otsuchi and Kuwagasaki (near Miyako City) due to the 1700 Cascadia event (Atwater et al. 2005).
[image:5.595.129.471.133.295.2]Therefore, in Miyagi and Fukushima Prefectures, inundation heights of 4–7 m (and greater) experienced on March 11th 2011 far exceeded experience of the last 120 years. However, tsunami further back in history are believed to have occurred with tsunami heights similar to the Great East Japan tsunami. In the 1611 Keicho earthquake, which caused fatalities estimated up to 5,000 mostly due to tsunami (Utsu 2002), a 6–8 m high wave devastated the Sendai Plain.Satake et al.(2008) modelled the 869 Jogan earthquake and tsunami, gener-ating estimates of inundation extent of 1–3 km inland on the Sendai and Ishinomaki Plains, and 1.5–2 km inland further south in Fukushima Prefecture. These are comparable to, or exceed the inundation of the Great East Japan tsunami. It is possible that the 869 earth-quake had a similar location and magnitude to the March 11th earthearth-quake (Simons et al. 2011).
4 Coastal defences in Japan
Japan has a very high proportion of coastline to unit area of land and has relied heav-ily on a limited amount of flat coastal land for development, with 75 % of its assets in the 10 % of the total land area that is flat coastal plain (Kokusai Kogyo Group 2011). In the region affected by the Great East Japan tsunami, four cities are classified as ‘major ports’ (Miyako, Kamaishi, ¯Ofunato, and Ishinomaki) and Sendai-Shiogama as one of Japan’s 23 ‘specially designated major ports’ serving international marine networks. The ports are centres of production and import/export, passenger transport hubs, and provide business activities, housing and recreation and as a result, tsunami damage to ports has a knock-on effect beyknock-ond the immediate locatiknock-on. In additiknock-on to this importance of coastal land and facilities, the frequent occurrence of typhoons, storm surges and tsunami led to the development in Japan of some of the most extensive coastal defences in the world. Typical coastal structures of jetties, groynes, and breakwaters (both detached and submerged) may be seen along the coastline, in addition to significant land reclamation projects. Tsunami-specific breakwaters and walls have been built along vulnerable coastlines, often at those locations badly affected by previous events, such as Tar¯o Town, Kamaishi City and ¯Ofunato City.
On March 11th a total of 8,500 m of breakwaters collapsed (Yagyu 2011), including the newly-completed tsunami breakwater in Kamaishi City designed to withstand a tsunami of 5–6 m. Many coastal protection structures along the Sanriku coast were designed based upon the Meiji Sanriku tsunami, which was considerably smaller than the Great East Japan 2011 event. As a result they were not effective in stopping the waves from overtopping, and in many situations suffered catastrophic failure.Takahashi et al.(2011b) suggested that in future, rather than building even bigger structures, coastal defences should remain of similar size, but with special attention given to their stability in order that they survive even a huge tsunami despite being overtopped. The rationale for this is that a defence that is overtopped but survives is better than no defence at all. The observed performance of individual defence structures is described in Sect.6.
5 Vertical evacuation structures
Table 1 Number of people surviving on the upper storeys of buildings in 5 municipalities on the Sendai Plains (Iwate Nichi Nichi Shinbun 2011)
District Survivors on upper storeys
Number of evacuation facilities
Sendai City 2,139 4
Natori City 3,285 5
Iwanuma City 2,095 5
Watari 2,102 5
Yamamoto Town 91 1
located in the expected tsunami inundation zone but designated according to government guidelines (Cabinet Office Government of Japan 2005) to withstand tsunami loading and to have enough vertical height to provide safe refuge above estimated tsunami inundation level. Observations from the March 11th 2011 tsunami have shown the importance of vertical evacuation structures in providing refuge in the inundation zone.
At least 9,700 people in 5 towns in the Sendai Plain survived the tsunami by evacuating to the upper storeys of RC buildings (Table1;Iwate Nichi Nichi Shinbun 2011). Loss of life was significantly reduced in Natori City and Iwanuma City through the use of vertical evacuation structures, while in areas such as Yamamoto Town there was a lack of suitable structures on the coastal plain. In Yamamoto Town, only 1 % of residents living in the inundation zone were able to survive by entering such a building as opposed to 27 % in Natori City, 26 % in Iwanuma City, 15 % in Watari and 8 % in coastal areas of Sendai City. An absence of vertical evacuation facilities was apparent in the tsunami affected wards of Sendai—Wakabayashi-ku and Miyagino-ku.
EEFIT observations of vertical evacuation structures in the tsunami affected areas sug-gest inconsistencies between municipalities in the planning and designation of evacuation structures. Designated vertical evacuation structures performed well structurally (observed damage was generally limited to scour, debris strike, glazing and contents damage). However, additional research shows that many of these structures were close to being overtopped in this event, and that there are many issues around the provision of welfare and access which must be improved in future (Fraser et al. 2012). In addition to the tsunami and earthquake impacts on such structures, concurrent or subsequent fire is a significant hazard that must be considered to ensure safety of evacuees taking refuge. Some evacuation centres, such as Kadonowaki School in Ishinomaki City, were affected by fire which spread as burning debris or spilled fuel floated on the water surface.
6 Field observations of tsunami damage
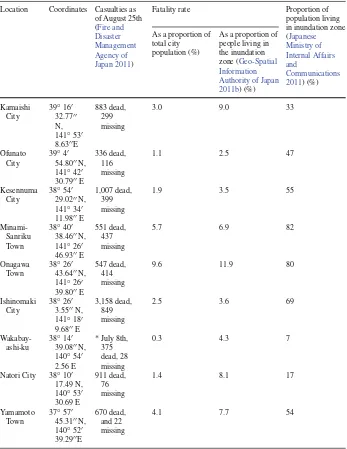
Table 2 Death toll and fatality rate at locations visited by EEFIT during the reconnaissance Location Coordinates Casualties as
of August 25th (Fire and Disaster Management Agency of Japan 2011)
Fatality rate Proportion of
population living in inundation zone (Japanese Ministry of Internal Affairs and
Communications 2011) (%) As a proportion of
total city population (%)
As a proportion of people living in the inundation zone (Geo-Spatial Information Authority of Japan 2011b) (%) Kamaishi
City
39◦16 32.77 N, 141◦53 8.63E
883 dead, 299 missing
3.0 9.0 33
¯ Ofunato
City
39◦4 54.80N, 141◦42 30.79E
336 dead, 116 missing
1.1 2.5 47
Kesennuma City
38◦54 29.02N, 141◦34 11.98E
1,007 dead, 399 missing
1.9 3.5 55
Minami-Sanriku Town
38◦40 38.46N, 141◦26 46.93E
551 dead, 437 missing
5.7 6.9 82
Onagawa Town
38◦26 43.64N, 141◦26 39.80E
547 dead, 414 missing
9.6 11.9 80
Ishinomaki City
38◦26 3.55N, 141◦18 9.68E
3,158 dead, 849 missing
2.5 3.6 69
Wakabay-ashi-ku
38◦14 39.08N, 140◦54 2.56 E
* July 8th, 375 dead, 28 missing
0.3 4.3 7
Natori City 38◦10 17.49 N, 140◦53 30.69 E
911 dead, 76 missing
1.4 8.1 17
Yamamoto Town
37◦57 45.31N, 140◦52 39.29E
670 dead, and 22 missing
4.1 7.7 54
* This is the latest available data at ward resolution.
6.1 Tar¯o Town, Iwate Prefecture
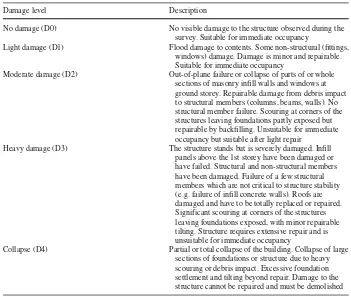
Table 3 EEFIT tsunami damage scale for RC frame or RC shear wall buildings of EMS-98 structural vulner-ability class D and E, i.e. moderate and high earthquake resistant design respectively, of up to 6 storeys height (adapted fromEEFIT 2006)
Damage level Description
No damage (D0) No visible damage to the structure observed during the survey. Suitable for immediate occupancy
Light damage (D1) Flood damage to contents. Some non-structural (fittings, windows) damage. Damage is minor and repairable. Suitable for immediate occupancy
Moderate damage (D2) Out-of-plane failure or collapse of parts of or whole sections of masonry infill walls and windows at ground storey. Repairable damage from debris impact to structural members (columns, beams, walls). No structural member failure. Scouring at corners of the structures leaving foundations partly exposed but repairable by backfilling. Unsuitable for immediate occupancy but suitable after light repair
Heavy damage (D3) The structure stands but is severely damaged. Infill panels above the 1st storey have been damaged or have failed. Structural and non-structural members have been damaged. Failure of a few structural members which are not critical to structure stability (e.g. failure of infill concrete walls). Roofs are damaged and have to be totally replaced or repaired. Significant scouring at corners of the structures leaving foundations exposed, with minor repairable tilting. Structure requires extensive repair and is unsuitable for immediate occupancy
Collapse (D4) Partial or total collapse of the building. Collapse of large sections of foundations or structure due to heavy scouring or debris impact. Excessive foundation settlement and tilting beyond repair. Damage to the structure cannot be repaired and must be demolished
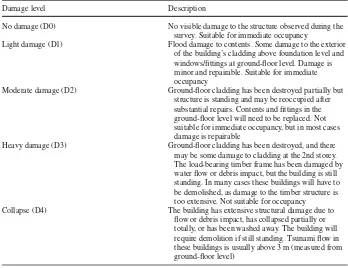
Table 4 EEFIT tsunami damage scale for timber frame buildings of EMS-98 structural vulnerability class D
Damage level Description
No damage (D0) No visible damage to the structure observed during the survey. Suitable for immediate occupancy
Light damage (D1) Flood damage to contents. Some damage to the exterior of the building’s cladding above foundation level and windows/fittings at ground-floor level. Damage is minor and repairable. Suitable for immediate occupancy
Moderate damage (D2) Ground-floor cladding has been destroyed partially but structure is standing and may be reoccupied after substantial repairs. Contents and fittings in the ground-floor level will need to be replaced. Not suitable for immediate occupancy, but in most cases damage is repairable
Heavy damage (D3) Ground-floor cladding has been destroyed, and there may be some damage to cladding at the 2nd storey. The load-bearing timber frame has been damaged by water flow or debris impact, but the building is still standing. In many cases these buildings will have to be demolished, as damage to the timber structure is too extensive. Not suitable for occupancy Collapse (D4) The building has extensive structural damage due to
flow or debris impact, has collapsed partially or totally, or has been washed away. The building will require demolition if still standing. Tsunami flow in these buildings is usually above 3 m (measured from ground-floor level)
6.2 Kamaishi City, Iwate Prefecture
Kamaishi City is situated in an east-facing bay, with urban development concentrated along a river valley 1.1 km wide at the port and bounded by steep hills to the north and south. Approximately 33 % of Kamaishi’s population lived in the inundation zone, and the city suffered 9 % fatality rate within the inundated zone (Geo-Spatial Information Authority of Japan 2011b;Japanese Ministry of Internal Affairs and Communications 2011).
The tsunami on March 11th overturned the north section (990 m in length) of the newly-completed offshore breakwater and although the south section (670 m in length) survived mostly intact, it was left inclined (Yagyu 2011). The Port and Airport Research Institute (PARI) (Fujita 2011) ran numerical simulations which estimated that the tsunami height was 10.8 m on the offshore face but only 2.6 m on the onshore side. This difference in water depth created a large hydrostatic force on the wall and along with water flowing through gaps between blocks of the breakwater causing scour, led to collapse of the wall (Kazama 2011). Despite the fact that the breakwaters were severely damaged, it is esti-mated that the breakwater reduced the height of the tsunami by 40 % (from 13.7 to 8 m), delayed the tsunami arrival time onshore by 6 min allowing more time for evacuation, and reduced run-up from (a simulated height of) 20.2 m to the observed 10 m (Kazama 2011). Analysis of inundation and run-up heights byMori et al.(2011) supports these simulation results.
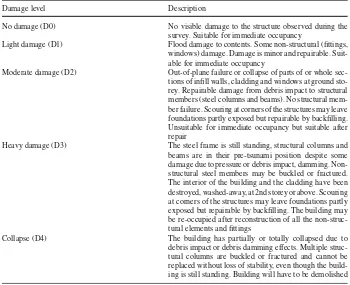
Table 5 EEFIT tsunami damage scale for steel frame buildings of EMS-98 structural vulnerability class E
Damage level Description
No damage (D0) No visible damage to the structure observed during the survey. Suitable for immediate occupancy
Light damage (D1) Flood damage to contents. Some non-structural (fittings, windows) damage. Damage is minor and repairable. Suit-able for immediate occupancy
Moderate damage (D2) Out-of-plane failure or collapse of parts of or whole sec-tions of infill walls, cladding and windows at ground sto-rey. Repairable damage from debris impact to structural members (steel columns and beams). No structural mem-ber failure. Scouring at corners of the structures may leave foundations partly exposed but repairable by backfilling. Unsuitable for immediate occupancy but suitable after repair
Heavy damage (D3) The steel frame is still standing, structural columns and beams are in their pre-tsunami position despite some damage due to pressure or debris impact, damming. Non-structural steel members may be buckled or fractured. The interior of the building and the cladding have been destroyed, washed-away, at 2nd storey or above. Scouring at corners of the structures may leave foundations partly exposed but repairable by backfilling. The building may be re-occupied after reconstruction of all the non-struc-tural elements and fittings
Collapse (D4) The building has partially or totally collapsed due to debris impact or debris damming effects. Multiple struc-tural columns are buckled or fractured and cannot be replaced without loss of stability, even though the build-ing is still standbuild-ing. Buildbuild-ing will have to be demolished
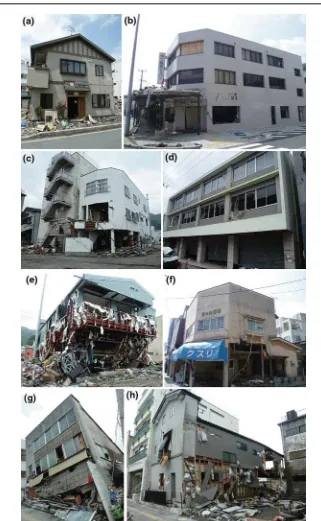
and residential buildings and a few commercial buildings of over 5 storeys. Land-use sea-ward of the survey area was industrial, including the large Nippon Steel Factory. Inun-dation depth of 8 m was recorded by EEFIT at the eastern end of the survey, decreasing gradually to around 2 m at the western end where the river flows towards the north-east (Fig.3). The survey included 154 buildings (51 % steel frame, 32 % timber frame, 15 % RC, 2 % unconfirmed steel frame or RC). Examples of buildings at different levels of damage as observed in our tsunami damage survey in Kamaishi City at each level are shown in Fig.4.
Observed failure modes included (i) out-of-plane failure of infill walls and panel walls in all construction types but particularly steel frame structures; (ii) debris impact damage (from minor damage of exterior cladding to major damage of non-structural components of steel frames); (iii) extensive glazing damage at ground-floor level, some damage to 1st and 2nd storey glazing; and (iv) soft-storey failure of several timber structures (Fig.5).
Fig. 3 Damage survey in Kamaishi City with individual buildings plotted to show construction and damage level. Construction type is indicated by shape, EEFIT tsunami damage level by colour:Diamondsdenote tim-ber frame;squaresdenote RC;circlesdenote steel frame.Bluedenotes D0,greendenotes D1,yellowdenotes
D2,orangedenotes D3,reddenotes D4. Inundation depths, the collapsed section of Nippon Steel Factory
building (red polygon), and vertical evacuation building are also shown.White lettersshow the position of buildings shown in Fig.4
half of the surveyed timber frame buildings experienced damage level D4 (partial or complete collapse) and where they survived with less damage it was due to significant sheltering by other more resistant structures.
No steel frame or RC structures suffered partial or complete collapse in the survey area, and a limited number suffered heavy damage (D3): 15 % and 4 % respectively. Most steel frame (77 %) and RC (83 %) buildings suffered heavy non-structural damage but the struc-tural frames or walls were often only lightly damaged (D1–D2). At the eastern end of the survey area most timber buildings suffered complete collapse and several had been washed away or cleared away, while steel frame buildings suffered damage level D1–D3, and RC buildings D1–D2. The survey indicates a general reduction in damage with distance from the port and increase in ground elevation towards the west, although variable levels of local sheltering were also observed due to the dense nature of development. There is some indi-cation of sheltering provided by the large trussed steel portal frame building (red polygon in Fig.3), the eastern-most (structurally isolated) end of which suffered partial collapse. At the western end of the survey transect (inundation depths of 2.5 to 3 m, adjacent to the river) timber frame structures generally sustained damage D1–D2, while one building at an exposed street corner sustained damage of D3. Evidence suggests that flow velocity was low at this end of the transect; plastic shop signs and some glazing remained undamaged despite being submerged.
[image:12.595.127.470.134.316.2]Fig. 5 Soft storey collapse of a timber structure observed in Kamaishi City. The 2nd storey appears to have remained intact due to central steel beam supporting the second storey
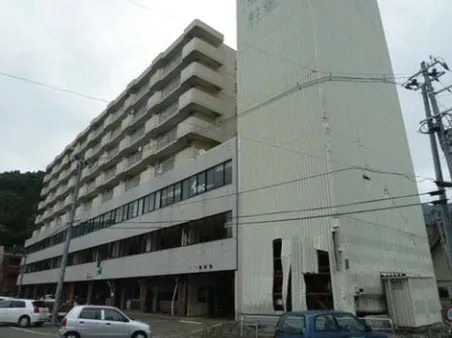
Fig. 6 Eight storey un-braced RC shear wall apartment block and designated evacuation building in Kamaishi City. A steel frame structure is located on the seaward face and sustained minor damage from debris impact. Two external staircases to the 4th floor exist on the other side of the building. This building was inundated to the 3rd storey
RC infill panels which were severely damaged. The building was inundated to the 3rd storey, but adequate elevation and absence of structural damage meant that occupants were able to evacuate to the designated evacuation area on the 4th storey and above.
6.3 ¯Ofunato City, Iwate Prefecture
¯
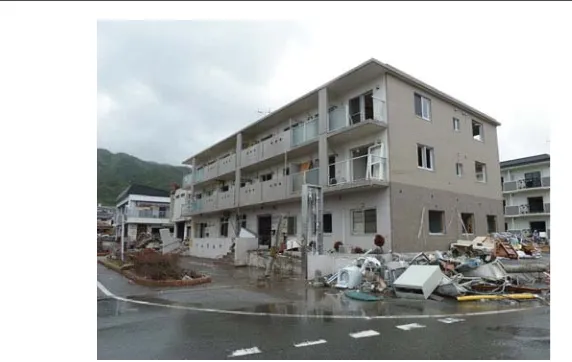
[image:14.595.138.460.129.316.2] [image:14.595.185.411.356.525.2]Fig. 7 Apartment building of RC shear wall construction in ¯Ofunato City. Seaward side of the building is shown. Inundation reached the ceiling of the 3rd floor, but the structure remained intact. This landward side of the building was sheltered from debris impact during the tsunami return flow
wave contributed to a wave height measured at 11.8 m at the harbour. The fatality rate (2.5 % of the population living in the inundated area, Table2) was among the lowest in the rias coastline, despite almost half of the population living in the area inundated, and was simi-lar to that of Miyako (3 % of population living in inundated area;Geo-Spatial Information Authority of Japan 2011b;Japanese Ministry of Internal Affairs and Communications 2011). From the tide gauge record obtained in the port, initial tsunami arrival at ¯Ofunato City occurred 25 min after the earthquake and took just 6 min to reach a height of 8 m, at which point the gauge stopped recording (IOC/UNESCO 2011). There was a drawdown phase of the sea here prior to the tsunami arrival, and the 1st tsunami wave was the highest. The city experienced 0.78 m co-seismic subsidence (Geo-Spatial Information Authority of Japan 2011c), resulting in frequent flooding since the event.
Following the 1960 Chilean tsunami, when inundation depths of 5.6 m occurred in ¯
Ofunato, some residents reconstructed their homes as 3-storey RC structures in the belief that these would survive future tsunami. However, on March 11th the tsunami inundated many of these buildings up to the roof level. There was almost total collapse of timber buildings in the area investigated. Many steel frame and RC buildings remained structurally intact but in the case of the steel buildings there was heavy damage to non-structural elements such as removal of cladding, consistent with observations elsewhere.
[image:15.595.136.422.134.315.2]6.4 Kesennuma City, Miyagi Prefecture
Kesennuma City is situated in a long, 1 km wide south-facing bay with most development on the west side and at the northern head of the bay. The bay appears somewhat sheltered from the Ocean by ¯Oshima Island and headland to the east. The tsunami at Kesennuma flowed north up the bay, arrived at the harbour as a fast-flowing rising tide (Japan Coast Guard 2011) and overtopped harbour walls and river defences. Significant damage was sustained along the western shore of the bay (on the eastern side of the river) and in the northern area of the city at the head of the bay. Inundation height measurements of 7–8 m were recorded by EEFIT at approximately 500 m inland in the survey area at the head of the bay. Kesennuma City was severely affected by fire which appears to have started at the marine oil terminal in the south of the city and spread extensively on floating debris. At the time of our visit, there were damaged fuel tanks and burned propane cylinders among the debris. Although there were many casualties in Kesennuma, this translates to relatively low a fatality rate of 3.5 % of the population in the inundated zone (see Table2).
An extensive area of damage was surveyed in the northern part of Kesennuma City from 450 m inland to 1.1 km inland (Fig.8). Flooding associated with 0.74 m of co-seismic sub-sidence (Geo-Spatial Information Authority of Japan 2011c) prevented closer access to the shoreline. Timber frame structures suffered heavy damage to collapse (90 % sustained dam-age level D4), 60 % of steel frame structures registered moderate to heavy damdam-age (D2–D3), and 78 % of the surveyed RC structures sustained light damage (D1). A large number of tim-ber frame buildings had been washed away or destroyed by fire and the building footprints were not visible during the survey. Field observations have therefore been augmented with building footprint data to estimate the total original number of buildings. Steel frame and RC buildings remain standing in areas most affected by fire, therefore all buildings identified from the GSI building footprints with no corresponding surveyed building are assumed to be timber frame, damage level D4 (collapse).
Highly variable damage was induced by flows of similar depths in this survey area. Although many timber frame structures are in a state of partial or complete collapse, there were a significant number which remained standing (with damage level D1–D3) in flows of 5–7 m depth, which is inconsistent with the 2 m wash-away threshold for Japanese timber houses observed in the 1960 Chilean tsunami (Sasaki 1960, in Shuto 1993). A compre-hensive report into building damage from all affected areas by theJapanese Ministry of Land Infrastructure Transport and Tourism(2011) (MLIT) shows a clear threshold for heavy damage or collapse to buildings at around 2.0 m: at 1.0–1.5 m inundation height, only 9 % of buildings were washed away or rendered unrepairable, while this increases to 31 % at 1.5–2.0 m. At 2.0–2.5 m 66 % of buildings were washed away or not repairable. The incon-sistency between this and the EEFIT survey highlights the importance of local effects on influencing damage levels to individual buildings.
A number of timber frame dwellings constructed with an RC ground-floor structure (Fig.9), or on artificially raised land were present in the surveyed area. The impact of raising residential timber frame buildings was generally positive, with the majority sustaining light to moderate damage depending on tsunami inundation depth or debris impact, as opposed to suffering heavy damage or collapse when built on concrete ring foundations just above ground level.
Fig. 8 Damage survey in Kesennuma City with individual buildings plotted to show construction and damage level.Diamondsdenote timber frame construction,squaresdenote RC,circlesdenote steel frame. Damage level is indicated by colour—BlueD0,greenD1,yellowD2,orangeD3,redD4. Inundation depths, heavily fire damaged areas (orangeoutline) and subsided area (blueoutline) are also shown. The subsided area was flooded at the time of survey. Inset shows survey location in the context of Kesennuma Bay
[image:17.595.126.473.134.543.2]Fig. 9 An example of a timber frame dwelling constructed with an RC ground floor structure. The main house is 3 m above ground level, 780 m inland and 60 m from the river. Despite inundation depth of approximately 6 m in this area, the house had sustained very little non-structural damage
inundation depths, placement of infrastructure on embankments can limit damage to both infrastructure and structures in the lee of the embankment.
6.5 Minami-Sanriku Town, Miyagi Prefecture
Minami-Sanriku Town is in a south-east facing bay at the junction of 3 river valleys (Fig. 10). The bay is broad, the mouth measuring 1.7 km across with little narrow-ing to the harbour front (1.1 km across) and further inland, where urban development extends to 1.5 km inland up the rivers. Despite less opportunity for wave amplifica-tion in this bay compared with some of the more narrow rias, tsunami height at the shore was estimated at 16 m (Take and Yamaya 2011) and observed by EEFIT to be at least 11 m at Shizugawa Hospital, 300 m inland. Inundation heights and inunda-tion extent here far exceeded those experienced during the 1960 Chile event, or that expected from the anticipated offshore Miyagi-ken-oki earthquake (around M 7.4 with recurrence interval of <40 years). More than 82 % of the town’s population resided within the area that was inundated and the fatality rate in this area was 6.9 % (Table2;
Geo-Spatial Information Authority of Japan 2011b;Japanese Ministry of Internal Affairs and Communications 2011).
The coastal defences in this town consisted of a sea wall and two flood gates across the two river channels; the concrete pillars of these gates remain standing although the attached steel operating components were washed away. Long sections of the tsunami wall collapsed and evidence of inadequate interlocking of adjacent blocks in the concrete sea walls was observed, with the blocks relying on self-weight for stability.
[image:18.595.143.465.132.317.2]Fig. 10 Satellite image showing Minami-Sanriku town in its coastal situation. Key buildings discussed in the text are marked: Crisis Management Department, Shizugawa Hospital and Matsubara community housing apartment block, also designated as a vertical evacuation building
Fig. 11 The 3-storey steel frame Crisis Management Department (CMD) building, located 470 m from the harbour front. This building was inundated to the roof (at 10 m elevation above ground level) and sustained loss of all cladding although the structure remains standing. Damage to this building and the deaths of CMD staff resulted in the loss of crisis management facilities and expertise in the immediate aftermath of the tsunami
6.6 Onagawa Town, Miyagi Prefecture
Onagawa Town is situated in a narrow valley exposed to the Ocean to the east, with an estuary at the western end of the valley (Fig.15). Maximum inundation depths here exceeded 16 m due to flow from the east. The town suffered a high fatality rate (11.9 % of the population living in the inundated zone, see Table2), which was greater than the rate in Minami-Sanriku for a similar level of population in the inundated area, and similar magnitude of tsunami inun-dation height. These figures suggest important differences in evacuation response between these towns.
Fig. 12 RC building in Shiomi-cho, Minami-Sanriku, 100 m from the sea (38◦4029.10N, 141◦2644.96 E) showing collapse of upper storeys. Several other RC buildings in the immediate vicinity of this building had suffered collapse with evidence of severe scour and debris impact
Fig. 13 The Matsubara apartment block and designated vertical evacuation building in Minami-Sanriku. This photograph shows the landward side of the building with scour of at least 2 m at it northern end (a similar amount of scour was also observed at the southern end). Observations of this side of the building show little structural damage despite 16 m inundation height
visible above water level on the south section. In the urban area up to 400 m inland, timber buildings had all collapsed (D4) and most steel frame buildings suffered moderate to severe damage and collapse (D2–D4). Many RC buildings sustained moderate damage (D2), and a few were severely damaged (D4) through overturning.
[image:21.595.184.412.364.534.2]Fig. 14 Shizugawa Hospital, Minami-Sanriku, which was inundated to 11 m depth but was used in evacuation to the roof. This photograph shows the landward side of the building with evidence of damage to the balcony at the 4th storey
Fig. 15 Satellite image showing Onagawa Town and Ishinomaki City, showing the transition between plains coastline to the west and rias to the east. Figure16shows a close up of the eastern harbour of Onagawa Town
[image:22.595.126.470.363.610.2]Fig. 16 Satellite image of the harbour in Onagawa Town, indicating the (i) final locations of overturned RC and steel frame buildings (blue points, marked with building tag A–E) as observed by EEFIT; (ii) the track of building movement from the original position indicated byarrows(Tokimatsu et al. 2011); and (iii) positions of two velocity estimations made for return flow velocity using video footage
A 2-storey RC shear wall office building with piled foundations was overturned landward during tsunami inflow (‘Building A’; Fig.17). The structure had one pile at each corner, and three closely spaced piles at each of the central pile caps. The rebar in each pile did not extend very far down the pile and they appeared quite lightly reinforced at the top, suggesting they were designed only for shear, rather than also for tension. The uppermost (originally seaward) piles remained connected to the pile cap and were relatively straight, suggesting that they had been pulled out of the ground and then failed in tension. In contrast, the bottom (originally landward) piles were sheared off closer to the foundation and were all bent downwards; this suggests the lateral forces imparted by tsunami flow were concentrated on the landward piles, which became the pivot point in the overturning motion. Overturning in this case may have been initiated by debris strike, evidence of which was observed at the top of the structure.
Fig. 17 Foundations of an overturned two-storey RC shear wall structure with piled foundations in Onagawa Town—‘Building A’. Evidence of impact at the roof of the building on its seaward side indicates that this failure may have been initiated by debris strike
Fig. 18 An overturned two-storey RC shear wall structure with raft foundations at the harbour edge in Onagawa Town—‘Building B’
Overturning was also seen at 3-storey steel frame structure on piled RC foundation with 2–3 piles at each of 8 pile caps (‘Building D’; Fig.19). Only one of the 20 RC piles remained attached to the foundation beams by only reinforcement bars. All cladding at the ground-floor was removed exposing an open lattice-type structure suggesting that buoyancy could not have had a significant impact on the building displacement.
[image:24.595.185.413.367.537.2]Fig. 19 An overturned 3-storey steel frame building (‘Building D’) on piled RC foundation with evidence of debris impact on the (originally) seaward face of the building. This photograph was taken from a neighbouring building during tsunami inundation, courtesy of Miyagi Prefectural Office
Fig. 20 A 2-storey RC shear wall structure with shallow pad footing foundation (‘Building E’). Evidence of small piles on at least one of the corner columns can be seen, but no piles remained attached at the time of our visit. The building has also sustained out-of-plane failure of an infill wall at the ground floor
[image:25.595.185.412.406.577.2]which were significant in Onagawa due to the extreme inundation depth. Similar overturning failures of RC buildings were observed in at least one case in ¯Otsuchi (Chock 2011) and Miyako City.
Despite extreme hydrodynamic forces in this area, many buildings survived due to dense urban development affording a certain degree of sheltering. A 4-storey harbour-front com-plex of 2 buildings suffered extensive glazing damage, limited damage to masonry cladding, and the loss of an elevated walkway that connected the buildings. Smaller buildings in the lee of these substantial structures were sheltered on the inflow of tsunami, and remain standing despite sustaining heavy non-structural damage on the return flow. While observations from Onagawa and many other sites in this and previous extreme tsunami events (EEFIT 2006;
Borrero 2005) showed that RC structures are effective in withstanding tsunami loading, it is now clear that there are additional failure modes to consider in their resistance to tsunami loads in high velocity flows exceeding 15 m depth. This has vital implications for the selection of appropriate RC structures to use in vertical evacuation strategies.
6.7 Ishinomaki City, Miyagi Prefecture
Ishinomaki is the 2nd-largest city in Miyagi Prefecture and has approximately 12 km of south-facing coastline (Fig.15), much of which is dedicated to warehouses and industrial sites associated with the fishing port and commercial port. Inland of the ports, the densely built-up urban area extends 4.8 km inland at it furthest point; the 400 m closest to the har-bour is commercial and industrial land use, with residential and smaller commercial land use further inland. The death toll in Ishinomaki City was the highest of all tsunami affected cities and towns and as of August 25th 2011, stood at 3,158 dead and 849 missing (Fire and Disaster Management Agency of Japan 2011). This was a relatively low fatality rate of 3.6 % relative to the population living within the inundated area, when compared to other locations which also had 70–80 % of the population was living in the inundated area (i.e. Rikuzentakata, ¯Otsuchi, Onagawa, and Minami-Sanriku).
Inundation simulations based on a Miyagi-ken-oki earthquake of JMA magnitude 8.0 multiple source zone rupture estimated that 164 people would be killed in Ishinomaki (Miyagi Prefectural Government 2004). Maximum estimated inundation height from the subsequent tsunami was 3 m along the port front, and 1 m at a distance of 500 m inland. Our surveys showed that the inundation height on March 11th was at least 4 m at several locations over 470 m inland, while measurements byThe 2011 Tohoku Earthquake Tsunami Joint Survey Group(2011) indicate tsunami height at the Ishinomaki fishing port was around 4 times higher than the above modelled estimates.
Aerial photographs show that the majority of structures remained standing in the inundated area of Ishinomaki City, although there were some areas of almost entire destruction observed around the mouth of the Old Kitakami River where significant co-seismic subsidence of up to 0.78 m occurred (Geo-Spatial Information Authority of Japan 2011c). Flooding of subsided land adjacent to the river mouth and along the port front now occurs at high tide. There was evidence of fire damage in this area, with Kadonowaki School building showing significant external fire damage.
deposited on the 1st storey roof of a residential building, but despite the 3 m inundation depth, several adjacent timber frame houses remained standing with light damage (D1), sug-gesting low flow velocity. In the immediate vicinity of these houses, heavy damage to a steel frame building, moderate damage to RC buildings and collapse of other timber structures shows high local variability of tsunami damage. Observations of damage at the port front included impact of large debris, causing significant bending of the structural columns of a large 1-storey steel frame warehouse.
6.8 Sendai City coastal areas, Miyagi Prefecture
Sendai City is divided into 5 wards, including Miyagino-ku and Wakabayashi-ku which are coastal, and Taihaku-ku which spreads across the whole of the southern part of the city with its borders reaching up to 3 km inland from the shore. In Miyagino-ku and Wakabayashi-ku 630 people died. The dense urban area of the city is over 4 km inland and the city centre is 12 km from the coast; the majority of land between the coast and the T¯ohoku Expressway, which dissects the eastern part of the city from north to south, is agricultural land. Inundation reached up to 5.7 km inland in Wakabayashi-ku and up to 7.5 km where the tsunami flowed up the Natori River at the southern limits of the city.
EEFIT investigated damage to residential properties in the Arahama District of Wakabayashi-ku, which suffered severe damage and a fatality rate of 4.29 % from the tsu-nami. The coastline is east-facing with localised use of 6 offshore breakwaters; the main defence being concrete block revetments along Arahama Beach. A pine forest immediately inland of the revetments provided additional protection. The flat low-lying terrain contributed to inundation of up to 5 km inland.
[image:27.595.184.411.508.678.2]The concrete defences at Arahama Beach had failed in several places and the sand infill had been washed out (Fig.21), while concrete blocks had been removed and washed up to 100 m landward into the coastal pine forest. Many residential properties of timber frame con-struction suffered complete collapse or had been demolished by the time of our investigation. Significant scour of the sandy soil (old beach deposits) on the seaward side of buildings had caused tilting and exposure of foundations in some buildings. Out-of-plane failure of infill
Fig. 22 The south side of Arahama Elementary School, which was successfully used for vertical evacuation. Timber-clad steel bracing is visible in windows of the lower floors. Damage to non-structural components at the ground floor is shown, along with debris at the seaward end of the building on the second floor. The roof shows evacuation infrastructure including warning sirens and fencing around an evacuation area. There is external access to the roof on the north side of this building
walls at several RC and reinforced masonry structures was observed approximately 100 m landward of concrete sea defences. Scour up to 3 m deep resulted in the collapse of a tsunami warning siren at the beach.
This area was notable for two contrasting examples of evacuation structures. A pre-cast concrete gymnasium building (38◦ 1539.30N, 141◦00 53.61E) close to Sendai Port was indicated by a damaged road sign as an evacuation site. This structure was 380 m from the open ocean with a small estuary (150 m wide) on the inland side of the beach. A series of dikes separated part of the estuary into individual ponds—the dikes were breached by the tsunami and had been repaired with sandbags at the time of investigation. Due to its function as a sports hall (single storey, high ceiling) the building had no upper storey in the main part of the building, and very little floor space at the 2nd storey of the adjoining building, making it unsuitable for vertical evacuation. There was also a lack of external access to the roof (only a small maintenance ladder). Only non-structural damage was apparent: glazing, damaged wall cladding, minor scour and lifting of the gymnasium floor.
Fig. 23 Post-tsunami aerial photograph of Yuriage District, Natori City, showing almost complete destruction of this residential area, although the part of Yuriage adjacent to the river embankment (northern edge of this image) sustained less damage
small debris strike at the seaward end. A successful evacuation was carried out at this site: 380 people survived by evacuating to the roof (Iwate Nichi Nichi Shinbun 2011).
6.9 Natori City, Miyagi Prefecture
Natori City is located on the Sendai Plains and is predominantly low-lying flat agricultural land, with 2 main population centres—the main city situated at least 5 km inland and Yuriage District at the coast, adjacent to the mouth of the Natori River (Fig.23). Coastal defence in Yuriage comprised pine coastal forest with concrete harbour walls at the Yuriage Port (38◦ 1021.63N, 140◦5723.51E). The tsunami arrived in Yuriage approximately 65 min after the earthquake and inundated up to 5.2 km inland, close to the embankments of the T¯ohoku Expressway, where floating and burning wooden houses, cars, boats and other debris were deposited. Natori City officials advised EEFIT that Yuriage sustained a greater number of casualties than seaward of Sendai Airport, further south. The fatality rate was high compared to other areas (8.1 %), and as was the case in many other areas in this event, predominant casualties were people over 65 years of age (Fire and Disaster Management Agency of Japan 2011).
Fig. 24 View along the north side of one apartment block in Yuriage, illustrating scour at the seaward end of one apartment building. Loss of soil providing bearing capacity to support the footings resulted in tilting of this building
direction from the east, which indicates that the wave arrived approximately perpendicular to the coastline, directly into the river mouth and across Yuriage harbour, where there were no significant coastal defences.
Significant scour of sandy soil was observed at a row of four apartment blocks (all 2- to 3-storey RC shear wall construction) in Yuriage. Scour occurred to up to 2 m deep around the eastern (seaward) ends and northern sides of the two of these buildings, causing severe tilting of one (Fig.24). The position of the most severe scour implies that scouring at this location most-likely occurred during the return flow of the tsunami. Another building had severe debris impact damage on the 2nd storey level on the seaward side RC shear wall, likely due to impact from the floating fishing vessel that still lay in front of the building at the time of our visit (June 1st).
At Sendai Airport, the tsunami broke close to the shore and overtopped a 5–10 m high sand dune before flowing several kilometres inland through paddy fields. The airport terminal building, 1 km inland (38◦817.13N, 140◦5548.88E), is a 4-storey steel and RC con-struction with a significant amount of exterior glazing on all storeys. The tsunami inundated the 1st storey of the terminal building—internal steel frame partition walls had been bent by debris strike. Airport staff reported that external windows broke only when struck by debris, not due to wave loading alone.
Five vertical evacuation structures in Natori City saved 3,285 lives in this event (Table1;
Fig. 25 A steel frame agricultural building located 1 km inland at Yamamoto Town, Miyagi Prefecture. A tree trunk, apparently from the damaged coastal pine forest, struck a structural column on the south-east (sea-ward) corner of the building, buckling the structural and non-structural members. Tsunami flow has removed cladding to a height of over 4 m
provided refuge to approximately 800 people who had to remain there for 2 days following the tsunami.
6.10 Yamamoto Town, Miyagi Prefecture
Yamamoto Town has very similar low-lying topography to the Yuriage and Arahama districts, and suffered a similar fatality rate (7.7 %) as Natori City. The beach had large periodically-placed groynes and a concrete block revetment, with pine coastal forest immediately inland. Both sides of the revetment comprised a concrete lattice in-filled with concrete blocks and natural vegetation. The revetment had a sand core and a concrete and bitumen pathway along its crest. The groynes were constructed of slim concrete armour units aligned with the slope and appeared largely intact. At several locations along the revetment, there were breaks in the reinforced lattice and most of the concrete blocks were missing. Scour on the leeside was a main cause of embankment failure. Pine trees of the coastal forest were largely destroyed by the tsunami: they had bent over and trunks were snapped very close to the base. The coastal forest provided substantial amounts of debris which was seen to cause structural damage to a steel frame agricultural building located 1 km inland (37◦5726.39N, 140◦5418.44E; Fig.25). This building was struck during tsunami inflow by a tree trunk which bent structural members.
7 Summary and conclusions
was primarily because the wave heights experienced in this event far exceeded the design values, which were based on the expected Miyagi-ken-oki event or inundation levels expe-rienced in the 1896, 1933 and 1960 tsunami. Sea walls and breakwaters were overtopped, overturned, or broken up by hydrostatic and hydrodynamic forces and scour on a large scale, but did provide some degree of protection despite this damage. Trees (from the coastal protection forest) and concrete blocks (from coastal revetments) proved to be damaging debris sources, contributing to structural damage and collapse of buildings in several loca-tions.
Numerous evacuation refuges and other critical infrastructure (such as hospitals, crisis management and police headquarters) were inundated in this event resulting in significant loss of life. Estimation of tsunami hazard in this region had been underestimated, and many evacuation centres were inundated. The network of vertical evacuation structures should be expanded for use in future events, particularly in the Sendai Plains where there is no access to high ground. Further work is required in future to ensure refuges are properly designated in terms of location and structural suitability; both of these issues are a product of adequate hazard estimation and mapping.
EEFIT tsunami observations show that damage can be extremely variable in a local area and it is clear that inundation depth, direction of flow, local flow velocity variations, shel-tering during the inflow and return flow, and debris entrainment must all be considered for a complete assessment of tsunami fragility. RC shear wall structures are again confirmed as able to withstand tsunami loading and should form the primary construction type for critical infrastructure in tsunami risk areas, but further research is required into mitigation of scour, liquefaction, debris impact, and the prevention of overturning failure as these features caused failure of RC buildings in several observed cases.
Our surveys show that the structure of steel frame buildings often remain standing fol-lowing a tsunami but significant damage to non-structural components, primarily removal of cladding, renders this type of structure unsuitable for use as critical infrastructure. Debris impact is a key factor in structural damage of steel frame structures—while tsu-nami flow alone is shown to cause significant non-structural damage, it is debris impact which most often caused heavy damage to the structural members and collapse of the build-ing.
Our surveys have suggested that significant local variability in damage, even to timber frame structures, occurs due to local flow characteristics and that many timber frame build-ings can survive in areas experiencing low flow velocity, however, there remains no doubt that timber frame buildings generally cannot withstand tsunami flow forces, particularly in the near shore area. Raising timber structures on RC open-structure ground-floors can mitigate damage in inundation depths of up to 6 m, as observed in Kesennuma City. This should be a consideration in reconstruction of residential areas as long as potential soft-storey effects during ground shaking are adequately addressed, and where it is appropriate to the level of tsunami hazard.
As a result of our observations and damage surveys in T¯ohoku, EEFIT have further devel-oped separate tsunami damage scales for timber, steel frame and RC buildings. These scales have been demonstrated in this paper, and provide a consistent basis for completion of future post-tsunami damage assessments, enabling comparison of damage across different areas and events.
Foundation, Sellafield Ltd., and Willis Research Network. The authors would like to acknowledge generous support while on the field mission from Eri Gavanski, Maki Koyama, Hitomi Murakami, and many other individuals, institutions and organisations.
References
Atwater BF, Muumi-Rokkaku S, Satake K, Tsuji Y, Ueda K, Yamaguchi DK (2005) The orphan tsunami of 1700. Japanese clues to a parent earthquake in North America. University of Washington Press, Seattle, p. 133
Borrero JC (2005) Field survey of Northern Sumatra and Banda Aceh, Indonesia after the sunami and earth-quake of 26 December 2004. Seismol Res Lett 76(3):312–320. doi:10.1785/?gssrl.76.3.312
Cabinet Office Government of Japan (2005) Guidelines pertaining to vertical evacuation building. Tokyo. Retrieved fromhttp://www.bousai.go.jp/oshirase/h17/tsunami_hinan.html
CEDMHA (2011) Japan earthquake and tsunami update Wednesday, March 30, 2011. Hawaii, p. 47. Retrieved fromhttp://www.coe-dmha.org/Research/ResearchInfoMgmt/Japan/Japan03302011.pdf
Chock G (2011) More evidence of overwhelmed seawalls. ASCE Japan Tsunami Reconnaissance Team— Day 3. Retrieved 30 June 2011, fromhttp://www.asce.org/PPLContent.aspx?id=12884906357
EEFIT (2006) The Indian Ocean tsunami of 26 December 2004: mission findings in Sri Lanka and Thailand, vol 44. London, pp 1–180
EEFIT (2011) The Mw9.0 Tohoku earthquake and tsunami of 11th March 2011—a field report by EEFIT. London, UK
Earthquake Research Institute (2011) Tsunami survey. Retrieved 27 July 2011, fromhttp://outreach.eri. u-tokyo.ac.jp/eqvolc/201103_T?hoku/eng/
Fire and Disaster Management Agency of Japan (2011) Report 137 on the effects of the March 11, 2011 Great T¯ohoku earthquake. Retrieved 29 August 2011, fromhttp://www.fdma.go.jp/bn/2011/detail/691.html
Fraser S, Leonard G, Murakami H, Matsuo I (2012) Tsunami evacuation: lessons from the Great East Japan earthquake and tsunami of March 11th 2011. GNS science report, Lower Hutt, New Zealand (in press) Fujita T (2011) Tsunami impacting Eastern Japan and preparedness for extraordinary natural disaster. Retrieved
27 July 2011, fromhttp://www.pari.go.jp/files/items/3459/File/2011052327IAPH.pdf
Geo-Spatial Information Authority of Japan (2011a) Crustal deformation and fault model obtained from GE-ONET data analysis. Retrieved 30 June 2011, fromhttp://www.gsi.go.jp/cais/topic110313-index-e.html
Geo-Spatial Information Authority of Japan (2011b) Inundation extent maps. Retrieved 27 July 2011, from
http://www.gsi.go.jp/kikaku/kikaku60003.html
Geo-Spatial Information Authority of Japan (2011c) Year 2011 (2011) due to earthquake subsidence inves-tigation northeastern Pacific Ocean off the coast. Retrieved 20 July 2011, fromhttp://www.gsi.go.jp/ sokuchikijun/sokuchikijun40003.html
Goda K, Pomonis A, Chian SC, Offord M, Saito K, Sammonds P (2012) Ground motion characteristics and shaking damage of the 11th March 2011 Mw9.0 Tohoku earthquake (in review)
Hatori T (1984) On the damage to houses due to tsunamis. Bull Earthq Res Inst 59:433–439 (in Japanese) Iwate Nichi Nichi Shinbun (2011) 10,000 People survive after evacuating to a (designated evacuation) building.
Ichinoseki, Japan, p 7, 30 May 2011
IOC/UNESCO (2011) IOC/UNESCO Bulletin No. 8, As of 23 March 2011. Retrieved fromhttp://www. eqclearinghouse.org/2011-03-11-sendai/files/2011/03/No.-8-IOC-UNESCO-Bulletin-23-Mar.pdf
Japan Coast Guard (2011) Raw footage released by the Japan coast guard of the tsunami and fires in Kesen-numa. Retrieved 31 August 2011, fromhttps://picasaweb.google.com/lh/photo/cNrrglyXPo5W6-6l4ysu vl6-HV4XK8khGfVE4K2xJdY?feat=embedwebsite
Japanese Ministry of Internal Affairs and Communications (2011) Estimation of the population in the tsu-nami inundation zone, by municipality (analysis by the Geographical Information Authority of Japan). Retrieved 4 August 2011, fromhttp://www.stat.go.jp/info/shinsai/zuhyou/sinsui.xls
Japanese Ministry of Land Infrastructure Transport and Tourism (2011) Status survey results affected by the earthquake East (first report). Retrieved fromhttp://www.mlit.go.jp/common/000162533.pdf
Kazama M (2011) The 2011 off the Pacific Coast of T¯ohoku earthquake—after two months. In: 14th Asian regional conference on soil mechanics and geotechnical engineering. Hong Kong. Retrieved fromhttp:// www.jiban.or.jp/file/file/kazama520e2.pdf
Kokusai Kogyo Group (2011) Characteristics of Japan’s DRR: a perspective from the spatial information sector. UN ISDR, Third session of the Global Platform for disaster risk reduction. Geneva, Switzerland Koshimura S, Namegaya Y, Yanagisawa H (2009) Tsunami ragility—a new measure to identify tsunami
Miyagi Prefectural Government (2004) Summary of the third survey in Miyagi Prefecture earthquake dam-age estimation. Retrieved 20 July 2011, fromhttp://www.pref.miyagi.jp/kikitaisaku/jishin_chishiki/ 3higaishin/index.htm
Mori N, Takahashi T, Yasuda T, Yanagisawa H (2011) Survey of 2011 Tohoku earthquake tsunami inundation and run-up. Geophys Res Lett 38:L00G14. doi:10.1029/2011GL049210
National Police Agency of Japan (2012) Damage situation and police countermeasures associated with 2011 Tohoku district-off the Pacific Ocean earthquake, January 31, 2012. Retrieved fromhttp://www.npa.go. jp/archive/keibi/biki/higaijokyo_e.pdf
Noh T (1966) Sanriku Coast prepared for Tsunami—a preliminary report on men’s defense against natural disaster. Sci Rep Tohoku Univ 7th Ser Geogr 15(1):1–24
Okumura K (2011) Interplate megathrust earthquakes and tsunamis along Japan Trench offshore Northeast Japan. Hiroshima University, Japan. Retrieved fromhttp://www.homeofgeography.org/uk/news_2011/ jogan_e.pdf
Port and Airport Research Institute (2011) Executive summary of urgent field survey of earthquake and tsunami disasters. Retrieved 27 July 2011, fromhttp://www.pari.go.jp/en/eq2011/20110325.html
Read R (2011, April 17) Japan’s 60-foot tsunami overturned four-story concrete building, shattering safety and engineering strategies. The Oregonian. Retrieved fromhttp://www.oregonlive.com/today/index.ssf/ 2011/04/surveying_what_survived_the_quake_and_tsunami_--_and_what_didnt_oregonian_in_japan. html
Sasaki S (1960) The Chilean earthquake tsunami. In: Proceedings of the 7th Japanese conference on coastal engineering, pp 275–287
Satake K, Namegaya Y, Yamaki S (2008) Numerical simulation of the AD 869 Jogan tsunami in Ishinomaki and Sendai plains. Annu Rep Active Fault Paleoearthq Res 8:71–89
Shao G, Li X, Ji C, Maeda T (2011) Focal mechanism and slip history of 2011 Mw 9.1 off the Pacific coast of Tohoku earthquake, constrained with teleseismic body and surface waves. Earth Planets Space 63(7):559–564. Retrieved from http://www.geol.ucsb.edu/faculty/ji/big_earthquakes/2011/03/0311/ paper.pdf
Shuto N (1993) Tsunami intensity and disasters. In: Tinti S (ed) Tsunamis in the world. 15th International tsunami symposium, 1991. Kluwer Academic Publishers, Dordrecht, pp 197–216
Shuto N (2011) Onagwa Memorial Park. ITIC Tsunami Bulletin Board. Retrieved fromhttp://infolist.nws. noaa.gov
Shuto N et al (1986) A study of damage to houses by the Nihon-Chubu earthquake tsunami. In: Proceedings of the JSCE 41st annual meeting, pp 533–534 (in Japanese)
Simons M, Minson SE, Sladen A, Ortega F, Jiang J, Owen SE, Meng L et al (2011) The 2011 magnitude 90 To-hoku-Oki earthquake: Mosaicking the Megathrust from Seconds to Centuries. Science 332(6036):1421– 1425. Retrieved fromhttp://www.sciencemag.org/content/332/6036/1421/F1.expansion.html
Takahashi S, Toda K, Kikuchi Y, Sugano T, Kuriyama Y, Yamazaki H, Nagao T et al (2011a) Urgent survey for 2011 Great East Japan earthquake and tsunami disaster in ports and coasts, p 110. Retrieved from
http://www.pari.go.jp/files/3642/1049951767.pdf
Takahashi S, Kuriyama Y, Tomita T, Kawai Y, Arikawa T, Tatsumi D, Negi T (2011b) Urgent survey for 2011 Great East Japan earthquake and tsunami disaster in ports and coasts (English summary) (p 9). Retrieved fromhttp://www.pari.go.jp/en/files/3653/460607839.pdf
Takata N (2009) Tsunami disaster reduction in Japanese ports and harbors. In: Proceedings of the 6th interna-tional workshop on coastal disaster prevention. Bangkok, p 93
Take Y, Yamaya R (2011) Reconnaissance report (19) on Minami-Sanriku-cho, Miyagi prefecture, April 20, 2011
Tanaka S, Kuribayashi D, Istiyanto D (2008) Report on “UN/ISDR Comprehensive Tsunami Disaster Preven-tion Training Course” (p. 53). Retrieved fromhttp://www.preventionweb.net/files/9285_isdrtsunamieng. pdf
The 2011 Tohoku Earthquake Tsunami Joint Survey Group (2011) The 2011 off the Pacific coast of Tohoku earthquake tsunami information—field survey results. Coastal Engineering Committee of the Japan Soci-ety of Civil Engineers. Retrieved 18 November 2011, fromhttp://www.coastal.jp/tsunami2011/index. php?Fieldsurveyresults
The Japan Times (2011) Tsunami hit more than 100 designated evacuation sites. Kyodo, 14 April 2011. Retrieved fromhttp://www.japantimes.co.jp/text/nn20110414a4.html
Tokimatsu K, Tamura S, Suzuki H, Katsumata K (2011) Quick report on geotechnical problems in the 2011 Tohoku Pacific Ocean Earthquake. Tokyo, pp 21–47
Utsu T (2002) A list of deadly earthquakes in the World: 1500–2000. In: Lee WK, Kanamori H, Jennings PC, Kisslinger C (eds) International handbook of earthquake and engineering seismology part A. Academic Press, San Diego, pp 691–717
Watanabe H (1998) Inventory of Japanese damaging tsunamis, 2nd edn. Tokyo University Press, Tokyo Yagyu T (2011) Thank you very much for your messages of sympathy regarding the Great East Japan