HEALTH, DISEASE AND AFTER TREATMENT-A
CLINICO-BIOCHEMICAL STUDY
Dissertation submitted to
THE TAMILNADU Dr.M.G.R.MEDICAL UNIVERSITY
In Partial fulfillment for the Degree of
MASTER OF DENTAL SURGERY
BRANCH II
PERIODONTICS
This is to certify that Dr. P.FAIRLIN, Post Graduate student in the Department of Periodontics, J.K.K Nattraja Dental College and Hospitals,
Komarapalyam has done this dissertation titled "EVALUATION OF LEVELS OF ADIPONECTIN AND RESISTIN IN GINGIVAL CREVICULAR FLUID IN PERIODONTAL HEALTH, DISEASE AND AFTER TREATMENT-A CLINICO-BIOCHEMICAL STUDY" under my direct guidance during her post graduate study period 2016 - 2019.
This dissertation is submitted to THE TAMILNADU Dr. MGR MEDICAL UNIVERSITY in partial fulfillment of the degree of MASTER OF DENTAL SURGREY, BRANCH II – PERIODONTICS.
Dr. S.THANGA KUMARAN, Dr. A. SIVAKUMAR,
Professor and Head, Principal,
J.K.K.N Dental College and Hospital, J.K.K.N Dental College and Hospital,
This is to certify that this dissertation work titled "EVALUATION OF LEVELS OF ADIPONECTIN AND RESISTIN IN GINGIVAL CREVICULAR
FLUID IN PERIODONTAL HEALTH, DISEASE AND AFTER
TREATMENT-A CLINICO-BIOCHEMICAL STUDY" of the candidate Dr. P. FAIRLIN with the registration number 241613102 for the award of
MASTER OF DENTAL SURGERY in the Branch II - PERIODONTICS. I personally verified the urkund.com website for the purpose of plagiarism check. I found that the upload thesis file contains from introduction to conclusion pages and
results shows 3 percentage of plagiarism in the dissertation.
I am greatly indebted to Dr. S. Thangakumaran, my Professor and Head of the Department, Department of Periodontics, J.K.K. Nattraja Dental College and Hospital, Komarapalayam, for his invaluable guidance, support and encouragement throughout my post graduate study. I am indebted to you forever for all the considerations you have shown towards me, sir.
I would like to extend my heartfelt gratitude to Professor Dr. A. Sivakumar, Principal, J.K.K. Nattraja Dental College and Hospital, for his kindness in allowing me to utilize the facilities in the college.
I sincerely thank Dr. P K Sasikumar, Reader for his patience and perseverance and his incessant encouragement, guidance and support which benefited me in my academic life.
I also thank Dr. T. Arthiie, Reader for her profound knowledge and her valuable guidance and support throughout my entire academic period.
I also thank Dr. S. Santosh, Reader for his help and continuous encouragement throughout my entire academic period.
My heartfelt thanks to my dear seniors and colleagues, Dr. Tamilselvan K, Dr. Shiva shangkharii k, Dr. Dhivya R , Dr. Sugirtha C , Dr. Sree Lakshmi P, Dr. Swathigan V ,Dr. Syed D ,and all the non-teaching staff’s and my department sisters Mrs. Hemalatha, Mrs. Maruthaveni, Mrs.Sathya, Mrs. Kamala and Mrs. Rani for their kind help during my postgraduate period.
I would like to thank all of my patients for their kind cooperation.
S. NO. INDEX PAGE NO.
1. INTRODUCTION 1
2. AIMS AND OBJECTIVES 4
3. REVIEW OF LITERATURE 5
4. MATERIALS & METHODS 18
5. RESULTS 45
6. DISCUSSION 59
7. SUMMARY AND CONCLUSION 63
TABLE
NO.
TITLE
1
Comparison of clinical parameters between group II and
group III
2
Comparison of Adiponectin levels between groups
3
Comparison of Resistin levels between groups
4
Correlation of clinical parameters with Adiponectin and
GRAPH
NO.
TITLE
1. Comparison of Plaque Index, Gingival Index and Sulcus Bleeding Index between group II and group III
2. Comparison of Probing Depth between group II and group III
3. Comparison of Clinical Attachment Level between group II and group III
4. Comparison of Adiponectin levels between groups
5. Comparison of Resistin levels between groups
6. Correlation of Plaque Index with Adiponectin and Resistin in group II
7. Correlation of Plaque Index with Adiponectin and Resistin in group III
8. Correlation of Gingival Index with Adiponectin and Resistin in group II
9. Correlation of Gingival Index with Adiponectin and Resistin in group III
12. Correlation of Probing Depth with Adiponectin and Resistin in group II
13. Correlation of Probing Depth with Adiponectin and Resistin in group III
14. Correlation of Clinical Attachment Level with Adiponectin and Resistin in group II
Chronic periodontitis is an infectious disease resulting in inflammation in the
supporting tissues of the teeth, progressive attachment and bone loss with pocket
formation and/or gingival recession or both. This is the most frequently occurring
form of periodontitis which is commonly seen in adults, but can occur at any age. The
disease is usually associated with the presence of plaque and calculus. The
progression of attachment loss usually occurs slowly in this condition but there are
periods of rapid destruction and progression of the periodontal disease.(1)
Periodontitis is usually caused by interactions between many factors like
bacteria and their by products, immune cells and inflammatory mediators. The plaque
and calculus present in the teeth are capable of releasing certain substances like
lipopolysaccharides, antigens and other virulence factors which can travel into the
gingival tissue and start an inflammatory and immune response which leads to the
activation of host defense cells. The activation of host immune inflammatory process
initiate the release of inflammatory mediators such as cytokines, chemokines,
adipokines, arachidonic acid metabolites are released, which plays important role in
disease progression and tissue destruction.(2)
Adipokines are group of biologically active molecules produced by the
adipose tissue. Adipokines such as adiponectin and resistin play an important role in
periodontal inflammation. These adipokines and cytokines have been shown to play a
vital role in the host response to infection and periodontal inflammation.(3)
Adiponectin is a 30 kDa polypeptide which is specifically and highly
chromosome 3 at 3q2. It is different from other adipokines as adiponectin exerts
anti-inflammatory and anti-arthrogenic activities.(5)
Plasma adiponectin levels are reduced in periodontitis,but after periodontal
therapy it increases. Adiponectin exhibits its anti-inflammatory property by
stimulating IL-10 and heme oxygenase 1 which are known to be anti-inflammatory
and can inhibit the LPS stimulated NF-κB nuclear translocation. It also inhibits the
production of proinflammatory and proteolytic molecules in periodontal cells.(6)
Resistin is a 12.5 kDa adipokine that is a member of a cysteine rich secretory
protein family.(7) The term “resistin” was proposed for its role in insulin resistance.
The gene that encodes this molecule called Retn is located on chromosome 19 at
p13.3. Resistin increases the level of proinflammatory cytokines (IL-1, IL-6, TNF-α,
IL-12, MCP-1) in human peripheral blood mononuclear cells, macrophages and
hepatic stellate cells via the nuclear factor-κB pathway. This shows that resistin may
have a major role in inflammation.(5,7)
Elimination of all inflammation remains a critical objective of periodontal
therapy. Mechanical instrumentation of roots using curettes is an effective treatment
for patients with mild to moderate periodontitis. A number of treatment options are
available for the treatment of periodontal disease ranging from the traditional non
surgical periodontal therapy to recent surgical treatment modalities utilizing grafts,
membranes, growth factors and various other tissue engineered products and
techniques.(8)
inflammation (i.e., plaque, calculus, and endotoxins) in the oral environment. Both
hand instruments and ultrasonic instruments are capable of dramatically reducing the
numbers of subgingival microorganisms.(9) Despite various treatment options non
surgical periodontal therapy still remains the gold standard of the periodontal
treatment regimens.(8)
GCF is a source of sampling to investigate the condition of periodontal tissues.
GCF ingredients are composed of many components that have been described as
markers for periodontal disease development. These comprise host derived enzymes,
host response modifiers and tissue breakdown products.(10)
The literature is with limited information with respect to the association of
clinical parameters with adiponectin and resistin levels in GCF. The evaluation of
adiponectin and resistin in GCF of chronic periodontitis patients could be used as a
biomarker for prediction of active stage of the disease and periodontal destruction.
However the association between adiponectin and resistin levels in GCF and clinical
parameters has not been studied in detailed yet.
Hence this clinico-biochemical study was designed to evaluate the levels of
adiponectin and resistin in GCF of subjects with clinically healthy periodontium,
The aim of the present study was
1. To evaluate the levels of adiponectin in GCF of periodontally healthy and
diseased individuals.
2. To evaluate the levels of resistin in GCF of periodontally healthy and
diseased individuals.
3. To find out the association of adiponectin levels in GCF with its clinical
parameters before and after SRP in periodontitis.
4. To find out the association of resistin levels in GCF with its clinical
Listgarten MA et al., (1986)(11) reported periodontitis as an inflammatory
disease of the periodontium which was characterized by a progressive destruction of
the tissues supporting the tooth. It was caused due to microbial infections from more
than 300 species of bacteria seen in the oral cavity. Periodontitis progress as periodic,
relatively short episodes of rapid tissue destruction followed by some repair, and
prolonged intervening periods of disease remission.
Page RC et al., (1991)(12) studied about the role of inflammatory mediators in
the pathogenesis of periodontal disease. Periodontal diseases were multifactorial
conditions that are affected by both genetic and environmental risk factors. Risk
factors for periodontitis include smoking, genetic predisposition, age, gender, stress,
diet as well as medical conditions. Clinical parameters such as probing depth,
attachment loss, bleeding on probing, plaque index, radiographic assessment of
alveolar bone loss provide information about severity of periodontitis but they do not
measure disease activity.
Non surgical periodontal therapy
Greenstein G et al., (1992)(13) et al reported that scaling is defined as the
removal of plaque, calculus, and stain from the crown and root surfaces. Root planing
denotes the removal of cementum or surface dentin that is rough or impregnated with
calculus, toxins, or microorganisms. During root instrumentation both the procedures
are employed. Scaling and root planing decreased gram-negative organisms and
increased gram-positive rods and coccal species. This microbial shift was associated
with periodontal health. Scaling and root planing reduces inflammation and can
Greenstein G et al., (2000)(14) reviewed that mechanical instrumentation of
roots with curettes was an efficient treatment for patients with mild to moderate
periodontitis. Root planing can decrease probing depth, clinical attachment level gain
and reduce the progression of disease. Increase of clinical attachment level shows the
development of new connective-tissue attachment.
Bhansali R et al., (2014)(15) reviewed that treatment of periodontitis was
mainly directed towards elimination of pathogens in the subgingival biofilm. To
achieve this non surgical periodontal therapy can be employed. Non surgical
periodontal therapy has been proved to improve probing pocket depth and clinical
attachment level in mild to moderate periodontitis. It can also change host response in
the periodontal tissues. Mechanical therapy has both supragingival and subgingival
scaling and debridement of the roots to remove plaque, calculus, endotoxins and other
plaque retentive factors.
Goncalves TE et al., (2014)(16) conducted a study in which he observed 24
obese and 24 non obese patients with chronic periodontitis. The two group of patients
underwent SRP. Clinical parameters like probing depth, clinical attachment level,
bleeding on probing were seen before treatment and they were improved on 3 and 6
months after treatment.
Ozcan E et al., (2016)(17) conducted a study on 32 subjects. At 3 months after
SRP he found that the visfatin, chemerin and MMP-8 were higher in periodontitis
patients than that of controls. Visfatin, chemerin and MMP-8 in saliva can be used as
Adipokines
Tilg H et al., (2006)(18) reviewed about the biology of adipokines and
postulated that adipose tissue not only serves as an energy store but it was an
important factor in the regulation of various pathological processes. Adipose tissue
releases many products. The soluble factors released from adipose tissue are called
adipocytokines. Adiponectin, leptin, resistin and visfatin are adipocytokines. They
show an association between obesity, insulin resistance and related inflammatory
disorders.
Karthikeyan BV et al., (2007)(19) categorized 45 subjects into healthy,
chronic gingivitis and chronic periodontitis and conducted a study on leptin which
was an adipokine. GCF leptin concentration in healthy was higher than that of chronic
gingivitis and chronic periodontitis patients.
Rabe K et al., (2008)(20) reviewed that adipose tissue was an active endocrine
organ which regulates fat mass, nutrient homeostasis and secretes a large number of
bioactive mediators called adipokines which modulates hemostasis, blood pressure,
lipid and glucose metabolism, inflammation, and atherosclerosis.
Yilmaz G et al., (2014)(21) reported about ghrelin which was a adipokine that
has modulatory effects on immune system. Two major forms of ghrelin are seen:
i)Des-acylated ghrelin ii)Acylated ghrelin. This study includes 70 subjects grouped
into 35 chronic periodontitis patients and 35 individuals without periodontitis. The
results demonstrated that there was an increase of total and acylated ghrelin levels in
Jentsch S et al., (2017)(22) reported about chemerin which was identified as
an adipokine. Three chemerin receptors are known: i)chemokine-like receptor 1 ii)G
protein receptor 1 iii)C-C chemokine receptor-like 2. Totally 60 subjects were taken
and categorized into two main groups with chronic periodontitis patients and
periodontally healthy subjects. They were again categorized into subjects with normal
weight and overweight/obese subjects. The levels of acylated and total ghrelin and
chemerin were assessed in saliva, GCF and serum. This study demonstrated that
periodontitis patients had low ghrelin and high chemerin levels in the gingival
crevicular fluid which might be associated with periodontitis and obesity. Therefore
chemerin and ghrelin has been proposed as a biomarker for periodontitis.
Boyapati R et al., (2018)(23) conducted a study with fifty subjects categorized
into obese chronic periodontitis patients and non obese chronic periodontitis patients.
The effects of obesity and periodontal status on serum leptin and adiponectin levels of
both groups were analyzed using ELISA assay. He reported that the plaque index and
gingival index scores was higher in obese chronic periodontitis patients than non
obese chronic periodontitis patients. Serum leptin levels were increased and serum
adiponectin levels were decreased in obese chronic periodontitis patients compared to
non obese chronic periodontitis patients.
Biomarkers
Strimbu K et al., (2010)(24) reported that biomarkers may be defined as a
characteristic that is objectively measured and evaluated as an indicator of normal
Saliva as a diagnostic fluid in periodontal diseases
Malamud D et al., (2006)(25) has suggested the possible use of oral fluids such
as saliva for the assessment of periodontal diseases. Secretions from major salivary
glands, which has large number of proteins and peptides were found to be responsible
for maintaining the integrity of the oral cavity. Also, because of saliva’s importance in
oral biofilm formation and host defense, saliva may have a significant role in the
establishment and development of periodontal disease.
Kaufman E et al., (2000)(26) reviewed that saliva was a fluid easily collected
and has periodontal disease markers which was locally and systemically derived.
Therefore it can be used for patient specific diagnostic test for periodontitis. Host
derived enzymes in saliva were promising indicators for periodontal disease.
Totan A et al., (2006)(27) reported a study in which totally 50 subjects were
taken categorized into controls and patients with periodontal disease. It was found that
elevated salivary ALP activity in periodontitis could be associated with alveolar bone
destruction. Salivary ALP therefore can be used as a potential marker for monitoring
periodontal disease.
Chiappin S et al., (2007)(28) reviewed that saliva makes it possible to monitor
many biomarkers. It was because of its linkage with biochemical parameters which is
seen in circulation in other forms. It was also a simple and non-invasive method for
diagnosis.
Giannobile VW et al., (2009)(29) proposed that secreted saliva may have a
important role in initiation and progression of periodontal disease due to its
So biomarkers of saliva can be used to monitor health, onset of specific diseases,
treatment response and outcomes. Saliva has components of host derived and
microbial derived factors like protein degrading enzymes like elastase, lysozyme and
proteoglycans.
Kim JJ et al., (2013)(30) proposed that collecting saliva employs noninvasive
methods and since it was an abundant and easily accessible biofluid it was attractive
for diagnostic purposes because of its highly enriched content of disease biomarkers
that can be detected and assessed. Biomarkers for detection of diseases like sjogren’s
syndrome, pancreatic, breast and oral cancer or periodontal diseases can be found in
saliva.
Karam TA et al., (2015)(31) conducted a study on salivary resistin levels
which were assessed using ELISA in 42 subjects grouped into controls, gingivitis and
chronic periodontitis patients. Salivary resistin levels was increased in chronic
periodontitis patients when compared with other groups. It shows that there was an
association of periodontal conditions with serum resistin levels.
Gingival Crevicular Fluid
Curtis MA et al., (1988)(32) studied the total protein concentration of gingival
crevicular fluid in 32 healthy adolescents. He reported that GCF can be considered as
an promising medium for the detection of markers of periodontal disease activity. It
contains potential markers derived not only from host tissues and serum but it also has
subgingival microbial plaque and thus an broad range of candidate molecules can be
Armitage CG et al., (2004)(33) reviewed about the possible biomarkers in
gingival crevicular fluid which plays an important role in the progression of
periodontitis. These components were classified in 3 categories:1)Host derived
enzymes and their inhibitors 2)Inflammatory mediators and host response modifiers
3)Tissue breakdown products. Over 65 GCF components has been detected as
possible markers for the progression of periodontitis.
Gupta G et al., (2012)(34) reported that GCF was an inflammatory exudate
which seeps into gingival crevices or periodontal pockets around teeth with inflamed
gingiva. It was composed of serum and locally generated materials like tissue
breakdown products, inflammatory mediators and antibodies released against bacteria.
Its composition was the result of the interaction between bacterial biofilm in the tooth
surfaces and the cells of periodontal tissues. As GCF detects changes in the
periodontal tissues that secrete it, an thorough investigation of its components identify
potential diagnostic or prognostic markers playing a role in periodontitis.
Patel SP et al., (2013)(35) conducted a study on 96 subjects. The resistin levels
in GCF from periodontitis or diabetes mellitus related periodontitis patients were
elevated than that of healthy subjects. Gingival index was also found to be elevated in
periodontitis or diabetes mellitus related periodontitis patients than that of healthy
subjects.
Rahnama M et al., (2014)(36) reviewed that gingival crevicular fluid was seen
as a window for painless analysis of periodontitis by detecting the presence of
indicators and markers of connective tissue and bone destruction. Active phase of
Barros PS et al., (2016)(37) reported that GCF collection was painless and due
to this fact it has been widely studied for finding potential diagnostic biomarkers of
periodontal disease. GCF seems to be an attractive oral fluid because of its ease of
collection and allowing for sampling of multiple sites in the oral cavity at the same
time.
Dogan SB et al., (2016)(38) conducted a study on 60 subjects. Clinical
parameters like probing depth, bleeding on probing, plaque index, gingival index
levels were decreased and clinical attachment level was increased in the chronic
periodontitis groups 6 weeks after SRP. In this study increased vaspin and decreased
omentin-1 levels were seen in GCF by analyzing with ELISA in chronic periodontitis
patients both with and without diabetes. SRP was beneficial for decreasing levels of
both. Thus GCF vaspin and omentin-1 can be used as diagnostic and prognostic
markers for diabetes, periodontitis and also to check their response to therapy.
Adiponectin
Lihn AS et al., (2005)(39) reviewed about adiponectin which was a secreted
protein of 247 amino acids mainly produced by adipocytes. Adiponectin gene was
located on chromosome 3q27. Adiponectin has three domains: i)Globular domain
near the C terminus ii)A signal sequence at the N terminus iii)A collagen-like domain.
Adiponectinin circulation was seen in at least two forms as a hexamer: i)Low
molecular weight (LMW) oligomer has two trimers ii)High molecular weight (HMW)
oligomers has four to six trimers. High molecular weight oligomers form the major
circulation was low molecular weight oligomers. Two receptors for adiponectin was
identified i)ADIPOR1 ii)ADIPOR2.
Yamaguchi N et al., (2006)(40) observed that adiponectin acted as a potent
inhibitor of A.actinomycetemcomitans induced osteoclast formation which was
stimulated by Toll like receptor 4 ligand and receptor activator of NF-kB ligand. A
luciferase assay showed that adiponectin was able to suppress the TLR4-mediated
NF-kB activity in RAW264 cells. Adiponectin also inhibited TLR4-mediated
expression of the gene for A.actinomycetemcomitans inducible nitric oxide synthase
and production of nitric oxide in the cells. The observations in the study indicates that
adiponectin was a potent negative regulator of the initiation and progression of
periodontitis.
Furugen R et al., (2008)(41) reported about serum adiponectin levels in 158
subjects with or without periodontitis. Adiponectin levels were analysed with ELISA
assay. He observed decreased levels of adiponectin in subjects with periodontitis.
Adiponectin levels were negatively associated with leukocyte counts which increases
in periodontitis which shows that adiponectin was an anti-inflammatory mediator.
There was a tendency of decreased adiponectin levels in periodontitis in this study.
Saito T et al., (2008)(42) conducted a study on 76 subjects categorized as
periodontitis and controls. The serum level of adiponectin was analyzed with ELISA
assay. It was found that there was an association of periodontitis with decreased level
of adiponectin in serum.
Nagano Y et al., (2011)(43) conducted a study on 151 subjects categorized into
was assessed with an ELISA kit. High molecular weight form of adiponectin has been
reported to play a primary role in the physiological function of this adipocytokine.
The ratio of high molecular weight adiponectin to total adiponectin was significantly
decreased in subjects with periodontal pockets. These findings suggested that the ratio
of high molecular weight adiponectin to total adiponectin can be a novel biomarker
for evaluation of periodontal health.
Azawy VSA et al., (2015)(44) conducted a study on 55 subjects categorized
into chronic periodontitis patients and controls. He reported that on analyzing with
ELISA kit there is a significant decrease in serum adiponectin and increase of serum
leptin level in chronic periodontitis patients compared to control group. The ratio of
leptin/adiponectin was increased in periodontitis patient group when compared with
the ratio in control group. This study indicates that serum levels of leptin and
adiponectin plays an important role in pathogenesis of periodontitis and the relative
leptin/adiponectin ratio is indicative of periodontitis.
Resistin
Furugen R et al., (2010)(5) reviewed about resistin which was a 12.5 kDa
polypeptide hormone and a cysteine rich protein seen in inflammatory zone. Human
resistin has 108 amino acids whereas rat and mouse resistin have 114 amino acids. It
was a member of a family of tissue specific signaling molecules called resistin like
molecules. Resistin belongs to the “found in inflammatory zones” family (FIZZ).
Resistin was produced by white and brown adipose tissues but has also been seen in
and was inhibited by rosiglitazone and peroxisome proliferator activated receptor
agonists.
Furugen R et al., (2011)(45) reported that A.actinomycetemcomitans produced
leukotoxin induced extracellular release of human neutrophil derived resistin. There
was also an increase in the prevalence and levels of A.actinomycetemcomitans in
periodontal patients which contribute to their higher circulating levels of resistin.
Also resistin was shown to mediate its proinflammatory effects via TLR-4 in culture
supernatants of neutrophils. The expression level of TLR-4 was higher in all
periodontal patients than in healthy individuals.
Devanoorkar A et al., (2012)(46) conducted a study on 40 patients categorized
as healthy and chronic periodontitis. It was observed that periodontal parameters like
plaque index, gingival index, sulcus bleeding index, probing depth were reduced after
6-8 weeks with SRP. Serum resistin levels were assessed with ELISA assay. It was
found that there was an increase in the serum resistin level in periodontitis group.
Serum resistin level decreased after SRP in periodontitis patients.
Devanoorkar A et al., (2014)(47) reviewed that periodontal pathogens produce
lipopolysaccharides which induce the resistin gene in macrophages through a cascade
involving the production of proinflammatory mediators. It was observed that levels of
resistin were increased in periodontitis and resistin plays an important role in inducing
insulin resistance increasing the risk for type II diabetes. Obesity was another
important risk factor for type II diabetes and has also been linked positively to
periodontitis. Obesity, diabetes and chronic periodontitis are related to each other and
thereby showing a triangular relationship among the above three conditions and
resistin may act as a connecting molecular link between these conditions.
Sabir DA et al., (2015)(48) reported a study by evaluating salivary resistin
levels using ELISA. The study included 75 subjects and they were grouped into
healthy and chronic periodontitis patients with and without diabetes. Clinical
periodontal parameters like plaque index, gingival index, bleeding on probing,
probing pocket depth and clinical attachment level were worsened in chronic
periodontitis with type 2 diabetes mellitus. Salivary resistin levels were elevated in
chronic periodontitis with type 2 diabetes mellitus. Salivary Resistin could thus be
used as a biomarker for periodontitis and type 2 diabetes mellitus.
Mittal M et al., (2015)(49) conducted a study on 100 subjects categorized into
healthy, chronic periodontitis patients, rheumatoid arthritis patients and patients with
both. The clinical parameters like plaque index, gingival index, probing depth were
increased in chronic periodontitis patients and subjects with both chronic periodontitis
and rheumatoid arthritis. GCF resistin levels when analysed with ELISA showed a
decrease in healthy subjects whereas it was markedly increased in patients with
chronic periodontitis and rheumatoid arthritis. Hence it can be concluded that GCF
resistin can be considered as potential inflammatory marker for periodontitis and
rheumatoid arthritis.
Rao RM et al., (2016)(50) conducted a study on 30 subjects grouped into obese
healthy and obese chronic periodontitis patients. Clinical parameters like gingival
with periodontitis. ELISA was used to analyse resistin levels in both serum and saliva.
Resistin levels were markedly elevated in obese periodontitis group of patients.
Suresh S et al., (2016)(51) conducted a study on 90 subjects in which GCF
resistin levels were analysed using ELISA. It was demonstrated that obese subjects
with periodontitis have higher GCF resistin levels when compared to nonobese
subjects with healthy periodontium.
Esfahrood ZR et al., (2018)(52) reported a study on salivary resistin levels in
34 subjects grouped into healthy and chronic periodontitis. Resistin levels were
assessed using ELISA. Higher resistin levels were seen in chronic periodontitis
patients. Salivary resistin can thus be used to determine the inflammatory status in
A randomized controlled clinical study was conducted to evaluate the GCF
levels of adiponectin and resistin in periodontal health, disease and after treatment.
The protocol was reviewed and approved by institutional ethical board. A informed
consent was obtained from the patients and the study related procedures were
explained. A total of 50 subjects were recruited from the outpatient Department of
Periodontics, J.K.K Nattraja Dental College and Hospitals, Komorapalayam,
Tamilnadu based on the following criteria.
INCLUSION CRITERIA
1. Patient age group of 20-50 years of both sexes.
2. Minimum of 20 teeth to be present in every patient.
3. Minimum of 2 sites with more than 5mm of pocket depth as assessed by
williams periodontal probe.
4. Minimum of 6 sites which shows bleeding on probing.
5. Subjects who had not received any periodontal treatment in previous 6
months.
6. Systemically and periodontally healthy subjects with probing depth less than 3
mm for the healthy group.
EXCLUSION CRITERIA
1. Patients suffering from known systemic diseases.
2. Patients who are pregnant and lactating.
4. Patients who received any chemotherapeutic mouth rinse or oral irrigation
during past 6 months.
5. Patients who received surgical or non surgical therapy in last 6 months.
6. Patients with aggressive periodontitis.
7. Patients who received any antibiotic therapy in the last 6 months.
A randomized controlled clinical study was conducted in a total of 50 patients
categorized into 25 patients who were periodontally and systemically healthy and 25
patients with generalized chronic periodontitis. GCF samples were collected from the
patients (Fig 3). Clinical parameters were measured before and after SRP.
Biochemical analysis of adiponectin and resistin were assessed in the GCF samples.
STUDY DESIGN
Group I (healthy): Consists of 25 subjects with clinically healthy periodontium.
Group II (chronic periodontitis): Consists of 25 subjects with clinical signs of
gingival inflammation.
Probing depth (PD) ≥ 5mm
Group III (after treatment group): Consists of 25 subjects of group II treated by
CLINICAL PARAMETERS
The following variables were measured at baseline and at 21 days of scaling
and root planing.
Plaque index (PI) (Silness P and Loe H 1964)
Gingival index (GI) (Loe H and Silness P 1963)
Sulcus Bleeding Index (SBI) (Muhlemann HR and Son S 1971)
Probing Pocket Depth (PPD)
Clinical attachment level (CAL)
1. Plaque index (Silness P and Loe H 1964)
The four gingival areas of the tooth surfaces examined are the disto-facial,
facial, mesio-facial and lingual surfaces using explorer.
Scoring was as follows:
0 – No plaque.
1 – A film of plaque adhering to the free gingival margin and adjacent area of the
tooth. The plaque may be seen only by running a probe across the tooth surface.
2 – Moderate accumulation of soft deposits within the gingival pocket, on the gingival
margin and/or adjacent tooth surface, which can be seen by the naked eye.
3 – Abundance of soft matter within the gingival pocket and/or on the gingival margin
The scores of the four areas of the tooth can be summed and divided by four
to give the PI for the tooth. A score from
0.1– 0.9 – Good
1.0– 1.9 – Fair
2.0– 3.0 – Poor
2. Gingival index (Loe H and Silness P 1963)
The Gingival index was created to assess the severity of gingivitis based on its
color, consistency and bleeding on probing. The tissues surrounding each tooth are
divided into four gingival scoring units: Distal facial papillae, Facial margin, Mesial
facial papillae, Entire lingual gingival margin.
The criteria are
0 – Normal gingiva
1 – Mild inflammation – slight change in color and slight oedema but no bleeding on
probing.
2 – Moderate inflammation – redness, oedema and bleeding on probing.
3 – Severe inflammation – marked redness and oedema, ulceration with tendency to
spontaneous bleeding.
The scores of the four areas of the tooth can be summed and divided by four
A score from.
0.1– 1.0 – Mild inflammation
1.1– 2.0 – Moderate inflammation
2.1 – 3.0 – Severe inflammation
3. Sulcus Bleeding Index (Muhlemann HR and Son S 1971)
An early sign of gingivitis is bleeding on probing. The criteria for scoring are
as follows:
Score 0 – healthy looking papillary and marginal gingiva, no bleeding on probing;
Score 1 – healthy looking gingiva, bleeding on probing;
Score 2 – bleeding on probing, change in color, no edema;
Score 3 – bleeding on probing, change in color, slight edema;
Score 4 –bleeding on probing, change in color, obvious edema;
Score 5 –spontaneous bleeding, change in color, marked edema.
Four gingival units are scored systematically for each tooth: the labial and
lingual marginal gingival (M units) and the mesial and distal papillary gingival (P
units). Scores for these units are added and divided by four. Adding the scores of the
undivided teeth and dividing them by the number of teeth can determine the sulcus
bleeding index.
4. Probing pocket depth (PPD)
The depth of the pocket was measured using william’s graduated periodontal
probe. The probe was inserted parallel to the long axis of the tooth gently, until
resistance was felt and the readings were recorded to the nearest millimeter from the
gingival margin to the base of the pocket. Acrylic stents were used to standardize the
path of insertion and angulations of the probe.
5. Clinical attachment level (CAL)
The level of attachment is the distance between the base of the pocket and
Cementoenamel Junction (CEJ) or a fixed reference point. The distance from the CEJ
(if CEJ not detected, the coronal border of the stent was used) to the base of the
pocket was measured. The readings were recorded to the nearest millimetre.
Clinical evaluation of subjects
Subjects were selected for each group after a brief and precise case history
recording that included patients chief complaint and clinical examination. Clinical
examination was done using a sterile mouth mirror and a William’s periodontal probe.
Site specific scoring was followed, where in, the site showing most severe
inflammatory signs or greater amount of attachment loss was selected for GCF sample
collection. PI and GI scores were recorded before to aid in site selection and the PD
and CAL measurements were recorded after GCF collection to avoid contamination
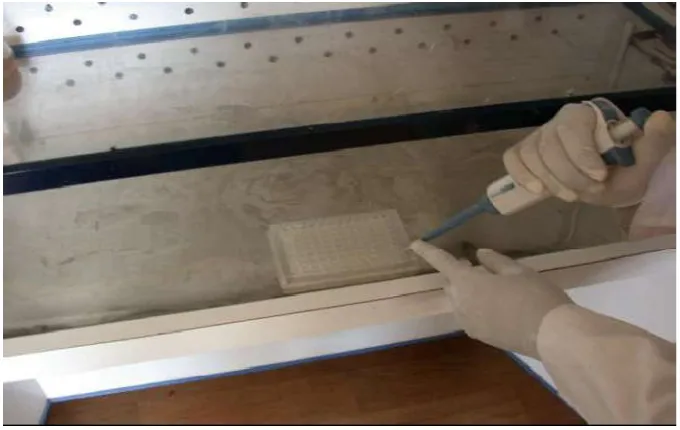
Procedure for gingival crevicular fluid collection
Subjects selected for sampling were made to sit comfortably in an upright
position on the dental chair with proper illumination. The test site selected for
sampling was air dried, isolated with cotton roll and supragingival plaque was
removed without touching marginal gingiva. Sample of GCF were obtained by
placing 1-5µL calibrated volumetric microcapillary pipettes which were obtained
from sigma Aldrich chemicals company, Limited, USA (Fig 2). From each test site, a
standardized volume of 2µL was collected using the calibration on micropipette and
placing the tip of the pipette extracrevicularly for 30 seconds. GCF contaminated with
saliva and blood were discarded. Samples of GCF were collected at the initial visit in
group I, group II, group III subjects. Each gingival crevicular fluid sample was
immediately placed into a sterile, labelled eppendorf tube and placed on ice then
transported to the laboratory for processing.
Non-surgical Periodontal therapy
Periodontal treatment (SRP) was performed for periodontitis patients at the
same appointment after GCF collection. At baseline full mouth ultrasonic scaling was
done. Under local anesthesia with 2% lignocaine solution (1:80,000), root planning
was done using area-specific double-ended Gracey curettes (Hu-Friedy). After 21
days, GCF was collected from the same site of the subjects in group III. Clinical
Bio-Chemical evaluation of adiponectin and resistin using ELISA
The samples were then assayed for adiponectin and resistin levels by using
Enzyme linked Immunosorbent Assay Kit for adipnectin (ITEH2593) and resistin
Determination of adiponectin level in GCF using ELISA
Principle of the Assay
This kit was based on sandwich enzyme-linked immune-sorbent assay
technology. Anti- ADP antibody was pre-coated onto 96-well plates. The biotin
conjugated anti- ADP antibody was used as detection antibody. The standards, test
samples and biotin conjugated detection antibody were added to the wells
subsequently, and washed with wash buffer. HRP-Streptavidin was added and
unbound conjugates were washed away with wash buffer. TMB substrates were used
to visualize HRP enzymatic reaction. TMB was catalyzed by HRP to produce a blue
color product that changed into yellow after adding acidic stop solution. The density
of yellow is proportional to the ADP amount of sample captured in plate. Read the
O.D. absorbance at 450nm in a microplate reader, and then the concentration of ADP
can be calculated.
Kit components
1. ELISA microplate(Dismountable)
2. Lyophilised standard
3. Sample/Standard dilution buffer
4. Biotin-labelled antibody(Concentrated)
5. Antibody dilution buffer
6. HRP-Streptavidin conjugate(SABC)
7. TMB substrate
9. Wash buffer
10. Plate sealer
Precautions
1. To inspect the validity of experiment operation and the appropriateness of
sample dilution proportion, pilot experiment using standards and a small
number of samples is recommended.
2. After opening and before using, keep plate dry.
3. Before using the Kit, spin tubes and bring down all components to the bottom
of tubes.
4. Storage TMB reagents avoid light.
5. Washing process is very important, not fully wash easily cause a false
positive.
6. Duplicate well assay is recommended for both standard and sample testing.
7. Don’t let Micro plate dry at the assay, for dry plate will inactivate active
components on plate.
8. Don’t reuse tips and tubes to avoid cross contamination.
9. Avoid using the reagents from different batches together.
Material required but not supplied
1. Microplate reader (wavelength: 450nm)
2. 37°C incubator
3. Automated plate washer
6. Deionized or distilled water
Manual washing
Discard the solution in the plate without touching the side walls. Clap the plate
on absorbent filter papers or other absorbent material. Fill each well completely with
350ul wash buffer and soak for 1 to 2 minutes, then aspirate contents from the plate,
and clap the plate on absorbent filter papers or other absorbent material. Repeat this
procedure two more times for a total of three washes.
Automatic washing
Aspirate all wells, and then wash plate three times with 350ul wash buffer.
After the final wash, invert plate, and clap the plate on absorbent filter papers or other
absorbent material. It is recommended that the washer shall be set for soaking 1
minute.
Assay procedure
1. Wash plate 2 times before adding standard, sample and control (zero) wells.
2. Add 100μL standard or sample to each well and incubate for 90 minutes at
37°C.
3. Aspirate and wash plates 2 times.
4. Add 100μL biotin-labeled antibody working solution to each well and
incubate for 60 minutes at 37°C.
5. Aspirate and wash plates 3 times.
6. Add 100μL SABC working solution into each well and incubate for 30
7. Aspirate and wash plates 5 times.
8. Add 90μL TMB substrate. Incubate 15 -30 minutes at 37°C.
9. Add 50μL stop solution. Read at 450nm immediately.
10. Calculation.
Determination of resistin level in GCF using ELISA
Principle of the assay
This kit was based on sandwich enzyme-linked immune-sorbent assay
technology. Anti- RETN antibody was pre-coated onto 96-well plates. The biotin
conjugated anti-RETN antibody was used as detection antibody. The standards, test
samples and biotin conjugated detection antibody were added to the wells
subsequently, and wash with wash buffer. HRP-Streptavidin was added and unbound
conjugates were washed away with wash buffer. TMB substrates were used to
visualize HRP enzymatic reaction. TMB was catalyzed by HRP to produce a blue
color product that changed into yellow after adding acidic stop solution. The density
of yellow is proportional to the RETN amount of sample captured in plate. Read the
O.D. absorbance at 450nm in a microplate reader, and then the concentration of
RETN can be calculated.
Kit components
1. Micro ELISA plate (Dismountable)
2. Lyophilised standard
5. Antibody dilution buffer
6. HRP-Streptavidin conjugate(SABC)
7. SABC dilution buffer
8. TMB substrate
9. Stop solution
10. Wash buffer
11. Plate sealer
Precautions for use
1. To inspect the validity of experiment operation and the appropriateness of
sample dilution proportion, pilot experiment using standards and a small
number of samples is recommended.
2. After opening and before using, keep plate dry.
3. Before using the Kit, spin tubes and bring down all components to the bottom
of tubes.
4. Storage TMB reagents avoid light.
5. Washing process is very important, not fully wash easily cause a false
positive.
6. Duplicate well assay is recommended for both standard and sample testing.
7. Don’t let Micro plate dry at the assay, for dry plate will inactivate active
components on plate.
8. Don’t reuse tips and tubes to avoid cross contamination.
Material required but not supplied
1. Microplate reader (wavelength: 450nm)
2. 37°C incubator
3. Automated plate washer
4. Precision single and multi-channel pipette and disposable tips
5. Clean tubes and Eppendorf tubes
6. Deionized or distilled water
Manual washing
Discard the solution in the plate without touching the side walls. Clap the plate
on absorbent filter papers or other absorbent material. Fill each well completely with
350ul wash buffer and soak for 1 to 2 minutes, then aspirate contents from the plate,
and clap the plate on absorbent filter papers or other absorbent material. Repeat this
procedure two more times for a total of three washes.
Automated washing
Aspirate all wells, then wash plate three times with 350ul wash buffer. After
the final wash, invert plate, and clap the plate on absorbent filter papers or other
absorbent material. It is recommended that the washer be set for a soaking time of 1
minute.
2. Add 100μL standard or sample to each well for 90 minutes at 37°C.
3. Add 100μL biotin-detection antibody working solution to each well for 60
minutes at 37°C. Aspirate and wash 3 times.
4. Add 100μL SABC working solution to each well. Incubate for 30 minutes at
37°C.
5. Aspirate and wash 5 times.
6. Add 90μL TMB substrate. Incubate 15 -30 minutes at 37°C.
7. Add 50μL stop solution. Read at 450nm immediately.
8. Calculation of results.
APPENDIX - 1
PROFORMA
NAME: O.P NUMBER:
AGE: DATE:
SEX: CASE NO:
ADDRESS: OCCUPATION:
CHIEF COMPLAINT:
DENTAL HISTORY:
MEDICAL HISTORY:
PERSONAL HISTORY:
CLINICAL PARAMETERS
AT BASELINE
PLAQUE INDEX
Score
Interpretation
GINGIVAL INDEX
Score
Interpretation
B
P
8 7 6 5 4 3 2 1 1 2 3 4 5 6 7 8
B
L
B
P
8 7 6 5 4 3 2 1 1 2 3 4 5 6 7 8
B
SULCUS BLEEDING INDEX
Score:
Interpretation:
PROBING POCKET DEPTH (mm)
Score:
CLINICAL ATTACHMENT LEVEL (mm)
Score:
B
P
8 7 6 5 4 3 2 1 1 2 3 4 5 6 7 8
B
L
8 7 6 5 4 3 2 1 1 2 3 4 5 6 7 8
8 7 6 5 4 3 2 1 1 2 3 4 5 6 7 8
AT 3 WEEKS
PLAQUE INDEX
Score:
Interpretation:
GINGIVAL INDEX
Score:
Interpretation:
B
P
8 7 6 5 4 3 2 1 1 2 3 4 5 6 7 8
B
L
B
P
8 7 6 5 4 3 2 1 1 2 3 4 5 6 7 8
B
SULCUS BLEEDING INDEX
Score:
Interpretation:
PROBING POCKET DEPTH (mm)
Score:
CLINICAL ATTACHMENT LEVEL (mm)
Score:
B
P
8 7 6 5 4 3 2 1 1 2 3 4 5 6 7 8
B
L
8 7 6 5 4 3 2 1 1 2 3 4 5 6 7 8
8 7 6 5 4 3 2 1 1 2 3 4 5 6 7 8
J.K.K. NATTRAJA DENTAL COLLEGE, KOMARAPALAYAM
DEPARTMENT OF PERIODONTICS
INFORMED CONSENT OBTAINED FROM THE PATIENT
PATIENT NAME
I have been explained about the nature and purpose of the study in which,
I have been asked to participate. I understand that I am free to withdraw my consent
and discontinue at any time without prejudice to me or effect on my treatment.
I have been given the opportunity to question about the material and study.
I have also given the consent for photographs to be taken at the beginning, during and
end of the study. I agree to participate in this study.
I hereby give the consent to be included in this study.
Place: Signature of patient
Date:
APPENDIX – 2
ARMAMENTARIUM (Fig 1)
MATERIALS AND INSTRUMENTS USED FOR THE STUDY
Gloves
Mouth mask
Patient apron
Chair apron
Head cap
Sterile cotton rolls
Gauze
Saline
Kidney tray
Betadine
Lignocaine
Syringe
Explorer
Williams periodontal probe
Hu-Friedy Gracey Curettes
Microcapillary pipettes
Eppendorf tubes
ARMAMENTARIUM
Fig 1: Armamentarium used for GCF collection and treatment
[image:56.595.136.503.527.692.2]Fig 3: Clinical cases
Pre operative GCF sample collection
Fig 4: Adiponectin ELISA Kit
[image:58.595.176.460.412.663.2]Fig 6: ELISA reader
[image:59.595.147.487.421.636.2]This clinico-biochemical study was done to explore the association between
adiponectin and resistin levels in GCF in periodontal health and disease and to
quantify the difference in adiponectin and resistin levels following periodontal
therapy.
This randomized controlled clinical study consists of 50 subjects divided into
3 groups i.e., healthy (Group I, 25 subjects), chronic periodontitis (Group II, 25
subjects) and chronic periodontitis after treatment (Group III, 25 subjects) aged
between 20-50 years from whom GCF were collected to estimate the levels of
adiponectin and resistin using ELISA.
The results obtained were analysed statistically and comparisons of each group
done using paired student t-distribution test. Further pearson correlation analysis was
done to identify the correlation coefficient between the levels of adiponectin, resistin
and clinical parameters.
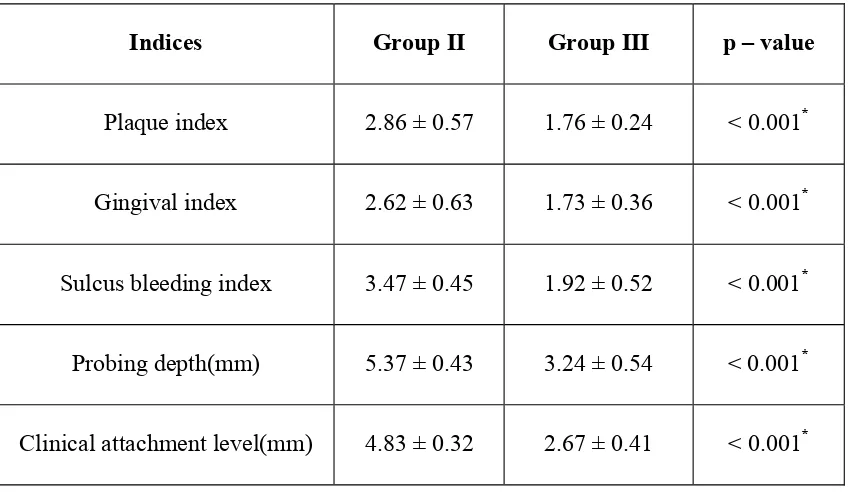
The plaque index scores (PI) in group II was (2.86 ± 0.57) and reduced in
group III to (1.76 ± 0.24). The comparison of PI scores between group II and group
III shows a statistically significant difference with a P- value of < 0.001*. The results
are shown in table 1 and graph 1.
The gingival index (GI) scores in group II was (2.62 ± 0.63) and reduced in
group III to (1.73 ± 0.36). The Comparison of GI scores between group II and group
III shows a statistically significant difference with a P-value of < 0.001*. The results
are shown in table 1 and graph 1.
and group III shows a statistically significant difference with a P-value of < 0.001*.
The results are shown in table 1 and graph 1.
The probing depth (PD) scores in group II was (5.37 ± 0.43) and reduced in
group III to (3.24 ± 0.54). The comparison of PD scores between group II and group
III shows a statistically significant difference with a P-value of < 0.001*. The results
are shown in table 1 and graph 2.
The clinical attachment level (CAL) scores in group II was (4.83 ± 0.32) and
reduced in group III to (2.67 ± 0.41). The comparison of CAL scores between group
II and group III shows a statistically significant difference with a P-value of < 0.001*.
The results are shown in table 1 and graph 3.
The mean adiponectin levels in group I was (20.18 ± 0.26 ng/ml). The mean
adiponectin levels in group II was (9.96 ± 0.27 ng/ml) and group III was (15.46 ± 0.32
ng/ml). The results are shown in table 2 and graph 4. A statistically significant
difference was observed between group II and group III with a P-value of <0.05.
Further analysis was carried out to find out which pairs differ significantly at
5% level of significance. A statistically significant difference was observed between
group II and group III and between group I and group II with a P-value of <0.05.
Statistically insignificant difference was obtained when the mean levels of
adiponectin were compared between group I and group III with a P-value of >0.05.
The results suggested that adiponectin levels decreased progressively in GCF from
health to periodontitis and increased after periodontal therapy.
Pearson correlation analysis was done to test for any correlation between the
CAL in group II and group III. A negative correlation was found between the clinical
parameters and group II and group III. The results are shown in table 4 and graph
6,7,8,9,10,11,12,13,14,15.
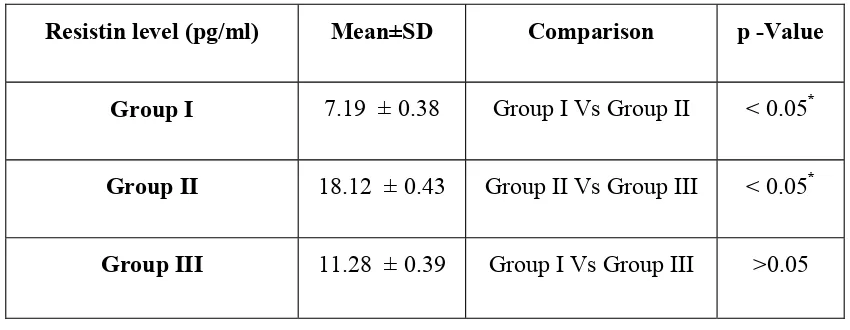
The mean resistin levels in group I was (7.19 ± 0.38 pg/ml). The mean levels
of group II was (18.12 ± 0.43 pg/ml) and group III was (11.28 ± 0.39 pg/ml). The
results are shown in table 3 and graph 5. A statistically significant difference was
observed between group II and group III with a P-value of <0.05.
Further analysis was carried out to find out which pairs differ significantly at
5% level of significance. A statistically significant difference was observed between
group II and group III and between group I and group II with a P-value of <0.05. A
statistically insignificant difference was obtained when the mean levels of resistin
were compared between group I and group III with a P-value of >0.05. The results
suggested that resistin levels increased progressively in GCF from health to
periodontitis and decreased after periodontal therapy.
Pearson correlation analysis was done to test for any correlation between the
resistin levels in GCF with the disease severity measures i.e., PI, GI, SBI, PD, CAL in
group II and group III. A positive correlation was found between the clinical
parameters and group II and group III. The results are shown in table 4 and graph 6, 7,
8, 9, 10, 11, 12, 13, 14, 15.
Comparison of clinical parameters between group II and group III
Indices Group II Group III p – value
Plaque index 2.86 ± 0.57 1.76 ± 0.24 < 0.001*
Gingival index 2.62 ± 0.63 1.73 ± 0.36 < 0.001*
Sulcus bleeding index 3.47 ± 0.45 1.92 ± 0.52 < 0.001*
Probing depth(mm) 5.37 ± 0.43 3.24 ± 0.54 < 0.001*
Clinical attachment level(mm) 4.83 ± 0.32 2.67 ± 0.41 < 0.001*
*
[image:65.595.105.529.159.405.2]Adiponectin level (ng/ml) Mean±SD Comparison p -Value
Group I 20.18 ± 0.26 Group I Vs Group II < 0.05*
Group II 9.96 ± 0.27 Group II Vs Group III < 0.05*
Group III 15.46 ± 0.32 Group I Vs Group III > 0.05
*
[image:66.595.102.534.152.310.2]p – value < 0.05 denotes statistically significant at 5% level. p – value >0.05 denotes statistically insignificant at 5% level.
Table 3
Comparison of Resistin levels between groups
Resistin level (pg/ml) Mean±SD Comparison p -Value
Group I 7.19 ± 0.38 Group I Vs Group II < 0.05*
Group II 18.12 ± 0.43 Group II Vs Group III < 0.05*
Group III 11.28 ± 0.39 Group I Vs Group III >0.05
*
[image:66.595.103.528.491.656.2]in each group
Correlation coefficient of group II and group III
Clinical parameters
Adiponectin Resistin
Group II Group III Group II Group III
[image:67.595.75.563.220.429.2]Graph 1
Comparison of plaque index, gingival index and sulcus bleeding index between
group II and group III
Graph 2
Comparison of probing depth between group II and group III Graph 1
Comparison of plaque index, gingival index and sulcus bleeding index between
group II and group III
Graph 2
Comparison of probing depth between group II and group III Graph 1
Comparison of plaque index, gingival index and sulcus bleeding index between
group II and group III
Graph 2
Comparison of probing depth between group II and group III
Scores 0 1 2 3 4 5 6 PPD (mm) Graph 1
Comparison of plaque index, gingival index and sulcus bleeding index between
group II and group III
Graph 2
Comparison of probing depth between group II and group III
0 0.5 1 1.5 2 2.5 3 3.5 4 Plaque index Scores 0 1 2 3 4 5 6 Graph 1
Comparison of plaque index, gingival index and sulcus bleeding index between
group II and group III
Graph 2
Comparison of probing depth between group II and group III
Plaque index
GROUP II
Graph 1
Comparison of plaque index, gingival index and sulcus bleeding index between
group II and group III
Graph 2
Comparison of probing depth between group II and group III
Gingival index
Indices
GROUP II
Probing pocket depth
Graph 1
Comparison of plaque index, gingival index and sulcus bleeding index between
group II and group III
Graph 2
Comparison of probing depth between group II and group III
Gingival index Sulcus Bleeding index
Indices
Probing pocket depth
Graph 1
Comparison of plaque index, gingival index and sulcus bleeding index between
group II and group III
Graph 2
Comparison of probing depth between group II and group III
Sulcus Bleeding index
GROUP III
Probing pocket depth
Graph 1
Comparison of plaque index, gingival index and sulcus bleeding index between
group II and group III
Graph 2
Comparison of probing depth between group II and group III
Group II
Group III
GROUP III
Graph 1
Comparison of plaque index, gingival index and sulcus bleeding index between
group II and group III
Graph 2
Comparison of probing depth between group II and group III
Group III
Graph 1
Comparison of plaque index, gingival index and sulcus bleeding index between
group II and group III
Graph 2
Comparison of probing depth between group II and group III Graph 1
Comparison of plaque index, gingival index and sulcus bleeding index between
group II and group III
Graph 2
Graph 3
Comparison of clinical attachment level between group II and group III Graph 3
Comparison of clinical attachment level between group II and group III Graph 3
Comparison of clinical attachment level between group II and group III
0 1 2 3 4 5 6 CAL (mm) Graph 3
Comparison of clinical attachment level between group II and group III
0 1 2 3 4 5 6 Graph 3
Comparison of clinical attachment level between group II and group III
GROUP II
Graph 3
Comparison of clinical attachment level between group II and group III
GROUP II
Clinical attachment level
Graph 3
Comparison of clinical attachment level between group II and group III
Clinical attachment level
Graph 3
Comparison of clinical attachment level between group II and group III
GROUP III
Clinical attachment level
Graph 3
Comparison of clinical attachment level between group II and group III
GROUP III
Graph 3
Comparison of clinical attachment level between group II and group III Graph 3
Comparison of clinical attachment level between group II and group III Graph 3
Graph 4
Comparison of Adiponectin levels between groups
Graph 5
Comparison of Resistin levels between groups
Graph 6 Graph 7 0 2 4 6 8 10 12 14 16 18 20 22
1 2 3 4 5 6 7 8 9 1 0 1 1 1 2 1 3 1 4 1 5 1 6 1 7 1 8 1 9 2 0 2 1 2 2 2 3 2 4 2 5
C O R R E L AT I O N O F P L A Q U E I N D E X W I T H A D I P O N E C T I N A N D R E S I S T I N I N G R O U P I I
Adiponectin pre op Plaque Index baseline Resistin pre op
0 2 4 6 8 10 12 14 16 18 20
1 2 3 4 5 6 7 8 9 1 0 1 1 1 2 1 3 1 4 1 5 1 6 1 7 1 8 1 9 2 0 2 1 2 2 2 3 2 4 2 5
C O R R E L AT I O N O F P L A Q U E I N D E X W I T H A D I P O N E C T I N A N D R E S I S T I N I N G R O U P I I I
Graph 8 Graph 9 0 2 4 6 8 10 12 14 16 18 20 22
1 2 3 4 5 6 7 8 9 1 0 1 1 1 2 1 3 1 4 1 5 1 6 1 7 1 8 1 9 2 0 2 1 2 2 2 3 2 4 2 5
C O R R E L AT I O N O F G I N G I VA L I N D E X W I T H A D I P O N E C T I N A N D R E S I S T I N I N G R O U P I I
Adiponectin pre op Gingival Index baseline Resistin post op
0 2 4 6 8 10 12 14 16 18 20
1 2 3 4 5 6 7 8 9 1 0 1 1 1 2 1 3 1 4 1 5 1 6 1 7 1 8 1 9 2 0 2 1 2 2 2 3 2 4 2 5
C O R R E L AT I O N O F G I N G I VA L I N D E X W I T H A D I P O N E C T I N A N D R E S I S T I N I N G R O U P I I I