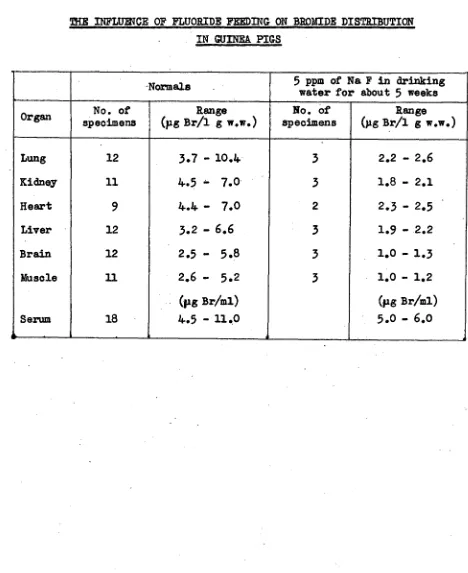
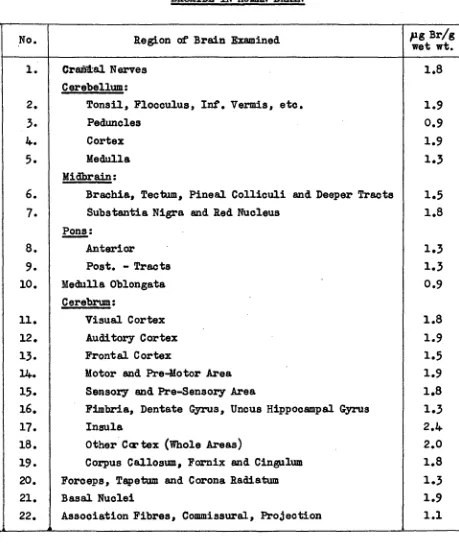
The metabolism of bromine in mammals
Full text
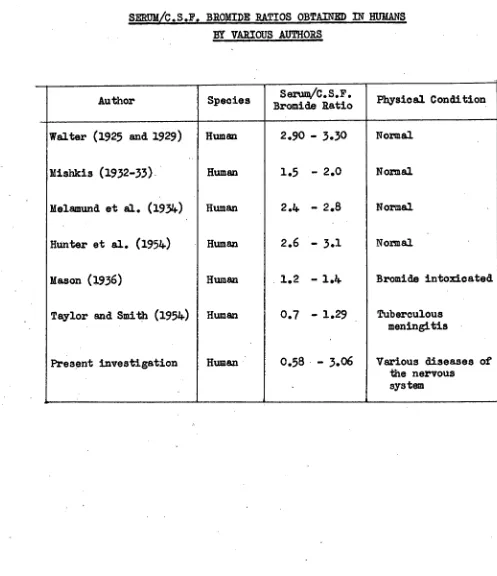
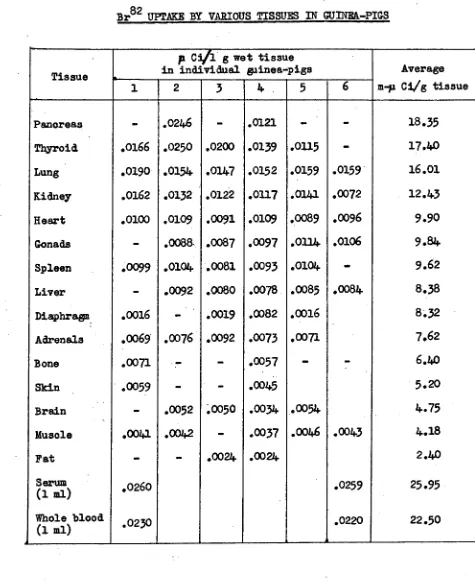
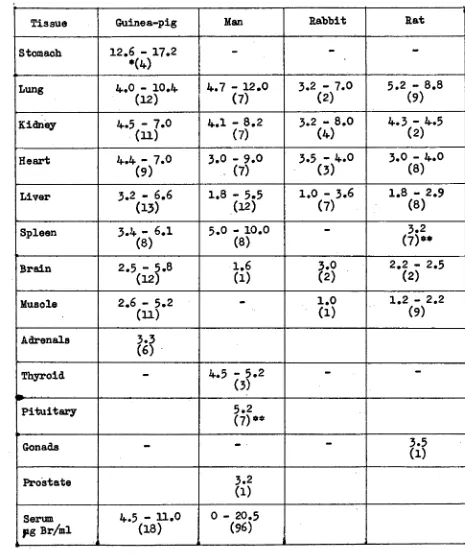
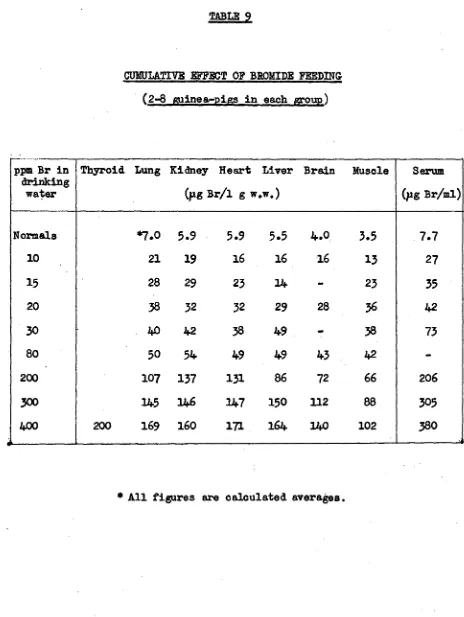
Figure
Related documents
Massively multiplayer online role-playing games (MMORPGs) are a fast-growing computer game genre; they are multiplayer role-playing games (RPGs) played online over the internet in
Home theater experts agree that a theater-like experience is only achieved when the screen size is large enough with respect to the viewing distance from the screen – generally, when
Proposition 103 specifically refers to only several parts of the administrative rate review process: Section 1861.05, subdivision (b) provides that an insurer which desires to
Deletion mutants of FgABC1 showed reduced virulence towards wheat in crown and root infection assays but were unaltered in infectivity on barley.. Expression
Sales location, product type, number of advertising methods used, high-speed Internet connection, land tenure arrangement, and gross farm sales is found to be significantly related
Combining Properties and Evidence to Support Overall Confor- mance Claims: Safety-critical system development increasingly relies on using a diverse set of verification
Todavia, nos anos 1800, essas práticas já não eram vistas com tanta naturalidade, pelos menos pelas instâncias de poder, pois não estava de acordo com uma sociedade que se
PERFORMANCE of DIABETES SELF-CARE Cognitive Ability Time Management Ability to organize and prioritize Set Goals Reprioritize Biological Gender Female Emotional State
