R E S E A R C H
Open Access
Helminth communities from two urban rat
populations in Kuala Lumpur, Malaysia
Siti N Mohd Zain
1, Jerzy M Behnke
2*and John W Lewis
3Abstract
Background:The prevalence of parasitic infections among commensal animals such as black and brown rats in many tropical countries is high and in comparison with studies on rodents in temperate climates, little is known about the community structure of their parasites. Rodent borne parasites pose threats to human health since people living in close proximity to rodent populations can be exposed to infection.
Methods:The helminth community structures of two urban rat populations in Kuala Lumpur, Malaysia were investigated. The rats were from two contrasting sites in the city caught over a period of 21 months in 2000-2002.
Results:Eleven species of helminth parasites comprising seven nematodes (Heterakis spumosum, Mastophorus muris, Nippostrongylus brasiliensis, Syphacia muris, Pterygodermatites tani/whartoni, Gongylonema neoplasticum, Angiostrongylus malaysiensis), three cestodes (Hymenolepis(Rodentolepis)nana, H. diminutaandTaenia taeniaeformis) and one acanthocephalan (Moniliformis moniliformis) were recovered from 346Rattus rattusand 104R. norvegicus from two urban sites, Bangsar and Chow Kit, during 2000-2002.Rattus rattusharboured over 60% of all helminths compared withR. norvegicus, although both host species played a dominant role in the different sites with, for exampleR. norvegicusat Bangsar andR. rattusat Chow Kit accounting for most of the nematodes. Overall 80% of rats carried at least one species of helminth, with the highest prevalences being shown byH. diminuta(35%), H. spumosum(29.8%) andH. nana(28.4%). Nevertheless, there were marked differences in prevalence rates between sites and hosts. The influence of extrinsic (year, season and site) and intrinsic (species, sex and age) factors affecting infracommunity structure (abundance and prevalence of infection) and measures of component community structure were analyzed.
Conclusions:Since at least two species of rat borne helminths in Kuala Lumpur have the potential to infect humans, and these showed high prevalences in the rats, the assessment and regular monitoring of infections carried by wild rodents have important roles to play in public health.
Keywords:Rattus norvegicus, Rattus rattus, helminths, nematodes, helminth species diversity,Hymenolepis diminuta, Hymenolepis nana,Mastophorus muris, Nippostrongylus brasiliensis, Heterakis spumosum
Background
The prevalence of parasitic infections among commensal animals in many tropical countries is high and poses threats to human health since people living in close proximity to rodent populations that act as reservoirs of infection, or to secondary hosts, can be exposed to infection. An extreme example of this is given by bubo-nic plague, the causative bacteriumYersinia pestisbeing
transmitted by rat fleas, but there are many other exam-ples of human diseases that have their origins in com-mensal rodent populations (e.g. Weil’s disease, etc.) including helminths (e.g. trichinosis) [1-5]. Assessment and regular monitoring of infections carried by wild rodents therefore, have important roles to play in public health.
European and N. American wild rodents have been intensively investigated over the last decades with respect to their parasitic infections [6-12], but in com-parison the parasite populations of wild rodents from the Far East have been poorly documented, and very
* Correspondence: jerzy.behnke@nottingham.ac.uk
2
School of Biology, University of Nottingham, University Park, Nottingham NG7 2RD, UK
Full list of author information is available at the end of the article
little is known about their ecology and epidemiology. Several projects in Europe and the USA have focused on the factors that affect parasite communities including biogeography and abiotic parameters as well as host density and life history [9-14]. However, most studies of rodent parasites from the Far East are little more than species lists, and records of overall prevalence of species [15-27] with differing habitats and relatively small sam-ple sizes [28]. To date there have been no comprehen-sive studies relating factors responsible for variation in parasite burdens of rodent communities in Malaysia nor any studying helminth communities over an extended period of time in this region.
The two dominant commensal rat species, the brown rat (Rattus norvegicus) and the black rat (R. rattus), are distributed worldwide [29]. Both rodents inhabit urban cities, being commonly found around dumpsites, around cross-pits, in sewer systems and storm drains [30] and both have been well-studied because of their medical and economic importance [2].
Therefore, the objectives of the present work were to investigate the diversity of helminth parasites in two spe-cies of commensal rats (R. rattusandR. norvegicus) from two urban sites in Kuala Lumpur. Additionally, the abun-dance of helminth species was monitored over a three year period, measures of component and infracommunity structure were calculated and interactions of helminth parasites with both intrinsic and extrinsic factors that are known to affect parasite abundance in other rodent spe-cies, were assessed. Of particular interest, was the relative role of these two rat species as hosts and reservoirs of the rodent helminth parasites endemic in the city, and parti-cuarly those species that are transmissible to the human inhabitants of the city.
Methods Study sites
Kuala Lumpur, the capital city of Malaysia is character-ized by a tropical climate of high temperature and high humidity all year round with temperatures ranging between 30-36°C and with rainfall fairly even throughout most of the year but typically heavier during the mon-soon season between October to February.
For the present work, the study sites were chosen based on the marked differences in the habitat and resources that they provide for rodents. Chow Kit (03°09’53.75”N, 101°41’56.84”E) is the largest wet market in Kuala Lum-pur, a wet market being a fresh food market of a type commonly found in Asian countries. The name is derived from the extensive use of water in the markets in order to wash the floors, keep the fruits and vegetables fresh, and keep fish and shellfish alive. Traders sell an extensive range of raw food including fruits, vegetables, seafood and meat. Here, tons of rubbish are collected daily and
deposited into several steel containers. Excess garbage falls to the ground forming temporary grounds for rats to forage in. In contrast, Bangsar (03°7’50.78”N, 101°40’ 19.05”E) is an affluent residential suburb on the outskirts of Kuala Lumpur with mixed residential sites. The haw-ker centres, restaurants and roadside stalls sell cooked food and rodents found here thrive on leftovers.
Collection and examination of rats
Rodents were trapped regularly by the vector control unit of the Kuala Lumpur Municipality (DBKL) as part of their rodent control measure. Rats were caught from both vicinities over a span of 4 days and 3 nights for 21 months in 2000-2002. Steel wire traps were used and were baited with tapioca and dried fish. Rats were removed alive from these traps and killed with chloro-form prior to post mortem examination. They were examined immediately afterwards and morphometric measurements were taken, together with records of fur colour, to assist in distinguishing between the two spe-cies. The lengths of head and body, tail, hind foot and ear were recorded and with body weight, these parameters enabled the establishment of age classes.
A complete post-mortem was undertaken on freshly killed specimens, the alimentary tract together with its offshoots being carefully scrutinized for helminth para-sites. When found, these were removed carefully, identi-fied, counted and preserved in 70% ethanol.
Age classes of rats
Rats were allocated to three age classes on the basis of body weight, but since the two species differ markedly in adult weight, the ranges were different for each species. ForR. norvegicusrats < 140 gm in weight were allocated to age class one, those 140 to < 240 gm into age class two, and age class three comprised rats > 240 gm. For R. rattusage class one comprised rats < 90 gm, age class two 90 to < 150, and age class three > 150 gm. The choice of the borderline between age class one and age class two for each species was based on MacDonald & Barrett [29]. The remaining rats were divided into two approximately equal groups numerically, with the lighter half being considered as young but sexually mature adults, and the heavier half as older animals.
Seasonal cycles
continuity of the wet season across the year divide. For this reason we fitted seasonal cycles rather than year as the more relevant factor, beginning with the dry season of seasonal cycle 1 and continued for 3 cycles, ending in the wet season of cycle 3.
Data analysis
Prevalence data (percentage of animals infected) are shown with 95% confidence limits (95% CL, lower limit -upper limit), calculated as described previously [31], using bespoke software and were analyzed by maximum likelihood techniques based on log linear analysis of con-tingency tables in the software package SPSS 16. These analyses were confined to helminths that showed an overall prevalence greater than 10%. Initially, full factorial models incorporated host species (2 levels,R. norvegicus andR. rattus), seasonal cycle (3 levels, cycle 1, 2 and 3), site (2 levels, Chow Kit and Bangsar), season (2 levels, wet and dry season), sex (2 levels, males and females), age (3 age classes) and infection as a binary factor (pre-sent/absent). The backward selection procedure was implemented to derive minimum sufficient models for which the likelihood ratio ofc2was not significant. The importance of each term (i.e. interactions involving infec-tion) in the final model was assessed by the probability that its exclusion would alter the model significantly.
Because the analysis was based on seven factors (host, site, seasonal cycle, season, age, sex and presence/absence of infection), full factorial models were complex and therefore when relevant, a two stage analysis was adopted. First we explored the full factorial model seek-ing evidence that there was a difference between hosts, and if there was, we explored this further. Secondly we fitted models for each rat species in turn and examined all relevant interactions in these.
Helminth species richness was analyzed by GLM (with normal errors) in SPSS in a two step procedure, first fit-ting models that incorporated all factors, main effects and only 2-way interactions, for each host species in turn. These were simplified by the backward selection procedure, with stepwise removal of non significant terms, eventually deriving a minimum sufficient model that retained only the significant interactions, main effects associated with those interactions whether signifi-cant or not, and any additional signifisignifi-cant main effects. Then, we added host species as an additional factor (2 levels,R. norvegicusandR. rattus) with all relevant 2-way and 3-way interactions. These models were then simpli-fied by the backward selection procedure until a mini-mum sufficient model was obtained, as above.
The degree of aggregation in the data was calculated by the index of discrepancy(D[32]) and the index of disper-sion (I, variance to mean ratio). Frequency distributions of individual taxa were also tested for goodness of fit to
negative binomial, positive binomial and Poisson models by Chi2[33].
For analysis of parasite abundance data, we first fitted generalized linear models with negative binomial errors in R version 2.2.1 (R Core Development Team), using the glm.nb routine in the MASS library of R [34]. All para-metric models were checked for approximately normal or negative binomial distribution of residuals, and if the for-mer did not conform to normal distribution, we trans-formed the raw data accordingly.
When neither of the above generated satisfactory models, we resorted to non-parametric tests, first examining each of the main effects in turn, either with the Mann-Whitney U test (2 levels) or the Kruskal-Wallis test (3 levels) on the combined data-set from both species of rats, and then on each of the rat species in turn.
Results Hosts
A total of 486 rats were autopsied including, 140R. norve-gicusand 346 R. rattus. Four other species were also encountered and these wereR. argentiventus, R. annanda-lei, R. exulansandR. tiomanicus. None of these species exceeded 7% of the catch at either site and we do not report further on these species ofRattusin the current work. Table 1 shows the numbers by host species, site and age class. ForR. norvegicusthe sex ratio was close to 1, with 52.9% males and 47.1% females. ForR. rattus, more females were sampled (57.7% females and 42.3% males). One rat was not sexed and was excluded from all analyses in which sex was a consideration. More of each species were caught in the dry season (R. norvegicus60.7% and 39.3%,R. rattus55.45 and 44.6% in dry and wet seasons, respectively), which was longer than the wet season (7 months compared with 5). Fewer of each species were caught in 2000 and most in 2001 (R. norvegicus12.9%, 50.7% and 36.4%,R. rattus 5.8%, 57.4% and 36.8.0% in 2000, 2001 and 2002, respectively). However, the analyses were conducted in relation to seasonal cycles that enabled actual seasons to be fitted chronologically, ranging from March of each year to the following February. In this arrangement forR. norvegicusthe percentages of rats in seasonal cycles 1, 2 and 3 were 17.9, 53.6 and 28.6% and forR. rattus, 13.9, 60.3 and 25.8%, respectively. With six factors fitted (host species, season, cycle, site, sex and age), log-linear analysis revealed a complex model in which all factors played a significant role in 8 sets of interactions (five 3-way and three 2-way interactions, full model likeli-hood ratioc2100= 72.53,P= 0.982).
Host age
from age class 1 through to age class 3, we first con-ducted a Principal Components Analysis, fitting host weight, head and body length, tail length, hind foot length and ear length as separate components. For R. norvegicus Principal Component 1 (PC1) accounted for 61.5% of the variance and showed the expected positive correlation with each parameter in turn, ranging from R= 0.92 for head + body length, to R= 0.442 for ear length. For R. rattusPC1 accounted for 52.0% of the variance and showed positive correlations with each parameter ranging fromR= 0.90 for body weight toR= 0.39 for ear length and increased markedly across the three age classes. In R. norvegicus, but not R. rattus, there was also a significant difference between the sexes (F1, 134= 4.54,P = 0.035; for males mean PC1 = 0.293 ± 0.114, and for females -0.329 ± 0.114). With the excep-tion of ear length, each parameter had the lowest mean in age class 1 and increased through to age class 3. Ear length increased from age class 1 to age class 2 but no further (F2,475= 21.8,P< 0.001). In all cases there was a significant difference between the host species, confirm-ing that morphometric parameters were always higher inR. norvegicuscompared withR. rattus (Figure 1). The rate of increase in body weight was higher across the three age classes inR. norvegicuscompared withR. rat-tus (Figure 1A). For head plus body length there was a 2-way interaction between host species and sex arising from the body length being very similar in male and female R. rattus, but increasing more quickly in male compared with femaleR. norvegicusacross the three age classes (Figure 1B). Hind foot length varied between the sexes (F1,472= 33.6,P= 0.001), means being consistently higher among males of both species, but the discrepancy between the sexes was higher amongR. norvegicus com-pared withR. rattus(2-way interaction between host spe-cies and sex, F2,472= 39.6,P< 0.001). Tail length also varied between the sexes across both species (F1,471= 11.3,P= 0.001) but contrary to the other measures tail length was generally longer in females (data not shown).
Regional helminth community structure
The combined total of all helminths recovered in the sur-vey was 13,800 with slightly more cestodes (51.0%) than nematodes (48.0%), and acanthocephala being poorly represented (1.0%). When the percentage distribution of helminths was calculated,R. rattusharboured almost two thirds of all helminths compared withR. norvegicus, and this was similar across all the higher taxa, except for larval cestodes which were only found inR. rattus(Table 2).
Eleven species of helminths were identified, comprising 3 species of cestodes, two of which were adult intestinal forms and one larval, seven species of nematodes and 1 acanthocephalan (Table 3).
Measures of component community structure
The percentage distribution of helminths between the two sites was approximately equal when host sample size was taken into consideration, although in terms of actual worms recovered, more than three times as many came from the higher sample of rats from Chow Kit (Table 2). Over four times as many helminths were recovered from R. rattuscompared withR. norvegicusin the raw data-set, but when we controlled for sample size the difference was almost two-fold (Table 2). Interestingly R. norvegicus trapped at Bangsar, andR. rattusat Chow Kit accounted for most of the nematodes, so the two host species each played a dominant role in one of the two sites in this con-text. About twice as many adult cestodes came fromR. rattuscompared withR. norvegicus, and this was consis-tent in both sites. However, all larval cestodes (Table 2) came fromR. rattus in Chow Kit, and the majority of acanthocepahalans fromR. rattusin Bangsar.
[image:4.595.56.543.101.236.2]Of the eleven species of helminths identified (Table 3), the majority were shared by both rat species in both sites. All the species were recovered fromR. rattusin Chow Kit, although four species (S. muris,G. neoplasticum,T. tae-niaeformisandA. malaysiensis) were absent from Bangsar. The first three of these were not found inR. norvegicusat either site.
Table 1 Numbers of rats examined by species, site and age class
Age class
Species Site Class 1 Class 2 Class 3 Total Total
R. norvegicus Chow Kit 15 33 12 60 140
Bangsar 22 18 40 80
R. rattus Chow Kit 38 119 128 285 345
Bangsar 11 23 26 60
Total by species R. norvegicus 37 51 52 140 485
R. rattus 49 142 154 345
Total by site Chow Kit 53 152 140 345 485
Bangsar 33 41 66 140
Total 86 193 206 485
Overall, 80.0% of rats harboured at least one helminth species (Table 3) with high prevalence values being shown by H. diminuta (36.1%), H. spumosum (29.9%) and H. nana(28.2%). Nevertheless, there were marked differ-ences in prevalence between sites and hosts.
Simpson’s index of diversity was highest inR. rattusfrom Chow Kit, and lowest inR. rattusfrom Bangsar (Table 4). The overall value for Simpson’s index of diversity was 0.740, which is almost identical to that forR. rattusat
Chow Kit. Combining the data for both sites, the value of Simpson’s was very similar for both species (R. rattus= 0.727 andR. norvegicus= 0.729), and combining rat species it was not markedly different between sites (Chow Kit = 0.744 and Bangsar = 0.697).
The Berger-Parker dominance index was highest in R. rattusfrom Bangsar, where the dominant species was H. nana(Table 4). The remaining three combinations had very similar but lower Berger-Parker dominance indices,
0
50
100
150
200
250
300
350
400
450
500
Age class 1
Age class 2
Age class 3
Me
an
w
eig
ht
±
S.
E
.M
.
R. norvegicus, males R. norvegicus, females R. rattus, males R. rattus, females
12
14
16
18
20
22
24
26
Age class 1
Age class 2
Age class 3
M
ea
n he
ad
+
bo
dy
le
ng
th
(c
m
)
±
S.
E
.M
.
[image:5.595.59.538.88.514.2]B.
A.
Figure 1Analysis of morphometric measures in relation to the age classes. Rats were allocated to 3 age classes as described in the text. Body weight (A) where analysis was initially by 3-way GLM, but sex and its interactions were not significant and therefore was removed from the model. In a 2-way GLM with host species and age as factors, for main effect of host speciesF1,479= 565.8,P< 0.001; for main effect of age F2,479= 908.9,P< 0.001 and for the interactionF2,479= 90.0,P< 0.001 and the model adjustedR2= 0.83; head and body length (B) where
analysis is by 3-way GLM, with host species, sex and age as factors, and this gave for the main effects of host speciesF1,477= 370.4,P< 0.001,
ageF2,477= 337.5,P< 0.001, host sexF1,477= 19.2,P< 0.001 and for the interaction between host species and sexF1,479= 7.8,P= 0.005. No
and in two of theseH. nanawas also the dominant species. However, inR. norvegicusfrom BangsarN. brasiliensiswas the dominant species.
Measures of infracommunity structure
Mean species richness
The overall mean number of helminth species har-boured per host (all rats combined, n = 485) was 1.4 ± 0.05 (variance to mean ratio = 0.77). Analysis of hel-minth species richness restricted to R. norvegicus revealed only one significant 2-way interaction, seasonal cycle*season (F2, 134 = 6.1, P = 0.003). Mean species richness was higher in 2 wet seasons (cycles 2 and 3), but lower in the wet season of cycle 1 compared with the preceding dry season (Figure 2A).
ForR. rattusa similar 2-way interaction was highly sig-nificant (seasonal cycle*season,F2, 336= 7.57,P= 0.001) and the pattern of change was much the same in seasonal
cycles 1 and 2, but not in cycle 3, when mean helminth species richness was higher in the dry season compared to the wet season much as in cycle 1 (Figure 2A). There were also two marginally significant main effects inR. rattus; mean helminth species richness was lower at Bangsar compared with Chow Kit (Table 5, F1, 336 = 4.03, P= 0.046), and increased with age, but then leveled off in age class 3 (F1, 336= 3.23,P= 0.041, values in age classes 1-3, = 1.18 ± 0.145, 1.69 ± 0.092, 1.53 ± 0.087, respectively). Neither the effect of site nor host age proved significant in the case ofR. norvegicus. With respect to site, the trend was in the opposite direction to that inR. rattusalthough less marked (Table 5), and similarly in relation to age, the increase with age was delayed relative toR. rattus(mean helminth species richness in age classes 1-3, = 1.03 ± 0.142, 1.06 ± 0.123, 1.23 ± 0.118, respectively).
[image:6.595.55.545.101.214.2]To determine whether helminth species richness var-ied significantly between hosts, the significant effects
Table 2 Percentage distribution of higher taxa by host species and site
Host
R. norvegicus R. rattus Hosts combined Sites combined
Chow Kit Bangsar Chow Kit Bangsar Chow Kit Bangsar R. norvegicus R. rattus
All helminths as a % of grand total* 4.3 13.7 72.6 9.4 76.9 23.1 18.0 82.0
All helminths adjusted for sampling effort** 10.9 26.3 38.9 24.0 49.8 50.3 37.2 62.9
Nematodes** 7.1 38.3 47.2 7.4 54.3 45.7 45.4 54.6
Adult cestodes** 13.5 17.7 33.5 35.2 47.0 52.9 31.2 68.7
Larval cestodes** 0 0 100 0 100 0 0 100
Acanthocephala** 17.4 12.3 10.8 59.5 28.2 71.8 29.7 70.3
* Values based on total number of helminths recovered from each site without adjustment for sample size ** Percentage distribution calculated with sample size taken into consideration
Table 3 Prevalence (% of hosts infected) of helminth taxa by host species and site
Species
R. norvegicus R. rattus
Taxon Species Chow Kit Bangsar Chow Kit Bangsar Combined
Nematodes Mastophorus muris 21.7 3.8 22.8 8.3 17.7
Syphacia muris 0 0 12.3 0 7.2
Nippostrongylus brasiliensis 1.7 17.5 20.0 13.3 16.5
Gongylonema neoplasticum 0 0 0.7 0 0.4
Pterygodermatites whartoni/tani 1.7 3.8 4.6 5.0 4.1
Heterakis spumosum 18.3 18.8 37.9 18.3 29.9
Angiostrongylus malaysiensis 1.7 1.3 1.4 0 1.2
All nematodes 38.3 36.3 67.4 40.0 55.3
Cestodes Hymenolepis diminuta 28.3 57.5 32.3 33.3 36.1
Hymenolepis nana 21.7 21.3 29.8 36.7 28.2
Taenia taeniaeformis 0 0 1.4 0 0.8
All adult cestodes 48.3 71.3 58.2 68.3 60.8
All larval cestodes 0 0 1.4 0 0.8
All cestodes 48.3 71.3 58.9 68.3 60.8
Acanthocephala Moniliformis moniliformis 8.3 10.0 8.1 8.3 8.5
[image:6.595.58.538.495.731.2]from each model were then re-analyzed in a restricted model, incorporating host species as an additional fac-tor, and fitting all interaction terms. The 2-way cycle*-season interaction emerged the strongest (F2, 473= 12.57, P < 0.001, Figure 2A) but the seasonal effect differed
[image:7.595.57.542.100.191.2]significantly between hosts (2-way interaction host*sea-son, F1, 473= 5.98, P = 0.015), because when the cycles were combined there was still a marked seasonal differ-ence in the mean helminth species richess inR. norvegi-cus, but not in R. rattus(Figure 2B). In particular, mean
Table 4 Measures of component community structure by host species and site
Species
R. norvegicus R. rattus
Chow Kit Bangsar Chow Kit Bangsar
Total no. of helminth species identified 8 8 11 7
Berger-Parker dominance index 0.499 0.523 0.401 0.700
Dominant species H. nana N. brasiliensis H. nana H. nana
Simpson’s index of diversity 0.676 0.652 0.741 0.487
0.6
0.8
1
1.2
1.4
1.6
1.8
Wet
Dry
M
ean
no.
of
speci
es
±
S
.E
.M.
Season
B
0
0.5
1
1.5
2
2.5
Cycle 1,
dry
season
Cycle 1,
wet
season
Cycle 2,
dry
season
Cycle 2,
wet
season
Cycle 3,
dry
season
Cycle 3,
wet
season
R. norvegicus
R.rattus
A
Mean
n
o.
of
sp
ec
ie
s
±
S.E
.M
.
[image:7.595.60.539.282.710.2]species richness was high in R. rattus compared with R. norvegicus during the dry seasons of cycles 2 and 3 (Figure 2A).
There was also a significant difference between the rat species (main effect of host, F1, 473= 6.44,P = 0.011, R. norvegicus= 1.11 ± 0.073,R. rattus= 1.55 ± 0.059) and a weaker overall effect of age with hosts combined (main effect of age,F2, 473= 3.58,P= 0.029, mean hel-minth species richness in age classes 1-3, = 1.12 ± 0.103, 1.52 ± 0.078, 1.46 ± 0.072, respectively). Not surprisingly, there was a significant difference between the rat species in their mean helminth species richness values from the two sites (2-way interaction host*site,F1, 473= 4.62,P= 0.032, Table 5). InR. norvegicus the values were very similar in both sites but they were significantly higher in R. rattusat Chow Kit.
Measure of infracommunity diversity
The maximum number of helminth species ranged from 5 inR. rattusat Chow Kit to 3 inR. rattusat Bangsar and inR. norvegicusat both sites (Table 5).
The analysis of Brillouin’s index of diversity was compli-cated because parametric models did not converge. There-fore we used non-parametric tests to evaluate the effects of each of the factors in turn. All significant differences were clearly driven by values derived fromR. rattus, since analyses that were confined toR. norvegicusdid not reveal significant differences between levels within the specified factors. There was a highly significant difference between the host species (Mann-WhitneyUtest,z= -3.46,P= 0.001) with the mean value of Brillouin’s being higher in R. rattus(0.23 ± 0.015) compared withR. norvegicus(0.15 ± 0.021). The mean value was highest inR. rattusfrom Chow Kit, because at Bangsar, the mean Brillouin’s for R. rattuswas much the same as forR. norvegicusat both sites (Table 5). The mean Brillouin’s index increased sig-nificantly inR. rattuswith each successive cycle (Kruskal-Wallis testc22= 25.1,P< 0.001) but remained fairly stable inR. norvegicus(c22= 1.2,P= NS; Figure 3a). Moreover, it was higher in age class 2 and 3 animals (Kruskal-Wallis testc22= 6.4,P= 0.041; Figure 3b), compared with age class 1 inR. rattus, but showed no significant difference
(c22= 1.7,P= NS) between age classes inR. norvegicus. However, the pattern inR. rattuswas predominantly that observed at Chow Kit (Figure 3c). At Bangsar, the Bril-louin’s index of diversity inR. rattuswas still low in age class 2 rats, but increased in age class 3 rats to about the same value as in rats (R. rattus) from Chow Kit.
Prevalence of infection with individual helminth species
Hymenolepis diminuta This species was the most fre-quently occurring helminth with an overall prevalence of 36.1% [CL: 32.7-41.4]. Prevalence was similar inR. rattus in both sites and inR. norvegicusat Chow Kit, but almost twice as high at Bangsar inR. norvegicus (Table 3; for host*site*presence/absence ofH. diminutainteraction, c2
1= 6.5,P= 0.01). This higher prevalence inR. norvegi-cusat Bangsar compared with Chow Kit was evident in all three seasonal cycles (Figure 4A).
In the second phase of analysis we fitted models for each host species in turn. In both cases there was a significant seasonal cycle * season * presence/absence ofH. diminuta interaction (ForR. norvegicusc22= 7.5,P= 0.024,R. rattus c2
2= 7.43,P= 0.024). Prevalence was high in both rat spe-cies in the dry season of seasonal cycle 1, and then declined in the wet season, but thereafter prevalence values increased consistently with each successive season in R. norvegicus, whilst fluctuating at a lower level in R. rattus(data not illustrated).
In R. norvegicus, the age related prevalence of H. diminuta varied between both sites and seasons (analysis restricted to R. norvegicus, season*site*age*-presence/absenceH. diminuta,c22 = 6.3,P = 0.042). In the dry season at both sites there was a pattern of increasing prevalence with age, but in the wet season at Chow Kit prevalence declined with age and at Bang-sar prevalence peaked in mature and not the oldest rats (Figure 4B).
[image:8.595.58.540.101.227.2]ForR. rattusthe second significant term incorporating the presence/absence of H. diminutawas the seasonal cycle*site*presence/absence interaction (c22 = 8.4, P= 0.015). This arose because at Chow Kit prevalence was consistent across the 3 seasonal cycles, but fell from 48% to zero at Bangsar (Figure 4C).
Table 5 Measures of infracommunity structure by host species and site
Species
R. norvegicus R. rattus
Chow Kit Bangsar Chow Kit Bangsar
Mean number of species ± S.E.M. 0.950 ± 0.110 1.238 ± 0.096 1.633 ± 0.067 1.150 ± 0.100
Maximum number of species 3 3 5 3
Mean number of helminths ± S.E.M. 9.8 ± 2.29 23.7 ± 5.60 35.0 ± 4.3 21.6 ± 5.37
Mean number of nematodes ± S.E.M. 2.7 ± 0.96 14.6 ± 4.83 17.9 ± 3.45 2.8 ± 0.75
Mean number of cestodes ± S.E.M. 6.8 ± 2.14 9.0 ± 2.22 16.9 ± 2.43 17.8 ± 4.94
Mean Brillouin’s index ± S.E.M. 0.127 ± 0.031 0.166 ± 0.029 0.247 ± 0.016 0.147 ± 0.031
The final interaction involvingH. diminuta inR. rat-tuswas site*age*presence/absence (c22 = 7.0,P = 0.030). At Chow Kit all three age classes of R. rattus showed similar prevalences whereas at Bangsar prevalence
increased markedly from juveniles to the oldest indivi-duals (Figure 4D).
Heterakis spumosum This was the second most fre-quently occurring helminth with a prevalence of 29.9% 0
0.05 0.1 0.15 0.2 0.25 0.3 0.35 0.4
1 2 3
Me
an
B
rillo
uin
's
±
S.
E
.M
.
Seasonal cycle
R. norvegicus R. rattus
A
0 0.05 0.1 0.15 0.2 0.25 0.3 0.35 0.4
1 2 3
Me
an
B
rillo
uin
's
±
S.
E
.M
.
Age Class
R. norvegicus R. rattus
B
0 0.05 0.1 0.15 0.2 0.25 0.3 0.35
1 2 3
Me
an
B
rillo
uin
's
±
S.
E
.M
.
Age Class
Chow Kit Bangsar
[image:9.595.61.538.86.635.2]C
[CL:26.0-34.2]. With the exception of R. rattusat Chow Kit, prevalence was remarkably uniform inR. norvegicus in both sites and in R. rattus at Bangsar but twice as high at Chow Kit in R. rattus(Table 3). Nevertheless, with both hosts combined there was a highly significant difference in the prevalence of H. spumosumbetween sites (analysis incorporating both rat species, site*pre-sence/absence ofH. spumosum,c21 = 8.1,P = 0.005; at Chow Kit prevalence was 34.4% (CL: 29.19-39.99%) and at Bangsar 18.6% (CL:12.95-25.79%)).
Although the overall prevalence was higher inR. rattus (34.5%) compared withR. norvegicus(18.6%), this differ-ence was confounded by some interactions with age and season. In the dry season the prevalence was higher in all age classes inR. rattus, whereas prevalence inR. norvegi-cuswas higher in age class 3 in the wet season (season*a-ge*host*presence/absence ofH. spumosum,c22= 10.0,P = 0.007). When the effect of season was collapsed, the difference between age classes was far more pronounced
inR. norvegicus(prevalence for age class 1 to 3 = 8.1%, 11.8% and 32.7%, respectively) compared withR. rattus (30.6%, 31.7% and 38.3%, respectively). Prevalence in both hosts declined in the wet season in seasonal cycle 1, and this drop was still evident in the dry season of seaso-nal cycle 2. Prevalence values then recovered in both hosts but dropped again inR. rattusduring the wet sea-son at the end of seasea-sonal cycle 3 (seasea-son*cycle*host spe-cies*presence/absence ofH. spumosum, c22 = 9.1,P= 0.011, Data not illustrated).
Hymenolepis nanaThis was the third most frequently occurring species with an overall prevalence of 28.2% [CL:25.1-33.2]), and prevalence was higher inR. rattus (31.0%, [CL:27.3-37.1]) compared withR. norvegicus (21.4%, [CL:15.9-29.6]). This difference between hosts was consistent in both sites (Table 3), but was not found to be significant because prevalence was confounded by combinations of the other factors in the analysis. A model that included host species as a factor comprised Fig. 4
0 10 20 30 40 50 60 70 80 90 100
Chow Kit,
dry season wet seasonChow Kit, dry seasonBangsar, wet seasonBangsar,
B
Age Class 1 Age Class 2 Age Class 30 10 20 30 40 50 60 70 80
1 2 3
P
rev
al
en
ce
(%
)
±
95
%
C
L
Seasonal cycle
C
Chow Kit Bangsar0 10 20 30 40 50 60 70 80
Chow Kit Bangsar
D
Age Class 1 Age Class 2 Age Class 30 10 20 30 40 50 60 70 80 90 100
1 2 3
P
rev
al
ence
(%
)
±
95
%
C
L
Seasonal cycle
Chow Kit Bangsar
A
Site
Figure 4Factors affecting prevalence ofHymenolepis diminuta. Variation between the two sites and across 3 seasonal cycles inR. norvegicus
[image:10.595.58.538.88.430.2]13 terms of which six 4-way interactions included pre-sence/absence ofH. nanatogether with various combina-tions of site, age, season and cycle. Sex did not play a role in determining the prevalence ofH. nana(host species combined, males = 30.5% [CL:25.3-37.3]; females 26.4% [CL:22.0-32.6]).
InR. norvegicusprevalence varied across the three age classes and across the three seasonal cycles (age*season*-cycle*presence/absence ofH. nana,c24= 9.5,P= 0.05). In the dry season prevalence was low in all three cycles in age class 3 rats and in the wet season it was higher in each case. InR. rattus, the only interaction involving the presence/absence ofH. nanawas one incorporating site and season in relation to age (site*season*age*presence/ absence ofH. nana,c22= 15.6,P= 0.0004). There was little difference in prevalence between age classes 1 and 2, but in three data subsets the prevalence was lower in the age class 3 rats (Chow Kit dry and wet season and Bangsar in the wet season), the exception being Bangsar in the dry season.
Mastophorus muris This nematode was present in
17.7% [CL:13.0-23.6] of rats, and almost twice as fre-quently encountered inR. rattus(20.3% [CL:16.0-25.2]) compared withR. norvegicus(11.4% [CL:7.0-17.7]).
The overall prevalence was up to 5 times higher at Chow Kit compared to Bangsar, and the higher preva-lence at Chow Kit was common to both rat species (Table 3). Prevalence was also higher in females (21.5% [CL:17.6-25.9]) compared with males (13.2% [CL:10.3-16.7]) but not significant because of the confounding influences of more complex interactions with site, sea-son and host. When the analysis was confined toR. nor-vegicus, only one of the 4 interactions included the presence/absence of M. muris (site*sex*age*presence/ absence ofM. muris, c22= 7.5, P = 0.024) but no clear patterns were evident.
Analysis ofR. rattus, however, revealed a very distinct picture with six interaction terms, four of which were 2 way interactions. There was a marked age effect (age*pre-sence/absence ofM. muris,c22= 13.7,P= 0.0013) with an increasing prevalence of infection with age (Figure 5A). Prevalence varied significantly between sites (site*pre-sence/absence ofM. muris, c21 = 5.4,P = 0.02), being higher at Chow Kit as shown in Table 3, and between sea-sonal cycles, being highest in season cycle 2 (24.5%, [CL:20.9-28.6]), compared with cycle 1 (8.3% [CL:1.3-24.1]) and cycle 3 (16.9% [CL:8.8-28.8];c22= 7.8, P= 0.02). Finally, prevalence was also significantly higher in the wet compared with dry season (c21 = 4.0,P= 0.044; wet season = 23.4% [CL:16.7-31.4]; dry season = 17.8% [CL:11.3-26.4]). The increase from dry to wet season is apparent in each seasonal cycle, despite the differences in prevalence between cycles (Figure 5B).
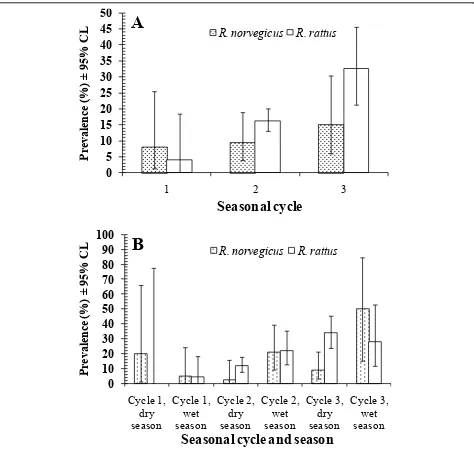
Nippostrongylus brasiliensisNippostrongylus brasilien-sis had an overall prevalence of 16.5% (95% [CL: 11.8-22.3]. Prevalence was higher inR. rattus compared toR. norvegicus, being 18.8% [CL:14.7-23.7] and 10.7% [CL:6.4-17.0] respectively, but with hosts combined pre-valence values were similar at both sites (Chow Kit = 16.8% [CL:12.9-21.5]; Bangsar = 15.7% [CL:10.5-22.5]). However, when broken down by host and site (Table 3), prevalence can be seen to have been particularly low in R. norvegicus at Chow Kit. Statistically the difference between hosts was confounded additionally by season (model incorporating both hosts, host*site*season* pre-sence/absence of N. brasiliensis c21 = 7.7, P = 0.0056 and model restricted toR. norvegicus, site*season*pre-sence/absence of N. brasiliensis, c21 = 4.7, P = 0.03). Prevalence was higher inR. rattus(relative toR. norvegi-cus) in Chow Kit and at Bangsar in the dry seasons, but not in the wet season at Bangsar, when prevalence amongR. norvegicus exceeded 40% (Data not shown).
Statistical analysis revealed that the strongest effect was that arising from differences in prevalence between the seasonal cycles. This was evident in both hosts (cycle*presence/absence of N. brasiliensis, c22 = 23.2, P < 0.0001), in onlyR. rattus (c22 = 18.1, P< 0.0001), but not whenR. norvegicus were analyzed alone. This seasonal cycle effect is shown for both species separately in Figure 6A. In both, prevalence increased with succes-sive seasonal cycles, but the increase was more marked inR. rattus,R. norvegicusfollowing a similar pattern but more slowly. When the season effect was added to that of seasonal cycles, an increasing prevalence in R. rattus was shown starting from the dry season of cycle 1 through to the dry season of cycle 3, and a similar but delayed pattern of change inR. norvegicuswith a low in the dry season of cycle 2 (Figure 6B).
Measures of dispersion
The majority of helminths in the two rat species from both sites showed overdispersed (aggregated) distributions whereDexceeded 0.7 and was generally much higher, and Iexceeded 1 in all cases ranging from 3 to 146.8. The negative binomial constantsk, were in general consistent with a negative binomial distribution. In 18 of the 30 sub-sets of data the distributions were not significantly differ-ent from those predicted by the negative binomial distribution and in 5 cases it was not possible to test for goodness of fit.
Abundance of infection with helminth species
combined, Chow Kit = 30.6 ± 3.61; Bangsar = 22.9 ± 2.85). Nevertheless, there was also a significant difference between sites inR. norvegicus when the analysis was restricted to this species (Table 5;c21= 9.13,P= 0.0025). The strongest influences on total helminth burden were season (c21= 24.8,P< 0.0001) and seasonal cycle (c22= 13.9,P= 0.0009), and the marked increase in hel-minth burdens from the dry to the following wet season was evident in both species (Figure 7A; forR. norvegicus c2
1= 20.4,P< 0.0001; forR. rattusc21= 8.2,P= 0.0043), except forR. rattusin cycle 3. There was also a steady increase in total helminth burdens with each successive seasonal cycle (hosts and sites combined, values for
seasonal cycles 1, 2 & 3, were: 24.7 ± 5.74, 25.5 ± 3.38 and 36.7 ± 6.75, respectively).
There was a pronounced effect of host sex (c21= 15.4, P= 0.0001), with male rats harbouring on average more worms than females (males = 34.9 ± 5.13; females = 22.9 ± 2.85). This effect of host sex was in the same direction in both rat hosts (R. norvegicusmales = 23.0 ± 5.99, females = 11.9 ± 2.44;R. rattusmales = 41.0 ± 7.07, females 26.6 ± 3.68) but, with other factors taken into account, was only significant inR. rattus(c21= 9.15,P= 0.0025)
A highly significant 2-way interaction was found between host age and seasonal cycle on helminth abun-dance (c24 = 22.1, P = 0.0002). As mean helminth
0
5
10
15
20
25
30
35
40
1
2
3
P
reval
en
ce (
%
)
±
95%
C
L
Age class
A
0
10
20
30
40
50
60
70
80
90
100
Cycle 1,
dry
season
Cycle 1,
wet
season
Cycle 2,
dry
season
Cycle 2,
wet
season
Cycle 3,
dry
season
Cycle 3,
wet
season
P
re
val
en
ce
(%)
±
95%
C
L
Cycle and season
[image:12.595.58.540.88.520.2]B
Figure 5Factors affecting the prevalence ofMastophorus murisinR. rattus. Effect of host age (A) and seasonal cycles (B). The overall model fit of the minimum sufficient model confined toR. rattuswasc2121 =76.8,P= 0.99. See text for significance of individual factors and
burdens accumulated with increasing age in both hosts in seasonal cycles 2 and 3, but not in seasonal cycle 1 when worm burdens clearly fell with increasing age (Figure 7B).
Hymenolepis diminutaThere was no significant differ-ence in the overall abundance ofH. diminutabetween sites (hosts combined, Chow Kit = 2.7 ± 0.65; Bangsar = 3.6 ± 0.63) nor between hosts (sites combined,R. norvegi-cus= 3.2 ± 0.61;R. rattus= 2.9 ± 0.66), when other factors were taken into account. However, in R. norvegicus
abundance was significantly higher at Bangsar (Table 6; c2
1= 7.20,P= 0.0007).
InR. rattusabundance ofH. diminuta clearly declined significantly across the 3 seasonal cycles (c22= 11.26,P= 0.0036), whilst inR. norvegicusabundance was relatively stable (Figure 8A). There was no significant effect of age in either host, but there was a sex effect inR. rattus(c21= 7.4,P= 0.0064), with females harbouring more worms than males (R. rattus, males 1.6 ± 0.29, females = 3.8 ± 1.11). InR. norvegicusabundance ofH. diminutawas in
0
5
10
15
20
25
30
35
40
45
50
1
2
3
P
reval
en
ce (
%
)
±
95%
C
L
Seasonal cycle
R. norvegicus R. rattus
A
0
10
20
30
40
50
60
70
80
90
100
Cycle 1,
dry
season
Cycle 1,
wet
season
Cycle 2,
dry
season
Cycle 2,
wet
season
Cycle 3,
dry
season
Cycle 3,
wet
season
P
re
val
en
ce
(%)
±
95%
C
L
Seasonal cycle and season
R. norvegicus
R. rattus
[image:13.595.62.536.87.536.2]B
Figure 6Factors affecting variation in the prevalence ofNippostrongylus brasiliensis. The effect of 3 seasonal cycles (A) and seasonal cycles combined with both seasons in each cycle (B). The overall model fit of the minimum sufficient model incorporating both hosts wasc2
213
=113.9,P= 1.0, confined toR. norvegicusc2
100 =43.4,P= 1.0 and confined toR. rattusc2108 =81.7,P= 0.97. See text for significance of
the opposite direction but this was not significant when other factors were taken into consideration (males = 3.9 ± 1.02, females = 2.5 ± 0.61)
Heterakis spumosum There was no significant differ-ence in the overall abundance ofH. spumosumbetween sites (hosts combined, Chow Kit = 2.0 ± 0.29; Bangsar = 0.8 ± 0.18) nor between hosts (sites combined,R. norvegi-cus= 1.2 ± 0.40;R. rattus= 1.8 ± 0.25). However, abun-dance of this nematode varied significantly between sites inR. rattus(higher at Chow Kit;c21= 5.54,P= 0.019 but not inR. norvegicus(Table 6), although the difference between sites was in the same direction. There was no
significant difference in abundance of H. spumosum between seasonal cycles inR. norvegicus, but inR. rattus abundance clearly increased significantly with each suc-cessive seasonal cycle (Figure 8B;c22= 8.27,P= 0.016).
Hymenolepis nana This cestode was considerably more abundant in R. rattus (14.2 ± 2.13) compared with R. norvegicus(4.8 ± 1.51;c21 = 11.82,P = 0.0006) and this pattern was consistent across both sites (Table 6). It was also a species that clearly increased in abundance in the wet season (with hosts combined c21 = 8.69, P = 0.0032). This cycle of abundance was apparent in all three seasonal cycles inR. rattus (c21 = 4.83,P = 0.028)
0
10
20
30
40
50
60
70
80
90
Cycle 1,
dry
season
Cycle 1,
wet
season
Cycle 2,
dry
season
Cycle 2,
wet
season
Cycle 3,
dry
season
Cycle 3,
wet
season
M
ean
±
S
.E
.M.
Seasonal cycle & season
R. norvegicus R. rattus
A
0
10
20
30
40
50
60
70
80
90
100
R. norvegicus,
seasonal cycle 1
R. norvegicus,
seasonal cycle 2
R. norvegicus,
seasonal cycle 3
R. rattus, seasonal cycle 1
R. rattus, seasonal cycle 2
R. rattus, seasonal cycle 3
M
ean
±
S
.E
.M.
Host species and seasonal cycle
Age class 1
Age class 2
Age class 3
[image:14.595.59.537.87.539.2]B
with a similar pattern in cycles 1 and 2 inR. norvegicus but not in seasonal cycle 3 (Figure 8C).
The age effect was highly significant when both hosts were combined (c22= 10.22,P= 0.006), with declining abundance ofH. nanaas age increased. Models forR. nor-vegicusalone did not converge but analysis by non-para-metric tests confirmed a significant difference between groups (Kruskal-Wallis test,c22 = 7.8,P= 0.02; Figure 9A). Age did not appear in the minimum sufficient model forR. rattus, but as withR. norvegicusthere was a signifi-cant difference between groups when tested non-parame-trically (Figure 9A; Kruskal-Wallis test,c22 = 11.3,P= 0.003).
Mastophorus muris This species was significantly more abundant at Chow Kit (hosts combined, 1.1 ± 0.16) com-pared with Bangsar (0.2 ± 0.10;c21= 15.32,P= 0.0001), and this difference between sites was consistent in both hosts (Table 6). Analysis by GLM forR. rattusgavec21= 9.36,P= 0.002 and by non-parametric tests confirmed that there was also a significant difference between sites in R. norvegicus(Mann-Whitney U test,Z= -3.3, P = 0.001).
Overall, abundance ofM. muriswas higher inR. rattus (R. rattus= 1.0 ± 0.15,R. norvegicus= 0.5 ± 0.18), but this did not emerge as a significant effect in GLM, although without other factors being taken into account there was a significant difference by non-parametric analysis (Mann-WhitneyUtestZ= -2.36,P= 0.018).
There was an overall effect of host age (c22= 12.4,P= 0.002) and the trend of increasing abundance with increas-ing age was consistent in both hosts, although only signifi-cant inR. rattus(Figure 9B;c22= 14.4,P= 0.0008).
M. murisalso showed significantly higher abundance in females (1.1 ± 0.18) compared with males (0.6 ± 0.14)
when hosts were combined (c21 = 6.23, P = 0.013). Although sex did not emerge as a main effect in the GLM restricted to R. rattus, the non-parametric test indicated that as in the entire data-set a sex bias was apparent (R. rattus, males = 0.7 ± 0.18, females = 1.2 ± 0.22, Mann-Whitney U test Z= -2.2-4, P = 0.028). In R. norvegicus the mean was higher among females also, but not significantly so (females = 0.6 ± 0.31, males = 0.4 ± 0.20).
There was a significant difference in abundance between seasons (mean in wet season = 1.1 ± 0.21, and in the dry season 0.6 ± 0.13,c21= 6.23,P= 0.013) when hosts were combined and this was also significant inR. norvegicusin which abundance was five times higher in the wet season (mean for wet season = 1.0 ± 0.43, dry season 0.2 ± 0.09, c2
1= 5.37,P= 0.021) but not inR. rattus(mean for wet season = 1.2 ± 0.24, dry season 0.8 ± 0.19)
[image:15.595.57.546.101.324.2]Nippostrongylus brasiliensisThere was no difference in abundance of N. brasiliensis between the hosts (R. norvegicus= 7.1 ± 2.77;R. rattus= 7.4 ± 1.50), nor between the sites when hosts were pooled (Chow Kit = 7.1 ± 1.50; Bangsar = 7.7 ± 2.77). However, this species was clearly more abundant in R. norvegicusat Bangsar and in R. rattusat Chow Kit, and this interaction was borne out by the statistical analysis (Table 6; 2-way interaction site*host speciesc21= 18.81,P < 0.0001). No other factors or 2-way combinations were significant. However, changes in abundance of N. brasiliensis occurred across the seasonsal cycle and in successive seasons (Figure 9C). These data show a tendency to increasing abundance with successive cycles, particularly in R. norvegicus in the wet season, and an increase in abundance in R. rattusbetween seasonal cycles 1 and 3.
Table 6 Abundance of helminth tax by host species and site
Species
R. norvegicus R. rattus
Taxon Species Chow Kit Bangsar Chow Kit Bangsar Combined
Nematodes Mastophorus muris 1.0 ± 0.36 0.2 ± 0.15 1.2 ± 0.18 0.2 ± 0.12 0.9 ± 0.12
Syphacia muris 0 0 5.7 ± 2.83 0 3.4 ± 1.66
Nippostrongylus brasiliensis 0.05 ± 0.05 12.4 ± 4.77 8.6 ± 1.80 1.4 ± 0.64 7.3 ± 1.33
Gongylonema neoplasticum 0 0 0.007 ± 0.005 0 0.004 ± 0.005
Pterygodermatites whartoni/tani 0.05 ± 0.05 1.1 ± 0.82 0.4 ± 0.17 0.5 ± 0.35 0.5 ± 0.18
Heterakis spumosum 1.6 ± 0.88 0.9 ± 0.25 2.0 ± 0.30 0.7 ± 0.27 1.6 ± 0.21
Angiostrongylus malaysiensis 0.03 ± 0.03 0.01 ± 0.01 0.04 ± 0.03 0 0.03 ± 0.02
All nematodes 2.7 ± 0.96 14.6 ± 4.83 17.9 ± 3.46 2.8 ± 0.75 13.6 ± 2.20
Cestodes Hymenolepis diminuta 1.9 ± 0.65 4.2 ± 0.94 2.9 ± 0.78 2.7 ± 0.75 3.0 ± 0.50
Hymenolepis nana 4.9 ± 2.10 4.7 ± 2.12 14.0 ± 2.36 15.1 ± 5.02 11.5 ± 1.59
Taenia taeniaeformis 0 0 0.02 ± 0.01 0 0.01 ± 0.005
All adult cestodes 6.8 ± 2.14 9.0 ± 2.22 16.9 ± 2.44 17.8 ± 4.94 14.4 ± 1.63
All cestodes 6.8 ± 2.14 9.0 ± 2.22 16.9 ± 2.44 17.8 ± 4.94 14.4 ± 1.63
Acanthocephala Moniliformis moniliformis 0.3 ± 0.14 0.2 ± 0.08 0.2 ± 0.04 1.0 ± 0.80 0.3 ± 0.11
Although, not independently significant, there was also a trend of increasing abundance with age inR. norvegicus (means = 1.5 ± 0.79, 4.4 ± 3.95 and 13.8 ± 6.28 for age
classes 1-3, respectively) and a peak in age class 2 with subsequent decline in R. rattus (means = 1.2 ± 0.98, 10.5 ± 3.08 and 6.5 ± 1.74, respectively). Moreover,
0 2 4 6 8 10 12
1 2 3
M
ean
±
S
.E
.M.
Seasonal cycle
R. norvegicus R. rattus
A
0 10 20 30 40 50
Cycle 1, dry season
Cycle 1, wet season
Cycle 2, dry season
Cycle 2, wet season
Cycle 3, dry season
Cycle 3, wet season
M
ean ±
S
.E
.M
.
Seasonal cycle and season
R. norvegicus R. rattus
C
0 1 2 3 4 5
1 2 3
M
ean ±
S
.E
.M
.
Seasonal cycle
R. norvegicus R. rattus
[image:16.595.56.545.87.629.2]B
there was also an overall bias in the direction of male rats in both species (mean = 11.5 ± 5.03, 2.2 ± 1.49 for male and female R. norvegicus, and 10.0 ± 2.37, 5.5 ±
1.92 for male and femaleR. rattus, respectively), but this was not significant when other factors were included in the model.
0 10 20 30 40 50 60 70 80 90
Cycle 1, dry season
Cycle 1, wet season
Cycle 2, dry season
Cycle 2, wet season
Cycle 3, dry season
Cycle 3, wet season
M
ea
n
±
S
.E.M
.
Seasonal cycle and season
R. norvegicus R. rattus
C
0 5 10 15 20 25 30
R. norvegicus R. rattus
M
ea
n
±
S
.E.M
.
Host species
Age class 1 Age class 2 Age class 3
A
0 0.2 0.4 0.6 0.8 1 1.2 1.4 1.6 1.8
R. norvegicus R. rattus
Age class 1 Age class 2 Age class 3
B
Me
an
±
S.
E
.M
[image:17.595.65.537.81.640.2].
Discussion
Despite their importance as reservoirs of zoonotic infec-tions, wild rats have seldom been studied thoroughly with respect to the epidemiology of their helminths, and we are not aware of any other studies in which the hel-minth communities of the two common commensal rat species have been compared directly by rigorous analysis with possible confounding factors taken into account. In comparison with ecological studies of wood mice and bank voles in Europe [7,9-12,35-41], there are few quan-titative studies [8,42] of the helminth communities of rats exploring thoroughly a range of factors that have the potential to influence parasite burdens, and then clearly identifying and prioritising them. For the most part the literature on their helminths comprises species descriptions and lists from sites in different countries e.g. in the Middle East [43,44], Korea [45], Nigeria [46] and Malaysia [19-21,26,27]. Comparison of the helminth communities supported by each of these species was therefore one of of our key objectives.
As in many other cities around the globe, in Kuala Lumpur,R. rattusandR. norvegicusare the two domi-nant species of rats living commensally with people, but other species are also occasionally reported in Kuala Lumpur and the surrounding region, although seldom in high numbers [17,21,28]. The two species are closely related, with similar karyotypes [47] andR. norvegicus was formerly classed as a subspecies ofR. rattus[48]. Both rat species have adapted so successfully to a com-mensal life style that they are universally regarded as pests. Despite the many diverse methods used to control their populations, both species are widespread globally and both support a rich community of helminths, as the current study has shown (80% were infected with at least one of the helminths identified here and the mean infra-community species richness was 1.4), some of which are infectious to humans. In this paper we have focused on R. rattusandR. norvegicusas the obvious starting point for understanding the role of wild rats in the transmis-sion of helminths within the city.
Our random trapping efforts yielded more than twice as manyR. rattuscompared withR. norvegicus, suggesting differences in the population densities of both species. Therefore, not surprisingly, the helminth species list for R. rattuswas longer than that forR. norvegicus, since spe-cies richness is dependent on host density and sampling effort [49-51]. Each of the eleven species identified was recorded from R. rattus, whereas 3 were absent from R. norvegicus(S. muris,G. neoplasticumandT. taeniaefor-mis) even though each has been reported from this host in other studies [52,53]. In real terms 82% of the helminths were recovered fromR. rattusand even when sampling effort was taken into consideration almost 63% were still
from this host species. This bias in favour ofR. rattuswas also reflected at the infracommunity level in significantly higher values for species richness and for abundance of helminths, and for individual species such asH. nana. With all other factors taken into consideration,R. rattus carried significantly heavier worm burdens thanR. norvegi-cuswith mean values almost twice as high. In our study, therefore, and on these criteria,R. rattuswas a more impor-tant reservoir of helminth infections thanR. norvegicus.
We chose two quite different sites to trap rats in Kuala Lumpur. Chow Kit is the largest wet market in the city, so rats living in the site will have benefited from plentiful resources, and this site yielded most of the animals for the current project. In fact 59% of all the animals sampled wereR. rattustrapped at this market location, so assuming that these figures reflect the overall population density, R. rattusclearly does well in Chow Kit and the life cycles and transmission routes of their helminths will have been well entrenched in the site. By comparison, fewR. norvegi-cuswere caught in Chow Kit (only 12.3% of all rats), and these accounted for only 10.9% of the helminths recov-ered. The smaller numbers ofR. norvegicushere may be linked to differences in the habitat preferences of both rat species. It has been reported thatR. norvegicustends to favour residential sites [48], e.g. Bangsar, by occupying wall cavities and panelling of buildings, whereasR. rattus is typically associated with refuse and garbage tips and stores, as well as with cooked foodstuff, all readily available in the wet market of Chow Kit. Thus whereasR. rattus trapped at Chow Kit harboured the greatest percentage of helminths (38.9%) and showed the highest mean infracom-munity species richness,R. norvegicusat Chow Kit had the fewest helminths and had the lowest mean species rich-ness. Since the two rat species shared eight of the eleven species of helminths recorded in this study, it would appear that the infective stages, particularly those of the monoxenous nematodes, released fromR. rattus, are not well transmitted toR. norvegicusat this site. This suggests that at least to some extent the two rats occupy different niches at Chow Kit likely to be related to their differing habitat preferences.
was that in Chow KitR. rattuswas clearly more impor-tant thanR. norvegicus as a carrier of helminths. Thus the disparity between the host species was essentially site specific and not equally evident at Bangsar.
Of the eleven species of helminths recorded, none of the nematodes are generally considered to be human infectious, although some authorities consider some to have zoonotic potential [28]. In addition to those we found, rats can be expected to harbour the infective stages ofToxocara catiandT. malaysiensis[54,55], both of which are known to exist in the local cat population (JW Lewis and SN Mohd Zain, unpublished observa-tions), but in the current work the musculature of the rats was not examined in sufficient detail to reveal these parasites. There was no evidence in the current study of Calodium hepaticum (previously known asCapillaria hepatica, [56]), in the liver of the rats, although three of 50 rats examined earlier were infected with this parasite and it is known to have potential to cause human infec-tions [28]. Only two of the cestodes have been reported to infect humans more than just on the rare incidental occasion.H. diminutahas occasionally been reported from humans [57-59], and its occurrence in human hosts is linked with the accidental consumption in food of flour beetles, which act as intermediate hosts. There is, however, controversy as to whether the H. nana in rodents is the same or a different species to that infecting humans, although recent data support the lack of infec-tivity of human isolates in rodents [60,61]. The dwarf tapeworm of humans can be common in some human communities [62-65] and it has been recorded in school-children in Kuala Lumpur and other regions of Malaysia in the past [66-68]. Likewise,H. diminutahas also been reported from human populations in Malaysia [68], although to our knowledge not from Kuala Lumpur. Given that over a quarter of each of the rat species in both sites were infected withH. diminuta, (and as high as 57.5% ofR. norvegicusin Bangsar) and similar num-bers carriedH. nana, this must represent a public health risk, especially in the latter case where the life cycle can be direct without involvement of insect intermediate hosts, and therefore contamination of food for human consumption at market and street stalls is a high prob-ability in both sites.
In spite of the high prevalence of H. diminuta in R. norvegicusin Bangsar, most cestodes were recovered fromR. rattus, even relatively when sampling effort was taken into account, and this was largely due to the higher abundance ofH. nanain this host.H. nanawas the domi-nant species in 3 of the 4 data-subsets, and the abundance of this cestode inR. rattuswas almost 3 times as high as that inR. norvegicus. The dominance of cestodes in this study does have some precedents in tropical countries. For example, it has been reported thatH. diminuta was the
only helminth recovered from an urban rat population in Qatar [42], but this may have been a consequence of the harsh arid environment in the outskirts of Doha reducing helminth richness and diversity.
Interestingly, nematodes showed a different preference for rat hosts in each of the two sites. Thirty eight percent of all nematodes were recovered from R. norvegicusat Bangsar, whilst 47.2% were fromR. rattusat Chow Kit, and to a large extent these values were driven by the abun-dance ofN. brasiliensis. At Bangsar this species was 12 times more abundant inR. norvegicusand in Chow-Kit over 100 times more abundant inR. rattus. This again strongly suggests that whilst both species of rats were recovered from both sites, their exact ecological niches did not greatly overlap.R. norvegicusgenerally displace the black rat in areas where humans live. In addition to being larger and more aggressive, the change from wooden structures and thatched roofs, typical of poorer quarters of the city, to bricked and the tiled buildings found at Bang-sar, favours the burrowing brown rats over the more arboreal black rats. Moreover, brown rats eat a wider vari-ety of foods, and are more resistant to weather extremes. N. brasiliensisis transmitted by infective motile skin pene-trating L3 larvae which contaminate the nests and runs thatR. rattususes in territories that are more likely to include refuse tips which provide optimum conditions for the survival and hatching of eggs ofN. brasiliensis. In the cleaner environment of Bangsar,R. norvegicusmay live in contaminated burrows, whileR. rattusmay avoid compar-able levels of exposure by the absence of freely availcompar-able refuse and its arboreal habits.
[70]), that harbour the infective L3 stages, and it is concei-vable that this seasonal pattern of occurrence in rats was to some extent determined by the availabilty of arthropod hosts and their annual population cycles. A striking seaso-nal pattern with highest prevalence and abundance of this species inR. rattuswas recorded in the early autumn and winter periods on North Island of New Zealand, at a sea-son that also coincided with the wetter part of the year [71]. The closely related speciesM. dipodomisshowed a higher prevalence in the late summer/autumn period in Dipodomysspp. andPerognathusspp. in New Mexico, USA [72]. However, seasonal differences in prevalence and abundance of other spirurid nematodes have pointed to higher transmission in the summer months (e.g. Pterygo-dermatites peromysciinPeromyscus leucopus[13]).
A similar pattern relating to abundance was found for the tapewormH. nana, with mean abundance being con-sistently higher in the wet season inR. rattus, and in the first two seasonal cycles inR. norvegicus. This species can exploit intermediate hosts such as the tenebrionid beetles but it can also be transmitted directly, since its eggs can hatch in the intestine of rodents and complete the cysti-ceroid stage in the small intestine as well as the subse-quent maturation to fecund adults. The seasonal pattern, however, does suggest that transmission may have been dependent on external sources, but whether egg survival in the dry season was poorer or whether suitable insect hosts were scarce is not known.
The significant seasonal effects detected inH. nanaand M. muris, largely explained the patterns observed in other parameters used to asses helminth communities when data from all helminths were combined. For exam-ple species richness was higher in the wet compared to dry seasons, although in the case ofR. rattus, the lack of this effect in cycle 3, led to the loss of the overall seasonal variation when data were combined across 3 cycles. Mean abundance of helminths also increased in the wet season in both hosts, but additionally there was a steady progression of increasing abundance across cycles 1, 2 and 3, suggesting longer-term trends and possibly cycles over a longer time frame than that detectable in a 3 year investigation.
Longer term patterns were evident through the signifi-cant differences between cycles, but again in only a few cases did they form clear unidirectional trends over time. Nevertheless, there was a significant trend of increasing helminth diversity inR. rattusbut not inR. norvegicus, suggesting that helminth community structure in the for-mer was changing over time. At the individual species level, the abundance ofH. spumosumincreased with each successive cycle in R. rattusbut not in R. norvegicus, whilst that ofN. brasiliensisincreased in both hosts. Both of these nematodes are monoxenous and therefore do
not depend on intermediate hosts, and transmission is by eggs and infective L3 larvae, respectively.
Conversely, there were also some interesting downward trends with time. For example the prevalence ofH. dimin-utadrifted downwards with successive cycles in both rat hosts in Bangsar, but not in Chow Kit, suggesting that the transmission was decreasing with time and that the man-agement policy for Bangsar, which is always kept clean, was paying off in terms of disease transmission. With mar-kets combined, abundance also showed a clear decrease with time inR. rattusbut not inR. norvegicus. However, the abundance ofH. nanafell with successive cycles in R. norvegicus but not inR. rattus, in which abundance was stable in each of the wet seasons and there was an upward trend with successive dry seasons. Whether these patterns actually represent dynamic changes resulting from changes in the risk of transmission locally or whether they are con-stituents of longer-term cycles, in both cases driven by biological/ecological factors, or just spurious variation between years is not yet clear, and will only become more apparent when data collection is continued over an even longer period of time.
Helminths are renowned for their chronic long-lasting infections and the poor protective responses that they eli-cit in their hosts [73,74], and not surprisngly they are often found to accumulate with host age [75]. In our ana-lysis, examples included the increase in helminth diversity and increasing species richness with age inR. rattus, increasing prevalence ofH. spumosumwith age in both rats species, increasing abundance ofN. brasiliensiswith age inR. norvegicusand increasing prevalence and abun-dance ofM. murisin both species of rats. The strongest independent effects of age were observed in the last named species, a stomach dwelling spirurid that is rela-tively large and robust with a thick cuticle [76]. It takes over 5 weeks to begin laying eggs and is clearly well adapted for long term survival in its host [69].
One species that is known to stimulate potent immu-nity in its host isH. nana[77], and our data were consis-tent with this concept in so far as prevalence and abundance declined with host age in both host species, suggesting that after exposure in early life rats became immune to further infection and rejected their earlier acquired worm burdens. There was also some indication that the abundance ofN. brasiliensisdeclined in the old-estR. rattus, but not inR. norvegicus, and this is another species that is known to elicit potent protective immunity in its host [78,79].