RESEARCH
Longitudinal genome-wide DNA
methylation analysis uncovers persistent
early-life DNA methylation changes
Raúl F. Pérez
1,2, Pablo Santamarina
1,2, Juan Ramón Tejedor
1, Rocío G. Urdinguio
1, Julio Álvarez‑Pitti
3,4,
Pau Redon
3,4, Agustín F. Fernández
1, Mario F. Fraga
2*and Empar Lurbe
3,4*Abstract
Background: Early life is a period of drastic epigenetic remodeling in which the epigenome is especially sensitive to extrinsic and intrinsic influence. However, the epigenome‑wide dynamics of the DNA methylation changes that occur during this period have not been sufficiently characterized in longitudinal studies.
Methods: To this end, we studied the DNA methylation status of more than 750,000 CpG sites using Illumina Methyl‑ ationEPIC arrays on 33 paired blood samples from 11 subjects at birth and at 5 and 10 years of age, then characterized the chromatin context associated with these loci by integrating our data with histone, chromatin‑state and enhancer‑ element external datasets, and, finally, validated our results through bisulfite pyrosequencing in two independent longitudinal cohorts of 18 additional subjects.
Results: We found abundant DNA methylation changes (110,726 CpG sites) during the first lustrum of life, while far fewer alterations were observed in the subsequent 5 years (460 CpG sites). However, our analysis revealed persistent DNA methylation changes at 240 CpG sites, indicating that there are genomic locations of considerable epigenetic change beyond immediate birth. The chromatin context of hypermethylation changes was associated with repressive genomic locations and genes with developmental and cell signaling functions, while hypomethylation changes were linked to enhancer regions and genes with immunological and mRNA and protein metabolism functions. Signifi‑ cantly, our results show that genes that suffer simultaneous hyper‑ and hypomethylation are functionally distinct from exclusively hyper‑ or hypomethylated genes, and that enhancer‑associated methylation is different in hyper‑ and hypomethylation scenarios, with hypomethylation being more associated to epigenetic changes at blood tissue‑ specific enhancer elements.
Conclusions: These data show that epigenetic remodeling is dramatically reduced after the first 5 years of life. However, there are certain loci which continue to manifest DNA methylation changes, pointing towards a possible functionality beyond early development. Furthermore, our results deepen the understanding of the genomic context associated to hyper‑ or hypomethylation alterations during time, suggesting that hypomethylation of blood tissue‑ specific enhancer elements could be of importance in the establishment of functional states in blood tissue during early‑life.
Keywords: Epigenetics, DNA methylation, Histone modification, Aging, Newborn, Longitudinal
© The Author(s) 2019. This article is distributed under the terms of the Creative Commons Attribution 4.0 International License (http://creat iveco mmons .org/licen ses/by/4.0/), which permits unrestricted use, distribution, and reproduction in any medium, provided you give appropriate credit to the original author(s) and the source, provide a link to the Creative Commons license, and indicate if changes were made. The Creative Commons Public Domain Dedication waiver (http://creat iveco mmons .org/ publi cdoma in/zero/1.0/) applies to the data made available in this article, unless otherwise stated.
Open Access
*Correspondence: mffraga@cinn.es; Empar.Lurbe@uv.es
2 Nanomedicine Group, Nanomaterials and Nanotechnology Research
Center (CINN‑CSIC), Universidad de Oviedo, 33940 Oviedo, Asturias, Spain
3 Servicio de Pediatría, Consorcio Hospital General Universitario de
Valencia, 46014 Valencia, Spain
Background
Epigenetic modifications such as DNA methylation are known to influence gene expression and thus biological function [1] and alterations in epigenetic marks are found in processes ranging from physiological development and cellular differentiation [2] to pathological scenarios, as well as aging [3, 4]. Reflecting the developmental changes of the individual, most epigenetic changes occur dur-ing embryogenesis, where waves of extensive epigenetic reprogramming take place [5]. After birth, epigenetic modification continues to take place throughout the human lifespan, both at the DNA methylation and chro-matin levels [6] and precise DNA methylation markers of age have recently been developed [7].
It seems, however, that the first years of life constitute the post-natal period with the most substantial epige-netic changes [8, 9] and, moreover, prenatal and early life epigenetic aggression has been linked to countless health-related consequences in a wide variety of settings [10]. Thus, the characterization of childhood DNA meth-ylation changes could help uncover genomic locations of functional relevance.
While age-related changes have been functionally linked to many biological processes, other alterations are known to arise in a stochastic fashion [11, 12]. As such, the use of longitudinal experimental designs can allow for the identification of DNA methylation altera-tions in a more controlled environment [9, 13–16], and this approach has also been employed to study the influ-ence of clinical parameters on the epigenome, especially during early childhood [17]. However, longitudinal DNA methylation studies which analyze data from more than two time points remain scarce [17–19] and most of the previous literature stands on now surpassed methyla-tion screening technologies such as the Infinium Human Methylation 450K BeadChip which mainly interrogates CpG-dense genomic regions, even though the functional association between DNA methylation and gene expres-sion is increasingly being described for CpG-sparse loca-tions such as enhancers and gene bodies [20].
This study, therefore, presents, to the best of our knowledge, the first 3-point longitudinal genome-wide DNA methylation analysis of blood tissue employing the Illumina Infinium MethylationEPIC BeadChip, which allowed us to characterize two distinct phases of early-life epigenetic changes during the first 10 years of early-life at the same time as focusing on various types of genomic regions, using a clinically well-characterized cohort. Fur-thermore, we integrated our generated data with exter-nal chromatin and enhancer datasets in order to obtain a functional view of the observed age-related DNA methylation changes. Finally, we applied bisulfite pyrose-quencing in order to technically and biologically validate
the results obtained in the discovery and independent cohorts, respectively.
Methods
Selection of participants
Newborn children born at term (gestational age
≥ 37 weeks) after uncomplicated pregnancies and in the absence of perinatal illness in the General Hospital, University of Valencia, Spain, were randomly selected to enroll in the study. The characteristics of each gesta-tion and delivery were obtained from routine obstetrical records, and the gestational age at birth was measured using the method of Ballard et al. [21]. Groups were established on the basis of birth weight: < 10th percen-tile for their sex (SGA); between 10th and 90th percenpercen-tile (AGA); and > 90th percentile (LGA) [22]. The subjects were followed-up at 5 and 10 years of age.
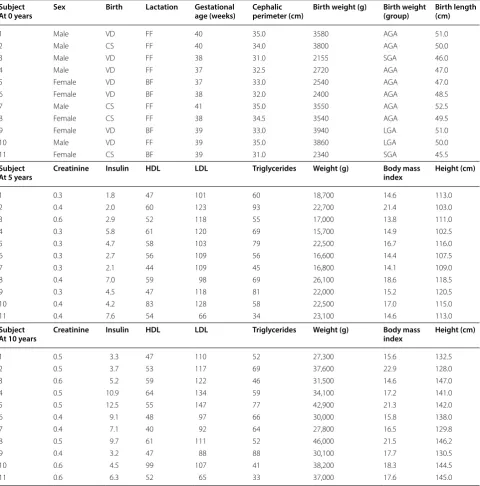
Anthropometric parameters and biochemical analyses At both 5 and 10 years, height was measured to the near-est 0.5 cm using a standardized wall-mounted height board, and body weight to the nearest 0.1 kg using a standard beam balance scale with the barefoot subjects wearing light clothing. Body mass index (BMI) was cal-culated as the weight in kilograms divided by the square of the height in meters (see Table 1 and Additional file 1: Table S9 for this and other clinical information).
Sample collection, DNA extraction, and quantification Blood samples were collected from a total of 29 subjects at different testing times (n = 51). Cord blood samples
were taken at birth and peripheral venous blood sam-ples were taken from each child during their fifth and tenth year of life. Genomic DNA was extracted with the RealPure kit (RealPure, REAL, Durviz) and quantified with the Nanodrop-2000C Spectrophotometer. A DNA quality check was performed with Quant-iT PicoGreen dsDNA reagent.
Genome‑wide DNA methylation analysis
DNA pyrosequencing
The DNA methylation status of representative CpG sites (cg07547765, cg11047325, cg03830443) was evaluated by bisulfite pyrosequencing using the primers described in Additional file 2: Table S8. Technical validations were performed for all 11 subject samples at the three time points (n = 33) and biological validations were performed
on two independent cohorts: (1) peripheral blood from 9 children at birth and 5 years of age (n = 18), and (2) peripheral blood from 9 different children at 5 and 10 years (n = 18). Genomic DNA was isolated follow-ing standard phenol–chloroform extraction protocols. Bisulfite conversion of isolated DNA was performed in accordance with the EZ DNA methylation-gold kit Table 1 Clinical characteristics of the 11 subjects enrolled in the study
FF formula feeding, BF breast feeding, VD vaginal delivery, CS cesarean section, AGA appropriate for gestational age, SGA small for gestational age, LGA large for gestational age, HDL high-density lipoprotein, LDL low-density lipoprotein
Subject
At 0 years Sex Birth Lactation Gestational age (weeks) Cephalic perimeter (cm) Birth weight (g) Birth weight (group) Birth length (cm)
1 Male VD FF 40 35.0 3580 AGA 51.0
2 Male CS FF 40 34.0 3800 AGA 50.0
3 Male VD FF 38 31.0 2155 SGA 46.0
4 Male VD FF 37 32.5 2720 AGA 47.0
5 Female VD BF 37 33.0 2540 AGA 47.0
6 Female VD BF 38 32.0 2400 AGA 48.5
7 Male CS FF 41 35.0 3550 AGA 52.5
8 Female CS FF 38 34.5 3540 AGA 49.5
9 Female VD BF 39 33.0 3940 LGA 51.0
10 Male VD FF 39 35.0 3860 LGA 50.0
11 Female CS BF 39 31.0 2340 SGA 45.5
Subject
At 5 years Creatinine Insulin HDL LDL Triglycerides Weight (g) Body mass index Height (cm)
1 0.3 1.8 47 101 60 18,700 14.6 113.0
2 0.4 2.0 60 123 93 22,700 21.4 103.0
3 0.6 2.9 52 118 55 17,000 13.8 111.0
4 0.3 5.8 61 120 69 15,700 14.9 102.5
5 0.3 4.7 58 103 79 22,500 16.7 116.0
6 0.3 2.7 56 109 56 16,600 14.4 107.5
7 0.3 2.1 44 109 45 16,800 14.1 109.0
8 0.4 7.0 59 98 69 26,100 18.6 118.5
9 0.3 4.5 47 118 81 22,000 15.2 120.5
10 0.4 4.2 83 128 58 22,500 17.0 115.0
11 0.4 7.6 54 66 34 23,100 14.6 113.0
Subject
At 10 years Creatinine Insulin HDL LDL Triglycerides Weight (g) Body mass index Height (cm)
1 0.5 3.3 47 110 52 27,300 15.6 132.5
2 0.5 3.7 53 117 69 37,600 22.9 128.0
3 0.6 5.2 59 122 46 31,500 14.6 147.0
4 0.5 10.9 64 134 59 34,100 17.2 141.0
5 0.5 12.5 55 147 77 42,900 21.3 142.0
6 0.4 9.1 48 97 66 30,000 15.8 138.0
7 0.4 7.1 40 92 64 27,800 16.5 129.8
8 0.5 9.7 61 111 52 46,000 21.5 146.2
9 0.4 3.2 47 88 88 30,100 17.7 130.5
10 0.6 4.5 99 107 41 38,200 18.3 144.5
[image:3.595.58.539.102.589.2](Zymo Research) following the manufacturer’s instruc-tions. After PCR amplification, pyrosequencing was per-formed using PyroMark Q24 reagents and a vacuum prep workstation, equipment and software (Qiagen).
MethylationEPIC BeadChip data preprocessing
All analyses were carried out using the statistical soft-ware R (version 3.4.2). IDAT files from the methylatio-nEPIC BeadChip were preprocessed following a pipeline based on the R/Bioconductor package minfi (version 1.22.1) [23]. Probes where at least one sample had a detection p-value > 0.01, probes located in chromosomes X and Y, probes overlapping genetic variants [24] and crossreactive and multimapping probes [25] were dis-carded for downstream analyses. β-values were normal-ized using the Noob method [26] implemented in minfi, followed by a BMIQ normalization [27] implemented in the R/Bioconductor package ChAMP (version 2.8.9) [28]. M-values were calculated from the normalized β-values through a logit transformation (R/Bioconductor package lumi, version 2.28.0) [29] and employed for downstream analyses. Multidimensional scaling (MDS) and princi-pal component regression analyses were used to identify potential confounding variables (R/Bioconductor pack-ages Enmix, version 1.12.4) [30]. When specified, blood cell-type composition was calculated by the Houseman method [31]. However, to correct for batch effects and unwanted sources of variation in the data we performed a surrogate variable analysis [32] with the R/Bioconductor package sva (version 3.23.4) [33] because this procedure seeks to adjust for any confounders, including cell-type heterogeneity [34]. The number of latent factors was esti-mated using the “leek” method, but it is of note that no surrogate variables were found after the normalization procedures for our generated datasets.
Differential DNA methylation analyses
Differentially methylated probes (dmCpGs) were calcu-lated with the R/Bioconductor package limma (version 3.32.10) [35]. A linear model was fitted between meth-ylation levels as response variable, the variable of interest (age group), the aforementioned surrogate variables and the information of the paired samples (patient group) for each of the analyses: 0 vs. 5 and 5 vs. 10 years old. The set of p-values obtained from the tests was adjusted for multiple comparisons using the Benjamini–Hochberg method to control for false discovery rate (FDR < 0.05). An additional threshold of shift size was applied, filtering out significant probes with M-value changes of less than 0.5, as has been suggested elsewhere [36]. Venn diagram representations of the relationships between statisti-cally significant dmCpGs were generated with the online resource provided by the UGent/VIB bioinformatics unit
(available at http://bioin forma tics.psb.ugent .be/webto ols/Venn/). Further enrichment analyses were performed by means of two-sided Fisher’s tests (p < 0.05 significance threshold), measuring effect size either by odds ratio (OR), or by the difference between observed counts and expected hypergeometric means, employing appropriate backgrounds for the interrogated probes in each given context.
Density of CpG analysis
For each of the probes in the methylation arrays, density of CpG was measured as the number of genomic CpGs present divided by the number of those possible in a 2 kbp window centered on the CpG location under study. Wilcoxon non-parametric tests were used to determine whether there were significant differences between the density distributions of the CpGs belonging to each sub-set of interest and the densities of the array probes in the background. A significance level of 0.05 was employed for all tests. Shift size was measured using median differ-ences and Cliff’s Delta (CD).
CGI status and genomic region analysis
CGI (CpG island) membership was assigned to each probe using the Illumina EPIC annotation with the R/ Bioconductor package and IlluminaHumanMethyla-tionEPICanno.ilm10b2.hg19 (version 0.6.0). Genomic region position was assigned using the R/Bioconductor packages TxDb.Hsapiens.UCSC.hg19.knownGene (ver-sion 3.2.2) and ChIPseeker (version 1.12.1) [37]. Statisti-cal significance with respect to concrete CGI status or genomic region was determined by two-sided Fisher’s tests (significance level p < 0.05), and ORs were used as a measure of the association effect with respect to a par-ticular feature. Appropriate backgrounds which included all the probes interrogated by the EPIC array in each of the comparisons were used for statistical purposes.
Region set enrichment analysis
chromatin-segment analysis using the expanded NIH Roadmap ChromHMM 18-state model tracks for the same 98 epigenomes, generated from the previous histone marks (custom database generated with data obtained from http://egg2.wustl .edu/roadm ap/). In a similar fashion, enhancer enrichment analysis was performed using the enhancer tracks defined in the EnhancerAtlas database [41] (custom database gen-erated with data obtained from http://enhan cerat las. org/downl oad.php) for 65 genomes (primary tissues, cultures and cell lines) defined by the consensus com-bination of different independent experimental data-sets such as histone marks, DNAse hypersensitive sites (DHS) and transcription factor binding sites (TFBS). This last dataset was also used to create the CpG-gene network shown in Fig. 4c: CpGs were first mapped to enhancers in at least one of the 22 EnhancerAtlas tracks corresponding to blood tissue and cell type, and afterwards plotted using the R/CRAN package igraph, where network nodes represent CpG sites or genes, while network edges reflect interactions between the enhancer element containing the CpG and the corre-sponding associated gene.
Gene ontology analyses
Gene ontology enrichments were calculated using the R/ Bioconductor package missMethyl (version 1.10.0 gometh function) [42], which performs one-sided hypergeomet-ric tests taking into account and correcting for any bias derived from the use of differing numbers of probes per gene interrogated by the array. The annotation data-base that was interrogated is contained within the R/ Bioconductor package GO.db (version 3.4.1). Appropri-ate backgrounds of total probes for each given context were employed in the corresponding analyses. Addition-ally, because a great number of genes contained both hyper- and hypomethylated probes, certain gene ontol-ogy enrichments were performed only on those genes that were exclusively hyper- or hypomethylated. Further analyses were also performed by grouping the annotated CpGs into gene regions, using the annotations provided in Additional file 3: Table S1 (column “annotation”): “pro-moter” is formed by collapsing “Distal pro“pro-moter” and “Promoter (≤ 1 kb)”, “gene body” is formed by collapsing
“3′ UTR”, “5′ UTR”, “Intron”, “Exon” and “Downstream”). epigenomes Additional file 4: Table S6 contains the full information on the gene ontology analyses. To help with the visualization of the results, the ontologies were graphically summarized using the online tool REViGO (available at http://revig o.irb.hr/) [43], which performs semantic similarity analyses in order to reduce the num-ber of redundant functional terms obtained.
Results
Genome‑wide profiling of DNA methylation changes during the first 10 years of life
To characterize DNA methylation changes that occur during the first years of life, we analyzed the methyla-tion status of 783,659 CpG sites in cord, 5-year-old and 10-year-old paired blood samples from 11 subjects (see Table 1 and Fig. 1a) using the Illumina Infinium Meth-ylationEPIC BeadChip. After preprocessing our data (see “Methods”), we applied an empirical Bayes mod-erated t test to identify CpGs differentially methylated between the different age groups (dmCpGs; FDR < 0.05) (see “Methods”). We found 110,726 CpGs whose meth-ylation level significantly changed from birth to 5 years (0 → 5), but only 460 from 5 to 10 years (5 → 10). The
0 → 5 widespread methylation changes consisted of,
respectively, 59,749 and 50,977 CpGs hyper- or hypo-methylated over time, while 130 and 330 CpGs, respec-tively, were found to be hyper- or hypomethylated over the 5 → 10 years period (Fig. 1b, Additional file 3:
Table S1). Notably, hypomethylation changes were found to be more pronounced than hypermethylation changes between 0 and 5 years, while the magnitude of change was more balanced in both directions between 5 and 10 years (Additional file 5: Figure S1).
Next, we determined the genomic distribution of the dmCpGs identified, distinguishing between CpG island-related regions and gene-island-related regions (Fig. 1c). As compared to the distribution of the array background, hypermethylated CpGs were found to be enriched at CpG islands for both 0 → 5 and 5 → 10 changes (Fish-er’s test; both p < 0.001, odds ratios (ORs) = 1.2 and 7.4,
respectively) and impoverished at open sea locations (Fisher’s test; both p < 0.001, ORs = 0.6 and 0.2
respec-tively), while the inverse was the case for hypomethyl-ated CpGs, that is they were very enriched at open sea regions (Fisher’s test; both p < 0.001, ORs = 2.4 and 6.9,
for 0 → 5 and 5 → 10, respectively) and very
impov-erished at CpG islands (Fisher’s test; both p < 0.001, ORs = 0.1 and 0.03 for 0 → 5 and 5 → 10, respectively).
As regards gene-related locations, hypermethylated CpGs were enriched at promoters and distal promot-ers (Fisher’s test; both p < 0.001, ORs = 1.04 and 1.5 for
0 → 5 and both p < 0.001, ORs = 2.2 and 1.4 for 5 → 10)
and impoverished at intronic regions for 0 → 5 changes
(Fisher’s test; p < 0.001, OR = 0.8) and at both intronic
and intergenic regions for 5 → 10 changes (Fisher’s
test; both p < 0.001, ORs = 0.4 and 0.4), while in
con-trast, hypomethylated CpGs were preferentially found at intronic and intergenic regions for both age bands, (Fisher’s test; p < 0.001, ORs = 1.6 and 1.3, in these
regions respectively, for 0 → 5 and p < 0.01 and < 0.001,
Lastly, we analyzed the genomic density of the dmCpGs found (see “Methods”), which confirmed that hypermeth-ylation occurred at genomic regions dense in CpG dinu-cleotides, while hypomethylation appeared at CpG-poor regions (Fig. 1d, Wilcoxon test; all p < 0.001, median dif-ferences (MD) and Cliff’s deltas (CD) compared to array background 0.014/0.15 and − 0.014/− 0.29 for 0 → 5 and 0.05/0.5 and − 0.02/− 0.5 for 5 → 10 hyper- and hypo-methylated CpGs, respectively).
On the whole, these analyses reveal strong differences between DNA methylation changes that occur dur-ing the first years of life, where extensive methylation changes are observed between 0 and 5 years, while only moderate changes occur between 5 and 10 years. Strik-ingly, while the genomic distribution of these changes appeared to be similar, we found that the changes occur-ring in the first lustrum of life were of a greater magni-tude that those occurring in the second lustrum (Fig. 2a, Wilcoxon test; p < 0.001, MD = 0.02, CD = 0.2). Moreo-ver, these differences, which were predicted by the PCA analysis (Fig. 1a), did not seem to be related to any major changes in the composition of blood cell types, as shown by the hierarchical clustering analysis of their predicted cell types (see “Methods” and Additional file 6: Table S2),
where the samples did not show extensive age-associated clustering (Fig. 2b).
Chromatin and functional context of early‑years DNA methylation changes
In order to study the functional context in which the DNA methylation changes identified occurred, we inte-grated our results with previously published data from NIH Roadmap Epigenomics and ENCODE relating to ChIP-seq experiments describing the genome-wide localization of the histone modifications H3K4me1, H3K4me3, H3K27ac, H3K36me3, H3K27me3 and H3K9me3 across different blood cell types and cell lines (see “Methods”). Due to the low number of probes, most of the enrichment analyses were unsuccessful for 5 → 10 changes (results available in the Additional file 7: Table S3, Additional file 8: Table S4, Additional file 9: Table S5).
By using this approach, we found that CpGs that were hypermethylated during the first 5 years of life were strongly associated with the repressive histone modifica-tion H3K27me3, while hypomethylated CpGs were asso-ciated with the active histone modification H3K4me1 (Fig. 3a, see Additional file 7: Table S3 for the full data).
a
b
c
d
[image:6.595.56.541.88.350.2]Subsequently we analyzed the enrichment of these dmCpGs for 18 chromatin states, as defined in a Hidden Markov Model (HMM) built from the previous histone modifications (see “Methods”). The results evidenced that hypermethylation occurred at enhancer states associated with bivalent chromatin (i.e. formed by the simultaneous presence of repressive and active marks) and polycomb repressive domains, while hypometh-ylation occurred at states associated with enhancers, especially of the intragenic type (Fig. 3b, see Addi-tional file 8: Table S4 for the full data). To gain a deeper understanding of enhancer-associated methylation changes, we integrated our data with the EnhancerAtlas database of predicted enhancers across 65 tissues (see “Methods”). This approach enabled us to character-ize hypermethylated CpGs as being weakly associated with enhancers present in tissue and embryonic tissue whereas hypomethylated CpGs appeared more strongly associated with enhancers across all datasets, but particularly those specifically related to blood tissue (blood cell lines and primary cells) (Fig. 3c, see Addi-tional file 9: Table S5 for the full data). Taken together, these results highlight the different functionality of the regions where DNA methylation is gained or lost dur-ing the first 5 years of life and suggest that hypometh-ylation could be more relevant than hypermethhypometh-ylation
in the establishment of epigenetic patterns at enhancers controlling tissue-specific functions.
Lastly, we performed gene ontology analyses on the genes containing the dmCpGs. In order to avoid bias due to genes with both hyper- and hypomethylated dmCpGs, we conducted the analyses on those genes that were either exclusively hypermethylated or exclusively hypo-methylated, also controlling for differences in the number of CpGs analyzed for each gene in the array (see “ Meth-ods”). This led to the finding that hypermethylated genes were mainly linked to developmental and cell-to-cell signaling processes, albeit with other notable ontologies also involved, such as response to retinoic acid. Hypo-methylated genes, on the other hand, were enriched in metabolic terms related to mRNA and protein metabo-lism, immune response and mitosis (Fig. 3d, see Addi-tional file 4: Table S6 for the full data). Curiously, when looking at the ontologies of dmCpGs belonging to genes that experienced both hyper- and hypomethylation, the main roles of the genes affected were with respect to cell surface signaling and intracellular component trans-port (Additional file 10: Figure S2A, Additional file 4: Table S6). This suggests that genes undergoing both hyper- and hypomethylation may well have different cel-lular functions than those that are differentially methyl-ated in one direction only. This prompted us to examine the ontologies for all of the hyper- or hypomethylated
a
b
[image:7.595.55.538.87.334.2]probes (i.e. without taking into account the fact that they might be associated with genes that also contained probes with change in the opposite direction), which were also different (Additional file 10: Figure S2B, Addi-tional file 4: Table S6): while the 0 → 5 hypermethylation ontologies did not substantially change, the hypometh-ylation terms appeared related more to cellular function, localization and activation, and membrane function, with immune terms being were maintained (Additional file 10: Figure S2, Additional file 4: Table S6). This last observa-tion implies that not taking into account the existence of simultaneously hyper- and hypomethylated genes could alter the results obtained by ontology-enrichment analyses.
Taking into account these last findings, we extended our analyses to characterize gene ontologies depending on the gene region of the associated dmCpGs. We divided the 0 → 5 dmCpGs into promoter-, exon-, intron- or gene body-associated, hyper- or hypomethylated dmCpGs (8 groups in total), in order to identify differences, for exam-ple, between the ontologies of genes that suffered DNA methylation changes in their promoters versus genes with changes in their gene bodies. The results (Addi-tional file 11: Figure S3, Additional file 4: Table S6), when compared to those previously found without segregat-ing dmCpGs by context (shown in Fig. 3d) showed that genes associated to different functions suffered changes at different locations. For hypermethylated CpGs (Addi-tional file 11: Figure S3A), the main functions related to development and signaling seen in Fig. 3d were found on genes with promoter- and exon-associated DNA meth-ylation gains, while the functions associated to genes containing exon- or gene body-(the majority of which is exons) methylation increases were considerably differ-ent, manifesting functions such as GTPase signaling, ion transport or cell projection. For hypomethylated CpGs (Additional file 11: Figure S3B), the initially observed functions related to mRNA metabolism, protein trans-port or immune response were also found in genes with promoter-associated DNA methylation loses (which
were, though, much more enriched in immunologi-cal functions), while, again, the functions observed for genes containing exon- or gene body-associated meth-ylation reduction changed, being more related to signal transduction and movement of subcellular components. On the whole, these observations reinforce the idea that DNA methylation changes occur at different gene regions depending on the functionality of the affected gene.
Persistent DNA methylation changes during the first 10 years of life
After conducting the analyses of DNA methylation, we made use of the longitudinal design of our study to com-pare the changes occurring in the 0 → 5 compared to the 5 → 10 period. Interestingly, we discovered an over-enriched subset of 240 dmCpGs that were altered in the first 5 years of life which continued to change in the fol-lowing 5 years [Fig. 4a, Fisher’s test; p < 0.001, OR = 6.6, expected hypergeometric mean (EHM) = 65]. No sig-nificant gene ontologies were found for this set after correcting for multiple comparisons, although the top hypermethylation terms were related to developmental processes, and those for hypomethylation with metabolic and immunological activities (data not shown).
We subsequently filtered out CpGs with changes of less than 10% in β-value in order to retain those with more plausible biological roles, leaving 36 CpGs (Table 2). These remaining CpGs manifested two kinds of behav-ior: either strong first-lustrum changes with weaker sec-ond-lustrum changes, or a trend of constant (moderate) change (Fig. 4b, see Additional file 12: Figure S4 for all 36 CpG plots). A total of 16 different genes related to these select 0 → 5→10 dmCpGs, and, notably, two of the 36 CpGs were mapped to the HOXB7 gene. Since a propor-tion of these CpG sites were not associated with any gene and many of them were located in open sea regions (see Table 2), we made use of the EnhancerAtlas database to map them to enhancer elements in the 22 different types of blood tissue and cells shown in Fig. 3c (see “ Meth-ods”), and constructed a network with the linked to the Fig. 3 Chromatin and functional context of DNA methylation changes. a Heatmaps depicting significant (p < 0.05) enrichment of hyper‑ and hypomethylated 0 → 5 dmCpG sites with different histone marks, in a selection of 21 different blood tissue and cell types (see Additional file 7: Table S3 for 98 full cell and tissue types, and also 5 → 10 dmCpG enrichments). The color code indicates the significant enrichment based on the odds ratio (OR). b Heatmaps displaying significant (p < 0.05) enrichment of hyper‑ and hypomethylated 0 → 5 dmCpG sites with different chromatin states, in a selection of 21 different blood tissue and cell types (see Additional file 8: Table S4 for 98 full cell and tissue types, and also 5 → 10 dmCpG enrichments). The color code indicates the significant enrichment based on the OR. c Heatmaps showing significant (p < 0.05) enrichment of hyper‑ and hypomethylated 0 → 5 dmCpG sites with predicted enhancers in 65 different cell and tissue types (see Additional file 9: Table S5 for full data, and also 5 → 10 dmCpG enrichments). The color code indicates the significant enrichment based on the OR. d Treemap plots indicating the results of REViGO semantic analyses of significantly enriched (FDR < 0.05) gene ontology biological process terms for genes containing 0 → 5 dmCpGs. In total, 402 and 345 significant terms were found for hyper‑ and hypomethylated dmCpGs, respectively (see Additional file 4: Table S6 for full results, including molecular function and cellular component terms, and also 5 → 10 dmCpG enrichments)
b a
c
enhancer elements containing the dmCpGs (Fig. 4c). In this way we thereby revealed additional relationships with other genes, with some sites, such as cg07061387,
showing relationships with up to 3 different genes. Taken together these results indicate that the majority of the later-years epigenetic changes seem to be a weaker
a
b
c
Fig. 4 Comparison of 0 → 5 and 5 → 10 DNA methylation changes. a Venn diagrams illustrating the overlap between 0 → 5 and 5 → 10 dmCpGs (the results of a Fisher’s test for over‑enrichment of the overlap is shown). b Plots illustrating the age‑dependent change in β‑value for 4 examples of dmCpGs common to both 0 → 5 and 5 → 10 (see Additional file 12: Figure S4 for all 36 CpG plots). c Network of gene–enhancer interactions observed between dmCpGs mapped to enhancer elements in blood tissue and cell types and associated genes. The number of connections between nodes reflects the mapping of a dmCpG to enhancers in more than one track
Table 2 CpG sites that change substantially during the first 10 years of life
Name Location UCSC RefGene Name Location UCSC RefGene Name Location UCSC RefGene
cg13949829 Island MIR1225;PKD1 cg12024906 Island HKR1 cg07690222 Open Sea TMTC2
cg01323777 Island KCNAB3 cg23201812 Open Sea cg05498680 Open Sea
cg00002033 Island LRFN1 cg01654035 Open Sea cg11047325 Island SOCS3
cg23669081 Island HOXB7 cg03853945 Open Sea cg01331772 Open Sea
cg17238334 Open Sea LOC102477328 cg18311495 Open Sea cg16022195 S‑Shore
cg01511232 Island cg26617011 Open Sea cg03465600 Open Sea PARD3B
cg01577707 Open Sea MIR100HG cg03830443 S‑Shore ZFPM2 cg22398226 N‑Shore
cg07547765 Island HOXB7 cg24199558 Open Sea cg02920129 Open Sea ZNF385D
cg07061387 Open Sea CD200R1 cg12628061 Open Sea cg13254363 Open Sea
cg24348981 Open Sea cg13420364 Open Sea cg05346619 Open Sea
cg13329407 Open Sea cg18647570 Open Sea DHX8 cg10097598 Open Sea
[image:10.595.58.542.85.391.2] [image:10.595.56.540.489.658.2]continuation of those that occur during the first 5 years of life, although there also appear to be certain CpG sites that show a more linear, and constant, trend of change along the first 10 years of life.
Finally, we performed both technical and experimental bisulfite pyrosequencing validations of three of the CpGs found at the HOXB7 (cg07547765), SOCS3 (cg11047325) and ZFPM2 (cg03830443) genes (Fig. 5, see Additional file 13: Table S7 for full data). Firstly, we analyzed the methylation value of the 11 subjects at three time points (n = 33), which demonstrated a very strong correlation
between the Infinium MethylationEPIC BeadChip and pyrosequencing technology (Fig. 5a, b, Pearson correla-tion coefficient = 0.91, p < 0.001). Secondly, we evaluated the methylation status of the same CpGs in the periph-eral blood of an independent longitudinal cohort of 9 children measured at birth and 5 years of age (n = 18), along with another independent longitudinal cohort of 9 different children measured at 5 and 10 years of age (n = 18) (Fig. 5c, see Additional file 1: Table S9 for the clinical information relating to these cohorts). This bio-logical validation showed that the DNA methylation
a
c
b
[image:11.595.60.540.85.510.2]alterations identified can be reproduced in independent cohorts, thus underscoring the significance and robust-ness of the methylation changes found in this study.
Discussion
In the present study we examined the genome-wide methylation profile of 33 longitudinal blood samples from 11 children at 0 (newborn), 5 and 10 years of age. Firstly, we found that extensive DNA methylation changes occur during the first 5 years of life, while much less epigenetic remodeling takes place in the following 5 years. As many as 110,726 CpG sites were found to have altered DNA methylation values when comparing newborn and 5 year-old samples, with a slight tendency toward an increase in methylation with age (54% of dmCpGs), while only 460 CpGs exhibited significant methylation changes between 5 and 10 years of age, 72% of which lost methylation. These findings are in line with the current literature which describes early-years epigenetic changes as being the most important of the postnatal period [8]. What is more, our three time point study design allowed us to directly compare the alterations occurring during two different early-years intervals, demonstrating that after 5 years, epigenetic reshaping is dramatically reduced. In the same vein, Acevedo and colleagues in their reporting of longitudinal DNA methylation changes during the first 5 years of life noted that in the third year these already seem to be weakening [19]. Aside from being more numerous, we found DNA methylation changes to be far more pronounced in the first lustrum of life than the sub-sequent one, which may have importance in terms of the functional influence of these methylation alterations on gene expression. Moreover, this observation did not seem to be related to considerable changes in cell-type com-position occurring in the first 5 years as compared to the following 5.
We next examined the genomic distribution of the dmCpGs found, which revealed that hyper- and hypo-methylation changes occur at very different locations: loss of methylation being observed at CpG-poor regions such as open sea locations, including intronic and inter-genic regions, for both 0 → 5 and 5 → 10 changes, while
methylation gain occurred at CpG-denser regions like CpG islands and gene promoters for both of the age intervals examined (although 0 → 5 changes were more
similar to array distribution). These findings, with excep-tions [19] are in line with most studies describing age-related DNA methylation changes, both in the early years [8, 16] and later years of aging [44, 45]. The fact that the great majority of hypomethylation changes were found at open sea regions underscores the value of screening
technologies that examine CpG-sparse regions to accu-rately characterize DNA hypomethylation scenarios.
After identifying the genomic distribution of the age-related methylation changes, we sought to characterize the functional contexts associated with these loci. To achieve this, we integrated our DNA methylation data with external datasets describing histone modifications, chromatin states and enhancers for different tissue and cell types. These analyses primarily considered 0 → 5 dmCpGs because of the low number of 5 → 10 dmCpGs detected, which hindered the enrichments. The results evidenced a link between DNA hypermethylation and the repressive histone mark H3K27me3, and with chro-matin states related to polycomb repressive domains and bivalent chromatin enhancers, while DNA hypometh-ylation occurred mainly at H3K4me1 regions and intra-genic enhancers, as has been previously shown [46, 47]. Furthermore, when mapping the methylation changes to an enhancer library of 65 different tissues, we found that hypermethylation displayed a much lower overall enrich-ment at enhancer sites than hypomethylation, and while the former occurred mainly at enhancers in normal and embryonic tissue, the latter was particularly enriched in tissues and cell types related to blood. These observations suggest differences in the functionality of the enhancer-associated methylation changes that occur during the first 5 years of life depending on whether there is a gain or loss of methylation. Moreover, as studies are increas-ingly describing enhancer-associated DNA methylation as the main expression-correlated methylation phenom-enon [20, 48, 49], our results point towards the enhancer-enriched DNA hypomethylation observed perhaps being of more importance in the control of gene expression than DNA hypermethylation. Indeed, enhancer meth-ylation is in general negatively correlated to their activ-ity [50], and thus it would make sense that the epigenetic changes that occur during the final stages of development are accompanied by the inactivation of general develop-mental enhancer elements, while tissue-specific (blood) enhancers become activated. In this setting, our data sug-gest that the early-life DNA methylation loss enriched at tissue-specific enhancer regions observed in our data could reflect the establishment of epigenetic active pat-terns defining tissue function during this period of life, while enhancers associated to development are already epigenetically repressed and suffer less important (hyper-methylation) changes.
contained both hyper- and hypomethylated dmCpGs, we only performed the ontology analyses, firstly, on genes that exclusively either gained or lost methylation. We found that 0 → 5 DNA hypermethylation changes were principally related to developmental functions and cell-to-cell signaling, while hypomethylation was primarily linked to mRNA and protein metabolism, immune response and mitosis. It is worth mentioning that hypermethylation was also associated with terms such as growth, reproduction and response to retinoic acid, a molecule involved in organogenesis [51] as well as hematopoiesis [52]. Significantly, when we consid-ered the ontologies of genes containing both hyper- and hypomethylated probes, we found considerable differ-ences, implying that these genes could play different functional roles to those that are exclusively hyper- or hypomethylated. Moreover, when we examined the ontologies without making these distinctions, we found that, while hypermethylation ontologies did not con-siderably change, hypomethylation terms shifted from mRNA and protein metabolism to cellular localization and activation or GTPase activity (maintaining immuno-logical terms). These latter findings are more in line with those reported in previous works which did not describe separating exclusively hyper- and hypomethylated genes [8, 14, 16, 19]. However, the fact that we found a change in function suggests that not taking into consideration the presence of concurrently hyper- and hypomethyl-ated genes could affect the conclusions drawn from gene ontology analyses. On the whole, these results suggest that it is not only differentially hyper- or hypomethylated enhancers that have differing roles, but also differentially hyper- or hypomethylated genes, with the former being more related to general developmental functions, and the latter being involved in, among other things, immuno-logical functions, thus reflecting the functionality differ-ences observed for enhancer elements. In a final analysis, we further segregated the 0 → 5 dmCpGs into groups depending on their gene location (promoter, gene body, intron, exon) and also found changes between the gene ontologies of genes containing promoter- or exon-asso-ciated dmCpGs versus intronic- or gene body-assoexon-asso-ciated dmCpGs, both for hyper- and hypomethylated CpGs. These observations imply that different genes, associated to different functions, suffer DNA methylation changes in different regions, which could help explain why DNA methylation changes in different contexts can have differ-ent consequences, and also suggests that the response of the gene elements to epigenetic changes during early life is gene region-specific.
Finally, we compared the DNA methylation changes that occur during the first two lustra of life, finding that the majority of the 5 → 10 changes are in fact a
continuation of the 0 → 5 changes. By looking at the dmCpGs with the most substantial change in both age groups we defined 36 CpG sites with consistent DNA methylation changes during the first 10 years of life. These locations followed one of two trends: (1) strong 0 → 5 changes followed by weak 5 → 10 changes or (2) moderate overall 0 → 5→10 changes. Many of these CpGs were located at genes with important functions, such as development-associated HOXB7 [53], which con-tained 2 CpGs, and the GATA-interacting ZFPM2 [54]. Interestingly, although both these genes are related to developmental functions, the first was found to be hyper-methylated while the second was hypohyper-methylated, and, what is more, the dmCpG associated with ZFPM2 was also mapped to an enhancer element (Fig. 4c). Another zinc finger-family gene which we found to be altered, ZNF385D, has been associated to language impairment and reading disability in children [55]. Although this observation could be related to its function during prena-tal brain development, the fact that the gene-associated dmCpG (cg02920129) shows a similar trend of methyla-tion gain during both the 0 → 5 and 5 → 10 periods of life (Additional file 12: Figure S4) points towards a possible functional relevance throughout early life. It would thus be of interest to further study the link between the meth-ylation status of ZNF385D and language impairment or reading disability. The CD200R1 gene, which encodes for a myeloid- and T-cell distinctive transmembrane recep-tor [56] was found to be linked to an hypomethylated dmCpG (cg07061387), which was subsequently found to be associated with enhancer elements related to up to 3 different genes (ATG3, NEPRO, GCSAM) when the 0 → 5 → 10 dmCpGs were mapped to enhancers in dif-ferent blood tissues, indicating that at least some of the DNA methylation changes found could exert an influence on genes other than the those on which the dmCpGs are located.
Conclusions
Collectively our results show that major epigenetic remodeling takes place during the first 5 years of life. However, despite a dramatic reduction, some genomic loci continue to experience considerable DNA meth-ylation changes during the second lustrum of life. This observation illustrates that there are CpG sites whose change in methylation status could have functional roles beyond early postnatal development. In addition, we show that genes that experience simultaneous hyper- and hypomethylation are functionally distinct from those that are exclusively hyper- or hypomethylated. Finally, we have found that enhancer-associated methylation is dif-ferent in the hyper- and hypomethylation scenario, the latter being more relevant and related to blood-specific enhancer elements, while developmental enhancer ele-ments could already be epigenetically defined at birth, suffering changes of lesser importance during early life.
Additional files
Additional file 1: Table S9. Clinical characteristics of the 18 subjects from the independent cohorts.
Additional file 2: Table S8. Primer sequences for bisulfite sequencing of the validated CpGs.
Additional file 3: Table S1. Lists of annotated 0→5 and 5→10 dmCpGs.
Additional file 4: Table S6. Gene ontology enrichment analysis of 0→5 and 5→10 dmCpGs. Enrichments were calculated from the difference between the dmCpGs obtained in each of the analyses and the GO ontol‑ ogy database by the R/Bioconductor package missMethyl. Ontologies for genes with 1) both hyper‑ and hypomethylated probes 2) exclusively either hyper‑ or hypomethyated and 3) from mapped hyper‑ or hypo‑ methylated dmCpGs which did not take into account CpGs differentially methylated in the opposite direction in the same genes are included. Also included are the ontologies found when analyzing 0→5 dmCpGs grouped by gene region (promoter, exon, intron and gene body). All of the analyses include “molecular function”, “cellular component” and “biological process” terms.
Additional file 5: Figure S1. Boxplots indicating the distribution of abso‑ lute beta values of the DNA methylation changes for 0→5 and 5→10 hyper‑ and hypomethylated dmCpGs. Effect size is measured as median difference and Cliff’s delta.
Additional file 6: Table S2. Blood cell‑type compositions as predicted by the Houseman algorithm for the 33 samples.
Additional file 7: Table S3. Histone mark enrichment analysis of 0→5 and 5→10 dmCpGs. Enrichments were calculated based on differences between the dmCpGs obtained in each of the analyses and the full col‑ lection of Roadmap epigenomics hg19 regions integrated in the LOLA extended software. Corresponding array backgrounds were used for the different comparisons.
Additional file 8: Table S4. Chromatin state enrichment analysis of 0→5 and 5→10 dmCpGs. Enrichments were calculated based on differences between the dmCpGs obtained in each of the analyses and the hg19 chromatin segmentation regions (ChromHMM, 18 states) obtained from Roadmap and ENCODE consortia. A custom LOLA database including information related to the chromatin states in the different tissues/cell
lines and corresponding array backgrounds were used for the correct enrichment calculation.
Additional file 9: Table S5. Enhancer element enrichment analysis of 0→5 and 5→10 dmCpGs. Enrichments were calculated from the dif‑ ference between the dmCpGs obtained in each of the analyses and the enhancer elements obtained from the EnhancerAtlas database. A custom‑ ized LOLA database which included information related to the enhancers in the different tissues/cell lines and corresponding array backgrounds were used for the appropriate enrichment calculation.
Additional file 10: Figure S2. a) Treemap plots indicating the results of REViGO sematic analyses of significantly enriched (FDR < 0.05) gene ontol‑ ogy biological process terms for genes that simultaneously contained 0→5 hyper‑ and hypomethylated dmCpGs. In total, 460 significant terms were found (see Table S6 for full results, including Molecular Function and Cellular Component terms, and also 5→10 dmCpG enrichments). b) Equivalent plots for genes containing, respectively, hyper‑ or hypomethyl‑ ated dmCpGs, irrespective of those same genes also containing dmCpGs that changed in the opposite direction.
Additional file 11: Figure S3. Treemap plots indicating the results of REViGO sematic analyses of significantly enriched (FDR < 0.05) gene ontology biological process terms for genes containing (a) hyper‑ and (b) hypomethylated 0→5 dmCpGs. The dmCpGs are grouped by annotated genomic location (see Table S1, column “annotation”, for the annotations; “promoter” is formed by collapsing “Distal promoter” and “Promoter (<=
1kb)”, “gene body” is formed by collapsing “3’ UTR”, “5’ UTR”, “Intron”, “Exon” and “Downstream”). See Table S6 for full results, including Molecular Func‑ tion and Cellular Component terms.
Additional file 12: Figure S4. Boxplots showing the DNA methylation beta values of the 36 common 0→5→10 dmCpGs described in Table 2.
Additional file 13: Table S7. DNA methylation values obtained by bisulfite sequencing for 3 CpGs across the original 33 subjects (techni‑ cal validation) and two independent longitudinal cohorts (biological validation).
Abbreviations
ATG3: autophagy related 3; BF: breast feeding; BMIQ: beta‑mixture quantile normalization; CD: Cliff’s delta; CS: cesarean section; dmCpGs: differentially methylated CpG; EHM: expected hypergeometric mean; ENCODE: encyclope‑ dia of DNA elements; FDR: false discovery rate; FF: formula feeding; GCSAM: germinal center‑associated signaling and motility protein; HDL: high‑density lipoprotein; HMM: hidden Markov model; HOXB7: homeobox protein Hox‑B7; IDAT: intensity data file; LDL: low‑density lipoprotein; MD: median difference; MDS: multidimensional scaling; NEPRO: nucleolus and neural progenitor protein; NIH: National Institutes of Health; OR: odds ratio; PCA: principal com‑ ponent analysis; PCR: polymerase chain reaction; SGA/AGA/LGA: small/appro‑ priate/large for gestational age; SOCS3: suppressor of cytokine signaling 3; VD: vaginal delivery; ZFPM2: zinc finger protein, FOG family member 2; ZNF385D: zinc finger protein 385D.
Authors’ contributions
RFP, PS, JRT, RGU, AFF and MFF carried out the methylation studies and participated in drafting the manuscript. RFP and JRT performed the statistical analyses. PS and RFP performed the pyrosequencing analyses. EL and MFF conceived of the study and participated in its design and coordination of the manuscript. PR performed critical revision of the manuscript. JA participated in collecting and qualifying mothers and children. All authors read and approved the final manuscript.
Author details
1 Cancer Epigenetics Laboratory, Institute of Oncology of Asturias (IUOPA)‑
Instituto de Investigación Sanitaria del Principado de Asturias (ISPA)‑Hospital Universitario Central de Asturias (HUCA), 33011 Oviedo, Asturias, Spain.
2 Nanomedicine Group, Nanomaterials and Nanotechnology Research
Center (CINN‑CSIC), Universidad de Oviedo, 33940 Oviedo, Asturias, Spain.
3 Servicio de Pediatría, Consorcio Hospital General Universitario de Valen‑
Fisiopatología Obesidad y Nutrición (CB06/03), Instituto de Salud Carlos III, Madrid, Spain.
Acknowledgements
The authors are grateful to the members from the Cancer Epigenetics labora‑ tory (FINBA, ISPA, IUOPA) for their positive feedback, to Ronnie Lendrum for manuscript editing and to Feliciano Jesús Ramos Fuentes.
Competing interests
The authors declare that they have no competing interests.
Availability of data and materials
All data generated during this study are included in this published article and its supplementary information files. The raw IDAT and preprocessed data are also available in the ArrayExpress public repository under accession E‑MTAB‑7069.
Consent to publish
All parents gave informed consent for their children to participate in the study.
Ethics approval and consent to participate
The Committee for the Protection of Human Subjects of the Hospital General approved the study according to the Declaration of Helsinki.
Funding
This work has been financially supported by: Ministerio de Ciencia, Innovación y Universidades (Grant Numbers PI14/01781 and PI11/00144), Instituto de Salud Carlos III and cofinanced by the European Regional Development Fund (to EL); the Plan Nacional de I+D+I 2013–2016/FEDER (PI15/00892 to MFF and AFF); IUOPA‑ISPA‑FINBA (to RGU, RFP and PS); AF Fernández is supported by a Miguel Servet II fellowship (contract CPII16/00007); JR Tejedor is supported by the Ministry of Economy and Competitiveness through a Juan de la Cierva postdoctoral fellowship (FJCI‑2015‑26965); the IUOPA is supported by the Obra Social Cajastur‑Liberbank, Spain.
Publisher’s Note
Springer Nature remains neutral with regard to jurisdictional claims in pub‑ lished maps and institutional affiliations.
Received: 14 December 2018 Accepted: 17 December 2018
References
1. Jones PA. Functions of DNA methylation: islands, start sites, gene bodies and beyond. Nat Rev Genet. 2012;13:484–92.
2. Tang WWC, Kobayashi T, Irie N, Dietmann S, Surani MA. Specification and epigenetic programming of the human germ line. Nat Rev Genet. 2016;17:585–600.
3. Portela A, Esteller M. Epigenetic modifications and human disease. Nat Biotechnol. 2010;28:1057–68.
4. Huidobro C, Fernandez AF, Fraga MF. Aging epigenetics: causes and consequences. Mol Aspects Med. 2013;34:765–81.
5. Atlasi Y, Stunnenberg HG. The interplay of epigenetic marks during stem cell differentiation and development. Nat Rev Genet. 2017;18:643–58. 6. Benayoun BA, Pollina EA, Brunet A. Epigenetic regulation of ageing:
linking environmental inputs to genomic stability. Nat Rev Mol Cell Biol. 2015;16:593–610.
7. Horvath S, Raj K. DNA methylation‑based biomarkers and the epigenetic clock theory of ageing. Nat Rev Genet. 2018;19:371–84.
8. Alisch RS, Barwick BG, Chopra P, Myrick LK, Satten GA, Conneely KN, et al. Age‑associated DNA methylation in pediatric populations. Genome Res. 2012;22:623–32.
9. Martino D, Loke YJ, Gordon L, Ollikainen M, Cruickshank MN, Saffery R, et al. Longitudinal, genome‑scale analysis of DNA methylation in twins from birth to 18 months of age reveals rapid epigenetic change in early life and pair‑specific effects of discordance. Genome Biol. 2013;14:R42. 10. Feil R, Fraga MF. Epigenetics and the environment: emerging patterns
and implications. Nat Rev Genet. 2012;13:97–109.
11. Issa J‑P. Aging and epigenetic drift: a vicious cycle. J Clin Invest. 2014;124:24–9.
12. Tejedor JR, Fraga MF. Interindividual epigenetic variability: Sound or noise? BioEssays News Rev Mol Cell Dev Biol. 2017;39:1700055. 13. Wang D, Liu X, Zhou Y, Xie H, Hong X, Tsai H‑J, et al. Individual variation
and longitudinal pattern of genome‑wide DNA methylation from birth to the first two years of life. Epigenetics. 2012;7:594–605.
14. Cruickshank MN, Oshlack A, Theda C, Davis PG, Martino D, Sheehan P, et al. Analysis of epigenetic changes in survivors of preterm birth reveals the effect of gestational age and evidence for a long term legacy. Genome Med. 2013;5:96.
15. Florath I, Butterbach K, Müller H, Bewerunge‑Hudler M, Brenner H. Cross‑sectional and longitudinal changes in DNA methylation with age: an epigenome‑wide analysis revealing over 60 novel age‑associ‑ ated CpG sites. Hum Mol Genet. 2014;23:1186–201.
16. Urdinguio RG, Torró MI, Bayón GF, Álvarez‑Pitti J, Fernández AF, Redon P, et al. Longitudinal study of DNA methylation during the first 5 years of life. J Transl Med. 2016;14:160.
17. Simpkin AJ, Suderman M, Gaunt TR, Lyttleton O, McArdle WL, Ring SM, et al. Longitudinal analysis of DNA methylation associated with birth weight and gestational age. Hum Mol Genet. 2015;24:3752–63. 18. Martino DJ, Tulic MK, Gordon L, Hodder M, Richman TR, Metcalfe J,
et al. Evidence for age‑related and individual‑specific changes in DNA methylation profile of mononuclear cells during early immune devel‑ opment in humans. Epigenetics. 2011;6:1085–94.
19. Acevedo N, Reinius LE, Vitezic M, Fortino V, Söderhäll C, Honkanen H, et al. Age‑associated DNA methylation changes in immune genes, histone modifiers and chromatin remodeling factors within 5 years after birth in human blood leukocytes. Clin Epigenetics. 2015;7:34. 20. Gutierrez‑Arcelus M, Ongen H, Lappalainen T, Montgomery SB, Buil A,
Yurovsky A, et al. Tissue‑specific effects of genetic and epigenetic vari‑ ation on gene regulation and splicing. PLoS Genet. 2015;11:e1004958. 21. Ballard JL, Novak KK, Driver M. A simplified score for assessment of fetal
maturation of newly born infants. J Pediatr. 1979;95:769–74. 22. Battaglia FC, Lubchenco LO. A practical classification of newborn
infants by weight and gestational age. J Pediatr. 1967;71:159–63. 23. Aryee MJ, Jaffe AE, Corrada‑Bravo H, Ladd‑Acosta C, Feinberg AP,
Hansen KD, et al. Minfi: a flexible and comprehensive Bioconductor package for the analysis of Infinium DNA methylation microarrays. Bioinforma Oxf Engl. 2014;30:1363–9.
24. Pidsley R, Zotenko E, Peters TJ, Lawrence MG, Risbridger GP, Molloy P, et al. Critical evaluation of the Illumina MethylationEPIC BeadChip microarray for whole‑genome DNA methylation profiling. Genome Biol. 2016;17:208.
25. Chen Y, Lemire M, Choufani S, Butcher DT, Grafodatskaya D, Zanke BW, et al. Discovery of cross‑reactive probes and polymorphic CpGs in the Illumina Infinium HumanMethylation450 microarray. Epigenetics. 2013;8:203–9.
26. Triche TJ, Weisenberger DJ, Van Den Berg D, Laird PW, Siegmund KD. Low‑level processing of Illumina infinium DNA methylation BeadAr‑ rays. Nucleic Acids Res. 2013;41:e90.
27. Teschendorff AE, Marabita F, Lechner M, Bartlett T, Tegner J, Gomez‑ Cabrero D, et al. A beta‑mixture quantile normalization method for cor‑ recting probe design bias in Illumina Infinium 450 k DNA methylation data. Bioinforma Oxf Engl. 2013;29:189–96.
28. Morris TJ, Butcher LM, Feber A, Teschendorff AE, Chakravarthy AR, Wojdacz TK, et al. ChAMP: 450k chip analysis methylation pipeline. Bioinforma Oxf Engl. 2014;30:428–30.
29. Du P, Kibbe WA, Lin SM. lumi: a pipeline for processing Illumina micro‑ array. Bioinforma Oxf Engl. 2008;24:1547–8.
30. Xu Z, Niu L, Li L, Taylor JA. ENmix: a novel background correction method for Illumina HumanMethylation450 BeadChip. Nucleic Acids Res. 2016;44:e20.
31. Houseman EA, Accomando WP, Koestler DC, Christensen BC, Marsit CJ, Nelson HH, et al. DNA methylation arrays as surrogate measures of cell mixture distribution. BMC Bioinform. 2012;13:86.
32. Leek JT, Storey JD. Capturing heterogeneity in gene expression studies by surrogate variable analysis. PLoS Genet. 2007;3:1724–35.
•fast, convenient online submission •
thorough peer review by experienced researchers in your field • rapid publication on acceptance
• support for research data, including large and complex data types •
gold Open Access which fosters wider collaboration and increased citations maximum visibility for your research: over 100M website views per year •
At BMC, research is always in progress.
Learn more biomedcentral.com/submissions
Ready to submit your research? Choose BMC and benefit from: 34. Teschendorff AE, Zheng SC. Cell‑type deconvolution in epigenome‑
wide association studies: a review and recommendations. Epigenom‑ ics. 2017;9:757–68.
35. Ritchie ME, Phipson B, Wu D, Hu Y, Law CW, Shi W, et al. limma powers differential expression analyses for RNA‑sequencing and microarray studies. Nucleic Acids Res. 2015;43:e47.
36. Du P, Zhang X, Huang C‑C, Jafari N, Kibbe WA, Hou L, et al. Comparison of Beta‑value and M‑value methods for quantifying methylation levels by microarray analysis. BMC Bioinform. 2010;11:587.
37. Yu G, Wang L‑G, He Q‑Y. ChIPseeker: an R/Bioconductor package for ChIP peak annotation, comparison and visualization. Bioinforma Oxf Engl. 2015;31:2382–3.
38. Sheffield NC, Bock C. LOLA: enrichment analysis for genomic region sets and regulatory elements in R and Bioconductor. Bioinforma Oxf Engl. 2016;32:587–9.
39. Bernstein BE, Stamatoyannopoulos JA, Costello JF, Ren B, Milosavljevic A, Meissner A, et al. The NIH roadmap epigenomics mapping consortium. Nat Biotechnol. 2010;28:1045–8.
40. ENCODE Project Consortium. An integrated encyclopedia of DNA ele‑ ments in the human genome. Nature. 2012;489:57–74.
41. Gao T, He B, Liu S, Zhu H, Tan K, Qian J. EnhancerAtlas: a resource for enhancer annotation and analysis in 105 human cell/tissue types. Bioin‑ forma Oxf Engl. 2016;32:3543–51.
42. Phipson B, Maksimovic J, Oshlack A. missMethyl: an R package for analyz‑ ing data from Illumina’s HumanMethylation450 platform. Bioinforma Oxf Engl. 2016;32:286–8.
43. Supek F, Bošnjak M, Škunca N, Šmuc T. REVIGO summarizes and visualizes long lists of gene ontology terms. PLoS ONE. 2011;6:e21800.
44. Day K, Waite LL, Thalacker‑Mercer A, West A, Bamman MM, Brooks JD, et al. Differential DNA methylation with age displays both common and dynamic features across human tissues that are influenced by CpG landscape. Genome Biol. 2013;14:R102.
45. Yuan T, Jiao Y, de Jong S, Ophoff RA, Beck S, Teschendorff AE. An integra‑ tive multi‑scale analysis of the dynamic DNA methylation landscape in aging. PLoS Genet. 2015;11:e1004996.
46. Fernández AF, Bayón GF, Urdinguio RG, Toraño EG, García MG, Carella A, et al. H3K4me1 marks DNA regions hypomethylated during aging in human stem and differentiated cells. Genome Res. 2015;25:27–40. 47. Pérez RF, Tejedor JR, Bayón GF, Fernández AF, Fraga MF. Distinct chromatin
signatures of DNA hypomethylation in aging and cancer. Aging Cell. 2018;17:e12744.
48. Aran D, Hellman A. DNA methylation of transcriptional enhancers and cancer predisposition. Cell. 2013;154:11–3.
49. Aran D, Sabato S, Hellman A. DNA methylation of distal regulatory sites characterizes dysregulation of cancer genes. Genome Biol. 2013;14:R21. 50. Calo E, Wysocka J. Modification of enhancer chromatin: what, how and
why? Mol Cell. 2013;49:825–37.
51. Duester G. Retinoic acid synthesis and signaling during early organogen‑ esis. Cell. 2008;134:921–31.
52. Collins SJ. The role of retinoids and retinoic acid receptors in normal hematopoiesis. Leukemia. 2002;16:1896–905.
53. Cantile M, Schiavo G, Terracciano L, Cillo C. Homeobox genes in normal and abnormal vasculogenesis. Nutr Metab Cardiovasc Dis NMCD. 2008;18:651–8.
54. Cantor AB, Orkin SH. Coregulation of GATA factors by the Friend of GATA (FOG) family of multitype zinc finger proteins. Semin Cell Dev Biol. 2005;16:117–28.
55. Eicher JD, Powers NR, Miller LL, Akshoomoff N, Amaral DG, Bloss CS, et al. Genome‑wide association study of shared components of reading dis‑ ability and language impairment. Genes Brain Behav. 2013;12:792–801. 56. Vaine CA, Soberman RJ. The CD200‑CD200R1 inhibitory signaling path‑ way: immune regulation and host‑pathogen interactions. Adv Immunol. 2014;121:191–211.