White Rose Research Online URL for this paper:
http://eprints.whiterose.ac.uk/1828/
Article:
Grace, D. orcid.org/0000-0003-4493-7498, Chen, G.H., White, G.P. et al. (2 more authors)
(2005) Improving the system capacity of broadband services using multiple high-altitude
platforms. IEEE Transactions on Wireless Communications. pp. 700-709. ISSN 1536-1276
https://doi.org/10.1109/TWC.2004.842972
[email protected] https://eprints.whiterose.ac.uk/ Reuse
Items deposited in White Rose Research Online are protected by copyright, with all rights reserved unless indicated otherwise. They may be downloaded and/or printed for private study, or other acts as permitted by national copyright laws. The publisher or other rights holders may allow further reproduction and re-use of the full text version. This is indicated by the licence information on the White Rose Research Online record for the item.
Takedown
If you consider content in White Rose Research Online to be in breach of UK law, please notify us by
Improving the System Capacity of Broadband
Services Using Multiple High-Altitude Platforms
David Grace
, Member, IEEE
, John Thornton, Guanhua Chen, George P. White, and Tim C. Tozer
, Member, IEEE
Abstract—A method of significantly improving the capacity of high-altitude platform (HAP) communications networks oper-ating in the millimeter-wave bands is presented. It is shown how constellations of HAPs can share a common frequency allocation by exploiting the directionality of the user antenna. The system capacity of such constellations is critically affected by the min-imum angular separation of the HAPs and the sidelobe level of the user antenna. For typical antenna beamwidths of approximately 5 an inter-HAP spacing of 4 km is sufficient to deliver optimium performance. The aggregate bandwidth efficiency is evaluated, both theoretically using the Shannon equation, and using practical modulation and coding schemes, for multiple HAP configurations delivering either single or multiple cells. For the user antenna beamwidths used, it is shown that capacity increases are com-mensurate with the increase in the number of platforms, up to 10 HAPs. For increases beyond this the choice of constellation strategy becomes increasingly important.
Index Terms—Antennas, broadband communication, high-alti-tude platforms (HAPs), interference management, stratospheric platforms, wireless communication.
I. INTRODUCTION
W
ITH AN EVER increasing demand for capacity for future generation multimedia applications, service providers are looking to utilize the frequency allocations in the millimeter wave bands [1]. In these frequency bands, line-of-sight paths are required and signals are strongly attenu-ated by rain [2], [3]. A possible solution is to use high-altitude platforms (HAPs), which are either airships or planes that will operate in the stratosphere, 17–22 km above the ground [4]–[12]. This unique position offers a significant link budget advantage compared with satellites and a much wider area of coverage than terrestrial. HAPs can also accommodate longer link lengths with less rain attenuation than would be associated with similar terrestrial links. Such platforms will have a rapid roll-out capability and the ability to serve a large number of users, using considerably less communications infrastructure than required by a terrestrial network [1]. To aid the eventual deployment of HAPs the ITU has recently allocated spectrum around 48 GHz worldwide [13] and 31/28 GHz for certainManuscript received July 17, 2003; revised December 23, 2003, January 22, 2004; accepted January 28, 2004. The editor coordinating the review of this paper and approving it for publication is V. K. Bhargava. This work was sup-ported in part by the European FP5 HeliNet Project (IST-1999-11214), in part by the European FP6 Capanina Project (FP6-IST-2003-506745), and in part by the British National Space Centre, as part of the third round of the S@tcom pro-gram (CPBM/C/001/00021).
The authors are with the Communications Research Group, Depart-ment of Electronics, University of York, York YO10 5DD, U.K. (e-mail: [email protected]).
Digital Object Identifier 10.1109/TWC.2004.842972
Asian countries [14], with spectrum in the 3G bands also allocated for use with HAPs [15]. There is now an emerging body of work on communications delivery from HAPs both for eventual 3G deployments, e.g., [16]–[20], as well as for com-munications deployed in the millimeter-wave bands. Spectrum sharing studies have been carried out e.g., [14], since all of these bands will be used by, or adjacent to, other services.
Efficient spectrum reuse will be required to ensure that such deployments can deliver high spectral efficiencies. Cellular so-lutions have been examined in [21], [22], specifically addressing the antenna beam characteristics required to produce an efficient cellular structure on the ground, and the effect of antenna side-lobe levels on channel reuse plans [22]. HAPs will have rela-tively loose station-keeping characteristics compared with satel-lites, and the effects of platform drift on a cellular structure and the resulting intercell handover requirements have been inves-tigated [23]. Cellular resource management strategies have also been developed for HAP use [24]. Cells can be regularly spaced, as their area and location are substantially unaffected by geog-raphy and terrain, and since they all originate from the same HAP this centralization can be additionally exploited by the re-source management strategy.
While it is generally acknowledged that HAPs could offer a higher spectrally efficiency than GEO satellites, some scepti-cism remains over whether HAPs can approach the spectral ef-ficiency of terrestrially based broadband communications. This is based on the assumption that a cellular approach is used with the minimum cell size being limited by the maximum size of the antenna payload that can be accommodated on the HAP. This paper will illustrate that it is possible to exploit one feature that has been largely overlooked, the fact that user antennas may also be highly directive. This allows spatial discrimination between multiple HAPs located in different parts of the sky, thereby per-mitting them to share common spectrum. This additional band-width reuse, and resulting capacity gain, is dependent on several factors, in particular the number of platforms and the user an-tenna sidelobe levels. A multiple HAP configuration also pro-vides for incremental roll-out: initially only one HAP needs to be deployed, with all user antennas pointing to the single HAP. As more capacity is required, further HAPs can be brought into service, with new users served by the newly deployed HAPs.
This paper quantifies the potential gains in capacity that var-ious HAP constellations can deliver, both theoretically using the Shannon equation and also while operating a number of prac-tical modulation and coding schemes. The paper is organized as follows. In Section II, the multiple HAP scenario and possible constellations are described. We then illustrate the fundamental reuse behavior for a single beam (cell) case, explaining how it is
possible to increase the capacity. In Section III, the potential per-formance gains are then quantified for multiple platforms each having a single cell occupying the whole coverage area. This is then extended in Section IV to a multibeam (cellular) layout from each platform, and again the increases in capacity resulting from multiple platform configurations are illustrated. Conclu-sions are presented in Section V.
II. MULTIPLEPLATFORMSCENARIO
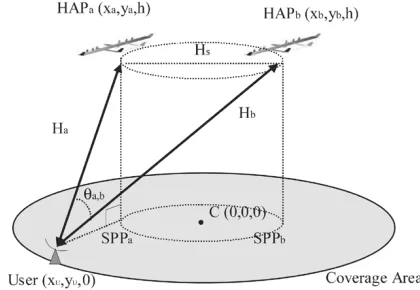
The main purpose of increasing the number of platforms serving a common coverage area is to increase the capacity provided per unit area (i.e., the bandwidth efficiency). Nor-mally, the coverage area is split into multiple cells to increase the capacity. This technique can also be adopted with a mul-tiple platform scenario, but for the first part of this analysis we restrict ourselves to an analysis with one beam (cell) per HAP serving the whole coverage area. Multiple HAPs can in-crease the capacity by exploiting the directionality of the fixed user antenna which is typically a dish with relatively narrow beamwidth. This narrow beamwidth is required to provide suf-ficient gain to support the link budget, but additionally, it can be used to reduce levels of interference from other HAPs arranged at an angle away from the boresight of the user antenna. It is assumed that the boresight of the user antenna will always point directly at the HAP with which it is communicating (henceforth called the “main” HAP). A scenario showing the user, main HAP and one interfering HAP is shown in Fig. 1, with all HAPs being equally spaced around a circle. In this scenario, we also assume the station keeping of the HAPs is perfect and the antenna payload is fully stabilized.
To determine the improvement in capacity it is necessary to calculate the downlink carrier-to-interference-plus-noise ratio (CINR) caused by one or more of the interfering HAPs.
In the following expressions, we denote the main HAP by the subscript , which is one of a system of HAPs. The remaining HAPs are designated the interfering HAPs (i.e., the set ). Thus, the at an arbitrary point
on the coverage area can be calculated as
(1)
where is the transmission factor taking into account the link length, transmitter power, etc., from one of the set of inter-fering HAPs. Losses are assumed to increase with the square of the link length [8], as propagation is line-of-sight at these fre-quencies; is the thermal noise floor; and is the gain of the corresponding HAP antenna at an angle away from boresight, with the boresight of the HAP antennas pointing at the center of coverage point “C.”
Again, with reference to Fig. 1, the link length from the user to an arbitrary HAP, e.g., , can be expressed as
[image:3.594.319.529.65.210.2](2)
Fig. 1. Multiple HAP scenario.
The angle between any two any two HAPs, e.g., and , as seen by the user can be expressed as
(3)
where is the diameter of the circle on which the HAPs are situated and and are the HAP-user distances for and , respectively.
is the gain of the user antenna at angle away from boresight. Here, the user antenna radiation pattern is mod-eled by the following [22]:
(4)
where is the boresight gain of the antenna, is a notionally flat sidelobe floor, and controls the rate of power rolloff of the main lobe. This expression presents a mathematically con-venient way of describing the main and side lobes. It is assumed that the boresight of the user antenna is pointed toward the main HAP, with used to calculate the level of interference re-duction for an interfering HAP at an angle to boresight (as shown in Fig. 1).
A. HAP Constellations
Two HAP constellation strategies are used in this paper. The first assumes deployment on a circle whose radius is fixed irre-spective of the number of platforms [“fixed radius” (FR)]. The HAP locations are best expressed in terms of cylindrical polar coordinates, all situated within the horizontal plane containing the point , i.e.,
(5)
where is the set of HAPs, is the spacing radius, is the angle subtended by , and the initial line .
The second strategy assumes a fixed arc (FA) length, such that the spacing radius increases with the number of platforms, i.e.,
where is the fixed arc length. This method should help to en-sure that the typical angular separation of HAPs as seen by each user does not become too small, albeit at the expense of poten-tially increasing the average link length, when the number of platforms is large.
B. Sidelobe Floor Beamwidth
Another useful measure is the sidelobe floor beamwidth , defined as the width of the main lobe at the points at which it terminates and the flat sidelobe floor begins. This will be used later along with the minimum angular separation (dis-cussed later) to highlight areas that are subject to interference within the main lobe of the user antenna. The sidelobe floor beamwidth can be derived by simple algebraic manipulation from (4). First, it is useful to determine in terms of the antenna 3 dB beamwidth dB :
dB (7)
where dB is the 3-dB beamwidth of the user antenna (in ra-dians)
(8)
where , i.e., the sidelobe floor expressed in decibels. Substituting for from (7) and inserting into (8) yields
(9)
In this simple single cell analysis, all the HAP antennas are modeled as being omnidirectional. Thus, power flux density in this simple model is a function of link length only. The transmit power from all users and HAPs are assumed to be identical.
C. Minimum Angular Separation and Link Length Ratio
The following two factors affect performance considerably: 1) the minimum angular separation as seen by a user at
of the main HAP and interfering HAPs, de-fined as:
(10)
2) the minimum link length ratio of the interferers and main HAP as seen by a user at , defined as
(11)
An example coverage plot of these constraints for four HAPs, each situated at a height of 17 km and on a 10-km spacing ra-dius, has been generated assuming that a “test” user is situated at each point in the plot (the boresight of the antenna of a test user will point directly at the main HAP) are shown in Fig. 2. Fig. 2(a) shows that the minimum angular separation tends to decrease away from the center of the coverage area, and is best just to the left of the main HAP. Within the coverage area, as-sumed to be of 30-km radius, the minimum angular separation
remains above 14 . This means that for the inner part of the cov-erage area the interference will be entering in the side lobes of the user antenna or at least well down the main lobe, for most practical user antenna beamwidths. Hence, good interference re-jection will result. Fig. 2(b) illustrates that there is a triangular region containing the main HAP to the right of coverage area where the link length ratio is above 1, indicating that worst case interfering HAP has a longer link than the main HAP. This pro-vides a further slight reduction to the interference level expe-rienced by users in this region. The converse is true elsewhere, the worst area being to the left of the coverage area, furthest way from the main HAP and closest to one of the interfering HAPs. For the interference limited case, the corresponding coverage plot of the CIR received by a user with an antenna beamwidth of 17 has been generated using (1), and this is shown in Fig. 2(c). The better minimum angular separation and link length ratio combine to deliver higher CIR to the right of the main HAP, with the expected poorer performance seen on the left. With this user antenna, the region inside the 26 con-tour (half the sidelobe floor beamwidth, as angular separation is calculated from boresight outwards) in Fig. 2(a) is subject only to sidelobe interference, with the region outside being subject to mainlobe interference. The region outside the coverage area has particularly low CIR due the poor interference rejection pro-vided by the reduced angular separation. In this region, interfer-ence is received well within the main lobe where it is subject to much less attenuation. Clearly, performance would be better if an antenna was selected for a region of interest with a sidelobe floor beamwidth much less than half the minimum angular sep-aration, but that is beyond the scope of this paper. In addition, commercially it is probably better to have a single user antenna type, allowing greater economies of scale and a common instal-lation strategy.
III. SINGLE-CELLPERFORMANCE
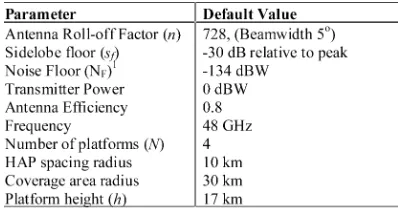
The performance of the single cell, multiple HAP scenario has been assessed for different numbers of HAPs, different HAP constellation strategies, and user antennas with a range of direc-tionalities. The default parameter values used in the assessments are listed in Table I.
A. Capacity Determination Using the Shannon Equation
To assess the performance, the distribution of the CINR has been determined across the circular coverage area. The CINR at each point relating to each HAP has then been con-verted into bandwidth efficiency using the Shannon equation given by1[1]
(12)
The aggregate bandwidth efficiency available across the coverage area is derived from the summation of that offered by each HAP. That is, for each ground position there
Fig. 2. For a configuration of four HAPs (one main HAP “o,” three interfering HAPs “x”). (a) Minimum angular separation (degrees) between the main HAP and interfering HAPs. (b) Minimum link length ratio of interfering HAPs to main HAP. (c) Downlink CIR, user antenna beamwidth 17 , contour labels: CIR (dB).
TABLE I
DEFAULTPARAMETERVALUESUSED TOASSESSPERFORMANCE
are “test” users, whose antenna points directly at a different HAP. The links from each “test” user to their respective HAP will support a specific bandwidth efficiency, and these values
are summed to yield the aggregate bandwidth efficiency for each ground position. That is
(13)
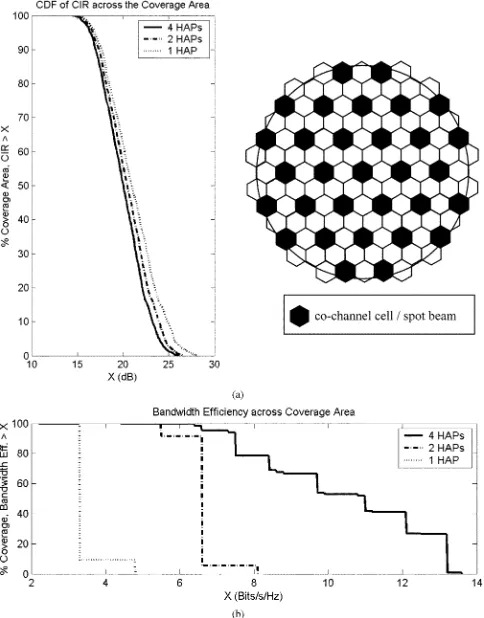
Fig. 3. CDFs of CIR and combined bandwidth efficiency across the coverage area for configurations of two, three, and four HAPs.
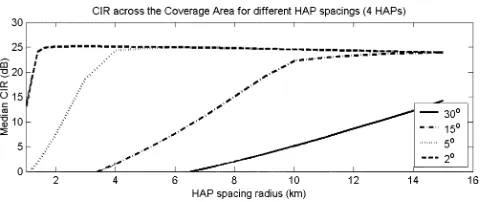
Fig. 4. CIR for different HAP spacing radii and user antenna beamwidths of 30 (n = 20), 15 (n = 80), 5 (n = 730), and 2 (n = 4550).
in a reduction in the rate of increase in bandwidth efficiency, compared with the increase in the number of HAPs.
Fig. 4 shows the effect on median CIR across the coverage area for a range of HAP spacing radii and several user antenna beamwidths, for a configuration of four HAPs (bandwidth ef-ficiency would follow the same trends). The results show that nothing is to be gained by increasing the HAP spacing once in-terference from the other HAPs is received within the sidelobes of the user antenna (the almost flat part of the graphs). In addi-tion, from a link budget perspective it is actually better to keep links as short as possible so it will always be beneficial to use the minimum HAP spacing radius that yields good bandwidth efficiency.
The limit on the value of median CIR is governed by the level of the sidelobes of the user antenna, which in this case are at 30 dB below peak gain. The results of Fig. 3(a) show that the CIR remains sufficiently high to support high rate modulation schemes such as 64QAM which require an signal-to-noise ratio (SNR) of at least 25.5 dB for a bit-error rate of 10 , as will be discussed in more detail in Section III-B. Hence, there is little to be gained from a further reduction in the user antenna sidelobes, and in practice links will also become noise limited. Dealing with specific results: with a user antenna of beamwidth 30 the median CIR limit is never reached for any practical HAP spacing radius, so clearly this beamwidth is too wide for this application. A practical beamwidth would be between 2 –15 ,
TABLE II
MODULATION ANDCODINGFIGURESUSED TODETERMINECAPACITY
making the minimum “ideal” HAP spacing radius between 2–11 km for a system of up to 4 HAPs.
B. Capacity Determination Using Modulation and Coding Schemes
The Shannon equation is an idealized method of determining the bandwidth efficiency that is very useful for determining rel-ative performance and general behavior, but to assess the per-formance more realistically we use four modulation and coding schemes as shown in Table II. These have been evaluated as-suming a bit-error rate of 10 , and a Reed Solomon/convolu-tional concatenated code. The Reed Solomon code is a (204 188) shortened code and the convolutional code is rate 3/4, constraint length 7, giving a resulting combined code rate of 0.6912. All Eb/No values take into account transmission over a predistorted 28-GHz solid-state power amplifier [25].
In a real system, the CINR would be time varying (e.g., when subject to rain attenuation) so such schemes would form part of an adaptive modulation and coding strategy, where the highest rate modulation and coding scheme is selected that can operate adequately at the CINR available to the user or HAP at the time. A typical protocol that uses such a strategy is IEEE 802.16 [26]. The effects of the noise floor have been included to provide a more realistic assessment of actual capacity. The SNR values shown have been determined assuming that the noise plus in-terference is Gaussian, and the CINR is equivalent to the SNR. This is a worst-case approximation, as interference character-istics are deterministic and so could be mitigated using appro-priate signal processing techniques.
The distribution of the CINR has been determined across the circular coverage area. Now, the CINR at each point
relating to each HAP has been converted into bandwidth effi-ciency using the modulation and coding schemes, with the scheme selected such that it delivers the highest rate commen-surate with the received CINR.
Again, the aggregate bandwidth efficiency is determined from a summation of the bandwidth efficiency of all the individual HAPs serving the coverage area.
Fig. 5. Contour plot of aggregate bandwidth efficiencies over the coverage area for a configuration of 16 HAPs (FR Spacing), using discrete modulation and coding schemes and a user antenna of 2 (a) noise limited (b) interference limited [HAPs “o,” contour labels: BW efficiency (bit/second/hertz)].
are selected. This is largely due to the fact that the longer length links will be noise limited, the 2 user antenna beamwidth en-sures that these locations are not particularly affected by the re-duced angular separation for this specific scenario. The inter-ference-limited case is shown in Fig. 5(b) for comparison. In this case, the highest modulation and coding combination can be used by all users in the coverage area, hence accounting for the constant bandwidth efficiency.
Fig. 6 examines the aggregate bandwidth statistics in more detail, illustrating the effects of increasing the number of plat-forms, in this case from 8 to 20, while also showing the
[image:7.594.304.550.65.163.2]ef-Fig. 6. CDFs of bandwidth efficiency for 8- and 20-HAP configurations for two constellation strategies.
Fig. 7. Median capacity for different numbers of HAPs, with different user antenna beamwidths and constellation strategies.
fects of different constellation strategies. The steps shown in the cdf are a result of the discrete choices of modulation and coding schemes available. Performance based on the Shannon equation, shown earlier, allowed a continuous mapping between bandwidth efficiency and CINR. As expected, increasing the number of platforms results in higher aggregate bandwidth ef-ficiency, but the increase is not linear, caused by the overall in-crease in interference levels. In both the 8- and 20-HAP cases, it is shown that the constellation strategy has limited effect for a small number of locations where there are high bandwidth efficiencies. These cases occur immediately below the HAPs, where there is already sufficient angular separation. In the case where there are poorer bandwidth efficiencies there is a more marked difference in performance, and the best scheme depends on the number of HAPs in the constellation. The FR scheme is best in the 8 HAP case, predominantly because the azimuthal spacing is better (the arc length is greater than 3 km), and the link length variation is more uniform. In the 20-HAP case with a fixed spacing radius of 10 km the FR scheme will deliver spacing below 3 km; in this case, the constant arc length (FA scheme) is needed to ensure sufficient azimuthal separation, and performance is better despite the resulting larger spacing radius causing a greater link length variation.
[image:7.594.305.549.201.302.2]an important part in overall performance. Thus, a narrower beamwidth user antenna is increasingly beneficial as more HAPs are added to the constellation. In terms of the pro-rata increase (relative to one HAP), all configurations increase by the same amount up to 10 HAPs indicating that the increase is constrained by the extra sidelobe interference. Beyond this, the constellation strategy becomes a significant mechanism for ensuring that main lobe interference is minimized. The FR scheme with wide user antenna beamwidth performs particu-larly poorly. In these scenarios, it may be particuparticu-larly useful to develop constellations where HAPs are arranged on more than one spacing radius.
It is also useful to determine the joint CINR statistics for the same 16 HAP configuration. These statistics can be used to in-dicate the overall quality of CINR across the coverage area, and are particularly useful if users can select the most suitable HAP. To aid the subsequent analysis it is useful to define a set T of “test” users that are located at arbitrary points within the coverage area. It then follows that the set of elements that have CINR at or above a threshold from HAP can be expressed as
(14)
The sets can be matrix summed to give a new set which contains elements that record the number of platforms that can serve each arbitrary points at or above , i.e.,
(15)
A new set of elements can be defined as the set of loca-tions served by at least out of the set of HAPs
(16)
So the probability that at an arbitrary location within the coverage area that has a CINR at least dB and can be served by at least out of HAPs is
(17)
where the vertical bars mean the number of elements in the set. For the 16-HAP case, Fig. 8 shows for instance that a min-imum of 14.2-dB CINR is available from all platforms across the whole of the coverage area—the “All 16” line . If the user is free to select the HAP with best CINR then a min-imum CINR of 18 dB is available across the coverage area—the “At least 1” line . Statistics are presented for other diver-sity options, for instance when there is a more limited choice of platform selection e.g., the “Any 5” and “Any 10” lines. Finally, the “Each HAP” line illustrates the cases studied in previous figures when the user cannot choose the HAP (the individual CINR statistics), in this scenario the performance variation is much wider as it is neither the best or worst case.
IV. MULTIPLECELLPERFORMANCE
The analysis can be extended to platforms which each serve multiple cells by use of spot beam antennas. By way of ex-ample, we have extended the method of [22], [23], which
de-Fig. 8. CINR cdfs for a 16-HAP constellation as in Fig. 5 showing overall CINR for different combinations of HAPs within the constellation.
rive power and CINR for each beam in a 121-cell network. In this paper, we use the 121-cell network and the technique of choosing spot-beam antenna beamwidths which optimally illu-minate each cell [22], but we have modified the technique to allow the HAP to be offset from the center of the coverage area. The three interfering HAPs illuminate the same cells with the same channel (a pessimistic case), and it is apparent that each of these interfering multibeam footprints can be d
The CINR at each ground position is then derived from the ratio of required power from the “main” HAP spot beam to the sum of all the interfering powers. These include the other cochannel antennas on the “main” HAP, and the sum of the cochannel antenna powers on the other HAPs scaled by the pointing loss of the customer antenna (4). Hence, the expres-sion derived in (1) must be modified to take account of the extra sources of interference, so for an arbitrary point the CINR is:
CINR
(18)
where is the received power contribution from the main HAP in the cell of interest. are interference power contri-butions from cells on the same channel on the main HAP. are the interference power contributions from all cells sharing a common channel on interfering HAPs. This expres-sion takes into account path loss, transmit power and antenna gain of each beam, and the relevant angles determine the indi-vidual power contributions. The multiple beams on each HAP point to the center of each cell which are arranged on a uniform hexagonal grid. Just as in several previous examples it is as-sumed that the multibeam scenario is interference limited, due to the number of beams and the fact that the antennas on the HAP are highly directional and hence have a high gain, i.e.,
[image:8.594.307.550.64.266.2]Fig. 9. CIR plot of one channel of four for a 4-HAP configuration [one main HAP “o,” three interfering HAPs “x,” contour labels: CIR (decibels)].
Fig. 9 plots CIR contours from (18) for a four HAP scenario, for a single channel in a four-channel reuse plan. The customer antenna beamwidth has been fixed at 5 and has a 30 dB sidelobe level. The HAP spot-beam antennas which illuminate the cells are all modeled after [10], each with a 40 dB (from peak) sidelobe level, and hence the footprint of each individual cell is computed. In Fig. 9, it is apparent that the cells with highest CIR are on the left hand side of the plot, i.e., at a greater distance from the “main” HAP than those cells on the right, despite the proximity here of the three interfering HAPs. This effect is consistent with the findings of [8] and [22] where, for the single-HAP 121-cell case, the more distant cells experienced greater CIR due to them being served by more directional spot-beams than for those cells just below the HAP. This effect is little modified by the addition of three additional HAPs because they contribute interference via the user antenna sidelobe only.
We also present a comparison of the one-, two-, and four-HAP schemes in terms of CIR in Fig. 10(a). These illustrate that CIR is little affected by the additional HAPs sharing common spec-trum, ensuring that the bandwidth efficiency increases almost in line with the number of HAPs. The range of CIR is dominated by the cellular structure rather than as a result of interference from the extra HAPs. The 14-dB CIR corresponds to the edge of a cell with up to 27 dB occurring at the cell centers.
The aggregate bandwidth efficiency variation has again been determined using the modulation and coding schemes in Table II, and this is shown in Fig. 10(b) for each configuration. This follows the range in CIR, with the large differences in performance being a result of the extra capacity provided by the additional HAPs, similar to the single cell case.
V. CONCLUSION
In addition to HAPs providing a rapid roll-out capability for new services, we have shown that incrementally deploying
fur-Fig. 10. CDF comparing systems of one, two, and four HAPs using an FR constellation. (a) CIR. (b) Bandwidth efficiency (inset: the cellular plan).
ther HAPs operating in the same allocated spectrum will provide significant increases to capacity, allowing future customers to be supported. An evaluation methodology has been developed, consisting of: minimum angular separation of HAPs as seen by the user, link length ratio, and sidelobe floor beamwidth. These have been used to help explain the CINR behavior of multi-HAP constellations. We have shown that for a 5 beamwidth user an-tenna, the optimum HAP spacing radius is approximately 4 km. Using a single cell per HAP scenario as an example, we have shown that constellations of up to 8 HAPs could be deployed yielding an almost pro-rata increase in capacity for user antenna bandwidths of up to 5 . For larger HAP constellations, the con-stellation strategy and user antenna beamwidth become increas-ingly important as these govern the overall interference reduc-tion capabilities. We have shown an example where a 20-HAP deployment, located on a single spacing radius with constant arc length (3 km) and 2 user antenna works well. Similar increases in capacity can be seen with multiple HAP deployments when each HAP supports multiple cells, but in these cases it is the in-tercell interference from the users’ HAP which dominates the overall interference seen by the user.
REFERENCES
[1] D. Grace, N. E. Daly, T. C. Tozer, A. G. Burr, and D. A. J. Pearce, “Pro-viding multimedia communications from high altitude platforms,” In-tern. J. Sat. Commun., vol. 19, no. 6, pp. 559–580, Nov. 2001. [2] T. Konefal, C. Spillard, and D. Grace, “Site diversity for high altitude
[3] C. L. Spillard, D. Grace, J. Thornton, and T. C. Tozer, “Effect of ground station antenna beamwidth on rain scatter interference in high-altitude platform links,”Electron. Lett., vol. 38, no. 20, pp. 1211–1213, Sep. 2002.
[4] R. Steele, “Guest editorial-An update on personal communications,”
IEEE Commun. Mag., vol. 30, no. 12, pp. 30–31, Dec. 1992. [5] G. M. Djuknic, J. Freidenfelds, and Y. Okunev, “Establishing wireless
communications services via high-altitude aeronautical platforms: A concept whose time has come?,”IEEE Commun. Mag., vol. 35, no. 9, pp. 128–135, Sep. 1997.
[6] N. J. Collela, J. N. Martin, and I. F. Akyildiz, “The HALO network,”
IEEE Commun. Mag., vol. 38, no. 6, pp. 142–148, June 2000. [7] T. C. Tozer and D. Grace, “High-altitude platforms for wireless
commu-nications,”IEE Electron. Commun. Eng. J., vol. 13, no. 3, pp. 127–137, June 2001.
[8] J. Thornton, D. Grace, C. Spillard, T. Konefal, and T. C. Tozer, “Broad-band communications from a high altitude platform—The European He-linet Programme,”IEE Electron. Commun. Eng. J., vol. 13, no. 3, pp. 138–144, June 2001.
[9] R. Miura and M. Oodo, “Wireless communications system using strato-spheric platforms,”J. Commun. Res. Lab., vol. 48, no. 4, pp. 33–48, 2001.
[10] J.-M. Park, B.-J. Ku, Y.-S. Kim, and D.-S. Ahn, “Technology develop-ment for wireless communications system using stratospheric platform in Korea,” inProc. IEEE Int. Symp. Personal, Indoor, Mobile Radio Communications, vol. 4, Sep. 2002, pp. 1577–1581.
[11] C. Oestges and D. Vanhoenacker-Janvier,IEE-Proc.: Microw., Antennas Propag., vol. 148, no. 1, pp. 45–49, Feb. 2001.
[12] D. Grace, J. Thornton, T. Konefal, C. Spillard, and T. C. Tozer, “Broad-band communications from high altitude platforms—The HeliNet so-lution,” inProc. Wireless Personal Mobile Conf., vol. 1, Aalborg, Den-mark, Sep. 2001, pp. 75–80.
[13] “Preferred characteristics of systems in the fixed service using high-al-titude platform stations operating in the bands 47.2–47.5 GHz and 47.9–48.2 GHz,” Int. Telecommunications Union, Recommendation ITU-R F.1500, 2000.
[14] M. Oodo, R. Miura, T. Hori, T. Morisaki, K. Kashiki, and M. Suzuki, “Sharing and compatibility study between fixed service using high alti-tude platform stations (HAPs) and other services in 31/28 Ghz bands,”
Wireless Personal Commun., vol. 23, pp. 3–14, 2002.
[15] “Minimum performance characteristics and operational conditions for high altitude platform stations providing IMT-2000 in the Bands 1885–1980 MHz, 2010–2025 MHz and 2110–2170 MHz in the Regions 1 and 3 and 1885–1980 MHz and 2110–2160 MHz in Region 2,” Int. Telecommunications Union, Recommendation ITU-R M.1456, 2000. [16] F. Dovis, R. Fantini, M. Mondin, and P. Savi, “Small-scale fading for
high-altitude platform (HAP) propagation channels,”IEEE J. Sel. Areas Commun., vol. 20, no. 3, pp. 641–647, Apr. 2002.
[17] Y. C. Foo, W. L. Lim, and R. Tafazolli, “Performance of high altitude platform station (HAPS) in delivery of IMT-2000 W-CDMA,” inProc. Stratospheric Platform Systems Workshop, Tokyo, Japan, Sep. 2000. [18] E. Falletti, M. Mondin, F. Dovis, and D. Grace, “Integration of a HAP
within a terrestrial UMTS network: Interference analysis and cell dimen-sioning,”Int. J. Wireless Personal Commun.—Special Issue on Broad-band Mobile Terrestrial-Satellite Integrated Systems, vol. 24, no. 2, pp. 291–325, Feb. 2003.
[19] S. Masumura and M. Nakagawa, “Joint system of terrestrial and high al-titude platform stations (HAPS) cellular for W-CDMA mobile commu-nications,”IEICE Trans. Commun., vol. E85-B, no. 10, pp. 2051–2058, Oct. 2002.
[20] M. A. Vazquez-Castro, D. Belay-Zelek, and A. Curieses-Guerrero, “Availability of systems based on satellites with spatial diversity and HAPS,”Electron. Lett., vol. 38, no. 6, pp. 286–287, Mar. 2002. [21] B. El-Jabu and R. Steele, “Cellular communications using aerial
plat-forms,”IEEE Trans. Veh. Technol., vol. 50, no. 3, pp. 686–700, May 2001.
[22] J. Thornton, D. Grace, M. H. Capstick, and T. C. Tozer, “Optimizing an array of antennas for cellular coverage from a high altitude platform,”
IEEE Trans. Wireless Commun., vol. 2, no. 3, pp. 484–492, May 2003. [23] J. Thornton and D. Grace, “Effect of lateral displacement of a high
alti-tude platform on cellular interference and handover,”IEEE Trans. Wire-less Commun., to be published.
[24] D. Grace, C. Spillard, J. Thornton, and T. C. Tozer, “Channel assignment strategies for a high altitude platform spot-beam architecture,” inProc. IEEE Int. Symp. Personal, Indoor, Mobile Radio Communications, vol. 4, Sep. 2002, pp. 1586–1590.
[25] G. P. White, A. G. Burr, and T. Javornik, “Modeling of nonlinear dis-tortion in broadband fixed wireless access systems,”IEE Electron. Lett., vol. 39, no. 8, pp. 686–687, Apr. 2003.
[26] IEEE 802.16 Standard, Part 16: Air Interface for Fixed Broadband Wire-less Access Systems, IEEE Std 802.16-2001, Dec. 2001.
David Grace (S’95–A’99–M’00) received the M.Eng. degree in electronic systems engineering and the D.Phil. degree from the University of York, York, U.K. in 1993 and 1999, respectively. His D. Phil. thesis dealt with “Distributed Dynamic Channel Assignment for the Wireless Environment.”
Since 1994, he has been a member of the Commu-nications Research Group at the University of York, where he is now a Senior Research Fellow. He has worked on a variety of research contracts including several from the former Defense Evaluation and Re-search Agency. He is now Pricincipal Scientific Officer for CAPANINA, a major European Framework 6 project that is developing broadband communications from high-altitude platforms. He has been an Invited Speaker at several confer-ences and industrial locations in the fields of HAP systems. He is also a nom-inated Researcher in the European NEWCOM Network of Excellence, and a Director of SkyLARC Technologies Ltd., a York-based company, specializing in broadband communications from aerial platforms. His current research inter-ests include radio resource management for broadband communications, partic-ularly from high-altitude platform and terrestrial ad hoc networks.
John Thorntonreceived the M.Sc. degree in mi-crowave physics from the University of Portsmouth, Portsmouth, U.K., in 1995 and the Ph.D. degree in microwave engineering from Open University, U.K., in 2002.
He has previously held research positions in the U.K. at the Rutherford Appleton Laboratory, developing submillimeter wave solid state sources for space applications, and thereafter in the Depart-ment of Engineering Science, University of Oxford, Oxford, U.K., working on a number of diverse communications projects which included passive radar transponders, adaptive antennas, and superconducting filters for broadcast and cellular applications. In 2000, he returned to the University of York, York, U.K., to join the Department of Electronics and maintains research interests in antennas, self-phasing arrays, microwave techniques, and broadband applications.
Guanhua Chenreceived the B.Sc. degree from the Department of Electronic Science and Engineering, Nanjing University, China, in 1997. He is currently working toward the Ph.D. degree in the Department of Electronics, the University of York, York, U.K.
George P. White received the B.Sc. degree in electronics from Warwick University, Coventry, U.K., in 1990, the M.Sc. degree in digital signal processing in communications from the University of Lancaster, Lancaster, U.K., in 1995, and the Ph.D. degree from the University of York, York, U.K., in 2001. His thesis was entitled “Optimized Turbo Codes for Wireless Channels.”
He is currently a Research Associate with the Communications Research Group, University of York. He spent three years working on the broadband communications section of the Helinet high altitude platform project (EU 5th Framework), in the fields of systems level design, amplifier linearization and coding and modulation. He is currently working on MIMO equalization schemes for multisPtandard wireless receivers under the FLOWS project.
Tim C. Tozer (M’81) received the degree in engineering from the University of Cambridge, Cambridge, U.K., in 1969.
![Fig. 5.Contour plot of aggregate bandwidth efficiencies over the coveragearea for a configuration of 16 HAPs (FR Spacing), using discrete modulationand coding schemes and a user antenna of 2(a) noise limited (b) interferencelimited [HAPs “o,” contour labels: BW efficiency (bit/second/hertz)].](https://thumb-us.123doks.com/thumbv2/123dok_us/8087635.230575/7.594.48.280.58.558/aggregate-bandwidth-efciencies-coveragearea-conguration-modulationand-interferencelimited-efciency.webp)