This is a repository copy of The interpretation of CPT data from hydraulically placed pfa. White Rose Research Online URL for this paper:
http://eprints.whiterose.ac.uk/1326/
Article:
Stewart, D.I., Cousens, T.W. and Charles-Cruz, C.A. (2006) The interpretation of CPT data from hydraulically placed pfa. Engineering Geology, 85 (1-2). pp. 184-196. ISSN
0013-7952
https://doi.org/10.1016/j.enggeo.2005.09.038
[email protected] https://eprints.whiterose.ac.uk/
Reuse See Attached
Takedown
If you consider content in White Rose Research Online to be in breach of UK law, please notify us by
White Rose Consortium ePrints Repository
http://eprints.whiterose.ac.uk/
This is an author produced version of a paper published in Engineering Geology.
White Rose Repository URL for this paper: http://eprints.whiterose.ac.uk/archive/1326/
Published paper
Stewart, D.I., Cousens, T.W. and Charles-Cruz, C.A. (2006) The interpretation of CPT data from hydraulically placed pfa. Engineering Geology, 85 (1-2). pp. 184-196.
T
HEI
NTERPRETATION OFCPT
D
ATA FROMH
YDRAULICALLYP
LACEDPFA.
By
D.I. Stewart1, T.W. Cousens2, and C.A. Charles-Cruz2
ABSTRACT
Cone penetration test (CPT) results on an ~20 year old, hydraulically placed pulverised fuel ash
(PFA) deposit are reported, along with the results of oedometer compression tests on
‘undisturbed’ specimens recovered during the site investigation and resedimented PFA
samples. The latter showed that aged PFA can undergo significant secondary compression.
The correlation between volume compressibility and cone resistance, mv=1/(α.qc), is fitted to
compressibility data from undisturbed samples to determine α. The resulting CPT
compressibility profile shows good agreement with compressibility trends for aged PFA
estimated from the tests on resedimented ash. It is therefore recommended that a value of α=11
should be used for normally consolidated, aged PFA. The danger of biased sampling in very
loose non-cohesive materials and the need for depth profiling by in-situ measurement are
highlighted.
INTRODUCTION
Pulverised fuel ash (PFA) is a by-product of the coal fired generation of electricity. In the UK
this has historically been the main source of the generation of electricity and so very large
quantities of PFA have been produced. PFA is a fine particulate solid now usually collected by
electrostatic precipitation from the combustion flue gases. Fly ash particles are typically
spherical, ranging in diameter from <1μm to 150μm (the type of dust collection system used
largely determines the range of particle sizes). The chemical composition of the PFA depends
1
Corresponding Author, School of Civil Engineering, University of Leeds, Leeds, LS2 9JT, U.K. Phone 0113 343-2287, fax 0113 343-2265, email [email protected]
2
on the types and relative amounts of incombustible matter in the coal used but, for example, a
typical ash produced in Yorkshire, UK, from local bituminous coal is about 50% SiO2, 25%
Al2O3 and 10% Fe2O3. Calcium, magnesium and potassium compounds and carbon make up
most of the remainder (Yorkshire ash typically contains 2-3% carbon). Owing to the rapid
cooling of burned coal in power stations, PFA consists primarily of non-crystalline particles or
glasses (about 80%), and only a small amount of crystalline material (Cabrera et al., 1986;
Helmuth, 1987).
Some PFA is used as a secondary material, for example as a replacement for cement or as bulk
fill, but much has been disposed of by producing a water based slurry which is pumped to fill
voids, for example old open-cast mine workings, resulting in a sedimented fill within the void.
Where the void is water filled, pluviation of fine particles can result in a very loose material
with a high water content, especially for particles such as PFA where the specific gravity can
be relatively low (typically it is in the range 1.9 to 2.6; Cabrera et al., 1986; Joshi and Lohtia,
1997). The behaviour of such unusual very soft sediments is of interest both academically and
more generally because the PFA filled lagoons have development potential.
To exploit the development potential of PFA disposal sites, it is necessary to determine the
geotechnical properties of the hydraulically placed PFA. However, it is the authors’ experience
that it is generally very difficult to take undisturbed samples of hydraulically placed PFA
because any disturbance (including stress relief at the bottom of a cased borehole) can lead to
strength loss in loose non-cohesive deposits, and instability of the base of any borehole. Where
the PFA is very loose it is impossible to recover even notionally undisturbed samples. Thus,
unless an in-situ method has been used to measure the material properties, there is a danger that
that could be sampled (i.e. predominantly from firmer layers), which may give an unrealistic
picture of its geotechnical properties. As other in-situ testing methods have their draw-backs
and difficulties (for example the pressuremeter is expensive to deploy and measures soil
properties only in the horizontal plane which can be misleading if the material is anisotropic),
the relatively low costs and ease of use make the cone penetration test (CPT) a very attractive
method for testing very loose hydraulically placed PFA.
A major site investigation has been carried out on a 50m deep PFA disposal lagoon in West
Yorkshire to determine its suitability for redevelopment as a landfill site. During this
investigation the CPT was extensively used, partly because it represented an economical way of
determining the depth of the PFA (the boundary between the hydraulically placed PFA and the
underlying coal measures produced a sharp contrast in the CPT output), and also because
in-situ tests were the only way to estimate the geotechnical properties of the PFA where it was
very loose.
The CPT is not ideally suited to the reliable estimation of the compressibility of low
permeability soils (De Ruiter, 1982; Lunne et al., 1997). However, empirical correlations with
cone resistance have been developed that yield approximate values of volume compressibility
(Senneset et al., 1982; Robertson and Campanella, 1983a &1983b; Meigh, 1987; Lunne et al.,
1997). The difficulty with such correlations is that soil deformations, which around the cone
tip are similar to those caused by hemispherical cavity expansion, are primarily the result of
shear strains. Indeed, in saturated low permeability soils, the rate of cone advance is such that
there is insufficient time for drainage and the soil deforms at constant volume. Thus, empirical
correlations that determine volume compressibility from cone resistance rely on there being a
with any empirical correlation, it is therefore essential that compressibility correlations be
calibrated for the particular soil type. Lunne et al. (1997) go further and suggest that site
specific correlations be developed to give greater reliability to the compressibility correlation.
This paper is about the interpretation of CPT results from this investigation. A total of thirteen
CPT probes were conducted on the PFA deposit, and samples of PFA were recovered from the
site. PFA recovered from the site was re-sedimented and then consolidated in the laboratory,
replicating the stress history of the very loose zone of PFA found on the site. The
compressibility measured for this very loose resedimented PFA and that measured on
notionally undisturbed PFA samples recovered from firmer zones on site is compared with
compressibility values estimated from correlations with the CPT data. Values are
recommended for the constant in that correlation. The work may also be of interest for
researchers and engineers working with other very loose particulate systems, both natural
deposits and man-made, for example mine tailings.
THE SITE
Details of site have been reported by Cousens and Stewart (2003) but, briefly, the area of interest
is a 50m deep PFA disposal lagoon (lagoon 19) adjacent to a river. A large void was created
during the 1950s and 1960s by opencast coal mining and the extraction of sand and gravel. This
was partially backfilled with colliery spoil and embankments of the same material were
constructed to form a series of lagoons for PFA disposal. PFA was pumped into lagoon 19 as a
water-based slurry, allowed to sediment, and excess water was allowed to overflow a series of
weirs into the nearby river. During filling, lagoon 19 would have rapidly filled with water from
the slurry until the water level in the lagoon exceeded the river level, and thus the PFA would
still being operated in this manner into the 1980s, with a water level about 3m above river level).
Once the PFA level reached the initial overflow level, the overflow height would have been
raised incrementally using weir-boards on the outflow structure. During this stage of filling the
water and PFA levels will have been similar to avoid impounding water. PFA disposal into
lagoon 19 took place from 1970 to 1994, with most occurring during the early to mid 1970s,
none in the early 1980s, and a final 2-3m added before 1994.
GROUND INVESTIGATION
In July 1999 a ground investigation was carried out on the site described above to determine the
depth, variability, strength and compression characteristics of the PFA. The main investigation
was performed by Norwest Holst Soil Engineering Limited, and consisted of five boreholes
advanced by cable percussive techniques, with the collection of both disturbed and undisturbed
samples for laboratory testing. As part of the investigation thirteen CPT probes were undertaken
by Fugro Limited. In addition, further bulk disturbed samples were taken in 2003 by the
University of Leeds so that laboratory testing of resedimented samples could be undertaken.
DESCRIPTION OF THE PFA
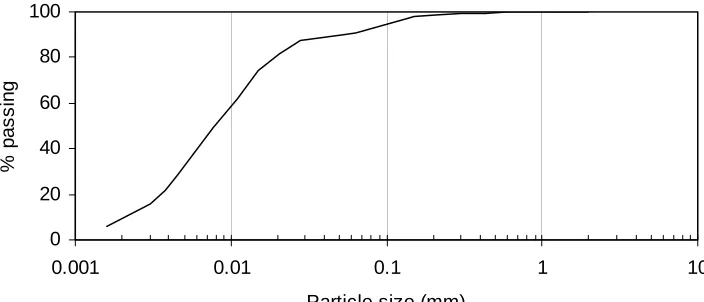
Figure 1 shows the particle size distribution of a sample taken from a depth of 14.5m in
borehole 1B, which was located near the centre of the lagoon. The particle size distributions of
most of the samples taken from the site were very similar to that shown in Figure 1, which
suggests that the PFA is relatively uniform over the site with 5-10% clay sized particles and
60-80% silt sized. Occasional thin coarse layers were detected in the PFA, but their extent is
unknown although they appear to be limited. Scanning electron microscopy on the silt and clay
sized fraction of a near surface sample of PFA shows that it consists primarily of very rounded,
micrographs also showed a weak open matrix (Figure 2b) which probably represents unburned
carbon in the ash.
The local bituminous coals in Yorkshire usually produce Class F PFA (low calcium ash that
doesn’t self-harden) upon combustion (Cabrera et al., 1986). Helmuth (1987) categorises PFA
produced at the site in the early 1960’s as Class F. None of the PFA had exhibited any
self-hardening while in the lagoon confirming this categorisation. In low-calcium ashes, complete
removal of carbon is rare. The measured specific gravity of the PFA is 2.3, which is in the
middle of the range of 2.23 to 2.40 reported by Cabrera et al. (1986) from ashes produced by
burning local bituminous coals in Yorkshire power stations.
The average liquid limit of the PFA was 46% (range 38-56%) with an average plastic limit of
42% (range 32-54%). The average plasticity index was 4% with some samples showing no
plasticity. The PFA classifies as an inorganic silt with slight plasticity. The in-situ moisture
content of the PFA showed a general pattern of a central band with a very high moisture
content (55% to 78%) with lower values above and below (38% to 44%). These values suggest
loose material, especially in the central band. The in-situ bulk density is estimated as varying
between 1.54 and 1.66 Mg/m3, which correspond to void ratios of approximately 1.28 to 0.88
assuming full saturation, the former values corresponding with the soft zone. A void ratio of
1.28 corresponds to a moisture content of 55% at saturation, thus either the very high moisture
content samples contained additional water from the borehole, or it was not possible to obtain a
sample sufficiently intact to obtain a bulk density from the very loose material. These voids
ratios are quite high; for example, in the extended Casagrande soil classification system void
ratio values for silt at maximum dry density are given as less than 0.7 (Road Research
METHODOLOGY
Cone Penetration Testing
The CPTs were made using twenty tonne capacity hydraulic penetrometer equipment mounted
in a crawler ballasted to provide a reaction weight of about 14 tonnes. A 7.5 tonne capacity
electric cone was used throughout, with a rate of penetration of approximately 2cm per second.
Load cells measured the cone end resistance and local side friction and the data were recorded
at 2cm depth intervals.
Oedometer Testing of Re-sedimented PFA
A series of one-dimensional compression tests were conducted on PFA recovered from lagoon
19 and re-sedimented in the laboratory. A 70mm diameter fixed ring oedometer was used with
top and bottom drainage. To avoid the need to move the specimen, with the inherent risk of
sample disturbance, sample preparation was undertaken with the oedometer within the
lever-arm loading apparatus.
To replicate the very high void ratios determined for the PFA deposit on site, and to reproduce
the primary feature of the deposition process on site, the specimens were prepared by water
pluviation. During sample preparation an extension tube made from acetate film and adhesive
tape was fitted to the water-bath. Only a small head of water was used, and a perfectly
adequate water seal was achieved by ensuring a close fit between the water bath and the
extension tube and by coating the contact surfaces with silicon grease. A second, slightly
shorter, extension tube made from acetate film was close-fitted inside the top of the oedometer
collar. An equal water level was established in both the inner and outer tubes about 120 mm
tube. The PFA had been air-dried, passed through a 2mm sieve, and then disaggregated with
light pressure from the flat surface of a palette knife. Once the required amount of PFA had
been added, it was left to settle for at least 1hr, after which only a slight discolouration was
visible in the water in the inner tube. At this stage the inner tube was carefully removed, the
water level was lowered to the top of the water bath, and the outer extension tube was removed.
This technique resulted in a specimen of very loose PFA initially just over 20 mm in height.
The top-cap, with a porous stone and filter paper, was placed very carefully on top of the
specimen and a seating load applied (the combined stress due to the top-cap and seating load
was equivalent to 13 kPa). The sample was loaded in increments typically of 13, 25, 52, 104,
208, 415, 832 and 1788 kPa to a maximum vertical stress of about 3.5 MPa. Each loading step
was monitored for a period 30 minutes, which was found experimentally to exceed the time for
90% consolidation for all loading increments (t90 was found in the conventional way by plotting
the settlement against √time). After some loading increments the specimen was monitored for
up to 3 days to observe any secondary (or creep) compression. Small stress increments were
used initially on reloading after a creep period. Unloading was undertaken in two or three large
increments because the rebound was very small and the response was essentially instantaneous.
After unloading the specimen was extruded and its height measured. After weighing, the whole
sample was oven dried so that its dry weight and moisture content could be determined.
Disturbance during extrusion meant that the sample height could not be determined accurately,
and the final void ratio of the specimen was determined from the final moisture content
RESULTS
Cone Penetration Testing
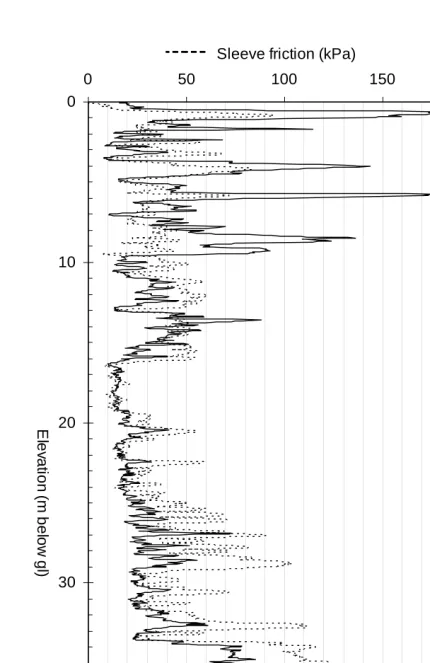
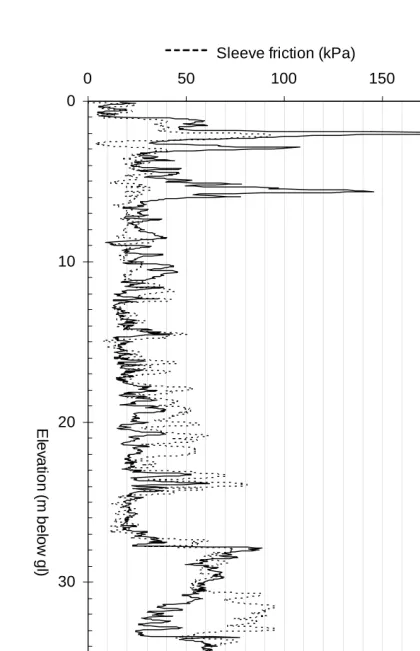
Typical CPT data from the deeper part of the lagoon are shown in figures 3, 4 and 5 (of the
three CPT shown, 4C was the northernmost and closest to, and 7C was the southernmost and
furthest from the PFA slurry input point). All the tests clearly indicated the bottom of the PFA
deposit, and characterize the PFA as either “granular” or “cohesive” depending on the cone
resistance (qc) and friction ratio (Rf). Much of the PFA can be described as a very loose to
loose granular material or soft to firm cohesive material, although there are dense/firm zones
and inter-layering is common. As the particle size distribution data show little variation in the
silt sized PFA over the site, the variations in classification using qc and Rf must reflect variation
in density rather than composition. Thus there are considerable depths of loose/soft material
but it is very difficult to discern a pattern in the variation of the PFA, either vertically or
laterally, from the qc and Rf data except for an increasing depth of loose material towards the
south of the site.
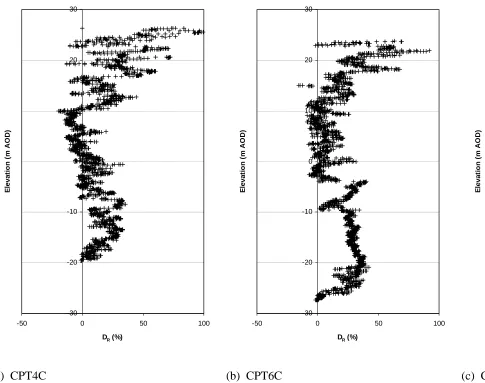
Figure 6 shows plots of the relative density of the PFA against depth which have been produced
using the relationship for high compressibility quartz sands described by Meigh (1987). In this
relationship between relative density and qc/(σv')½, the in-situ vertical stress, σv', has been
calculated assuming a total unit weight of 15.5 kNm-3 and that the water table is at a height of
19m AOD (6m below average ground level). It is inappropriate to place too much faith in the
absolute values of relative density from such a relationship (the relationship between cone
resistance, in situ stress and relative density is significantly influenced by soil compressibility;
Campanella et al., 1984), but the variation of relative density reveals an interesting pattern.
zone. In the middle of the lagoon the PFA is loosest at a height of about 10m AOD and the
relative density increases gradually with depth.
Given the levels of the lagoon (present ground level about 25m AOD) and river (about 15m
AOD) and the filling procedure used to deposit the PFA the density pattern might have been
created in the following way. Initially the void, whose deepest point is about -30m AOD,
would either have been water-filled, or would have rapidly have become so as the PFA slurry
was pumped in, resulting in the PFA sedimenting through water. This would have continued
with the excess water overflowing through settling ponds into the river once the water level
reached about 17m AOD. As the inlet point was at the northern edge of the lagoon, the PFA
would tend to sediment from the north, possibly resulting in slumping failure of the PFA
underwater, which would give a very loose packing. As the depth of sedimented solids reached
17m (i.e. the water level in the lagoon) the pattern of deposition would have changed to one
where the slurry would have dewatered while flowing over the ground surface (i.e. the water
would have drained downwards out of the PFA), rather than particle sedimentation through
water, which would have given a denser structure, an effect possibly increased by surface
drying.
Therefore it would appear that the PFA below 15m AOD is close to a normally consolidated
state, as it has been deposited through water to achieve a very loose state, and then
subsequently compressed by the material deposited above. It is also likely to have undergone
secondary compression over the time since deposition (approximately 20 years). The stress
history of the material above 15m AOD appears to have been more complicated, with surface
from sedimentation through water, and thus it can be generally described as
“over-consolidated”
Oedometer Testing of Re-sedimented PFA
The variation in void ratio with vertical effective stress of water pluviated PFA is shown in
Figure 7. Three tests are shown in this figure. The tests presented were all very loose on first
loading and exhibit normally consolidated behaviour almost from the start of testing (the
specimens exhibited large plastic strains from first loading, and the relationship between void
ratio and the logarithm of vertical effective stress is highly linear from a surcharge stress of 100
kPa to one exceeding 3 MPa). Upon unloading the relationship between e and logσv′ was also
linear but the response is far stiffer than that exhibited on loading. All the tests conducted gave
very similar values of both Cc and Cr (the average values are 0.27 and 0.036, respectively), and
the only significant difference between the tests was the value of the initial void ratio. The
method of sample preparation meant that the initial specimen height is unknown and the final
specimen height can only be measured after sample extrusion. Thus there is some uncertainty
in the measured specimen dimensions. Thus the void ratios of the specimens were determined
from their final water contents by assuming complete saturation, and the measured change in
specimen height. This introduces a small uncertainty into the absolute values of void ratio
presented in Figure 7. Thus it is believed that all the test specimens were exhibiting essentially
the same behaviour with most of the differences in void ratio being due to slight inaccuracies in
measurement and saturation at the end of the test.
At selected loading increments during tests 4 and 6 the loading was held constant after the
compression (or creep) response could be observed. The data have been fitted with
straight-lines of the form:
Δecreep = Cα log10(tcreep/t90) (1)
where Δecreep is the change in void ratio during secondary compression, t90 is the time taken for
90% consolidation and tcreep is the time elapsed since a change in the loading. The average
value of Cα measured over 5 creep stages was 0.0036 (which is only slightly less than would be
anticipated for normally consolidated clay; Lambe and Whitman, 1979).
DISCUSSION
The oedometer data can be used to estimate the volumetric compressibility, mv, of the PFA for
comparison with that estimated from correlations with the CPT data (see Bjerrum, 1967). For
PFA that is normally consolidated upon first loading, the starting void ratio after a period of
creep can be estimated by combining equation 1 with the equation of the normal consolidation
line to give;
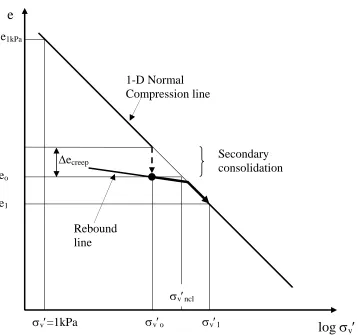
eo = e1kPa - Cc log10(σv′o) – Cα log10(tcreep/t90) (2)
where e1kPa is the void ratio on the normal consolidation line when σv′=1kPa (see Figure 8). If
the PFA is then subjected to a stress increment that is sufficient to bring it back onto the normal
consolidation line, the compressibility on reloading can be estimated from;
mv = 1 1+eo
Δe
Δσv′ = 1 1+eo
Cc log10(σv′1/σv′ncl)
σv′1 - σv′o (3)
where eo is the void ratio after creep, and σv′nlc is the effective stress at the point on the normal
consolidation line where e=eo: the value of σv′nlc can be estimated from eo and the equation of
the normal consolidation line. If the stress increment is insufficient to bring the PFA back onto
the normal consolidation line, the compressibility can be estimated from the void ratio after
mv = 1 1+eo
Cr log10(σv′1/σv′o)
σv′1 - σv′o
(4)
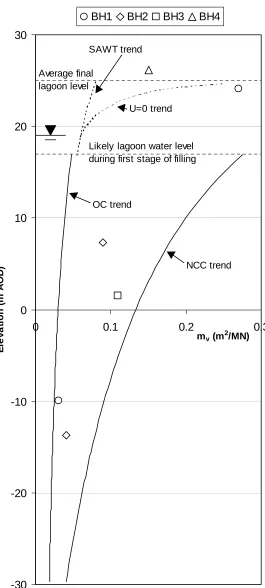
The mv profiles shown Figure 9 have been calculated using equations 3 and 4 by assuming a
unit weight of 15.5 kN/m3 for the PFA, ground surface at 25m AOD and a water table at 19m
AOD. The NCC (normal consolidation, creep) trend is given by equation 3 using average e1kPa,
Cc and Cα values from the oedometer data and a stress increase of 100kPa. All the oedometer
tests gave essentially the same Cc value, and mv is not particularly sensitive to small errors in
e1kPa, so void ratio errors in the consolidation data have a small effect on mv, but the amount of
creep consolidation controls how far the initial condition of the specimen is from the normal
consolidation line and potentially can have a big effect on mv. The PFA level was close to its
current level by the late 1970’s and filling ceased after adding a further 2-3m in the mid to late
1980’s. Thus the upper mv profile for sedimented PFA shown in Figure 9 has been estimated
by assuming a creep duration of 20 years. However the Cα value has been evaluated over a
time period more than 3 orders of magnitude less than this and thus must be treated with
caution.
The OC (over-consolidation) trend on Figure 9 is based on equation 4 and approximates to the
situation where there has been sufficient creep for the reloading stress-path to remain on a
rebound line. It has been calculated for a stress increment of 100 kPa using the average Cr
value from the oedometer tests. It can be seen from equation 4 that variations in the initial void
ratio have only a fairly small effect on mv for stress-paths following a rebound line (for the
entire range of eo exhibited by the PFA of 0.7≤eo≤1.4 the 1/(1+eo) term only varies between
0.59 and 0.42), and so the eo value used to calculate mv for specimens that undergo sufficient
The mv values measured on specimens from U100 samples recovered during the site
investigation are also shown in Figure 9. These mv values were for a stress increase of 100 kPa
from the estimated in-situ vertical effective stress. When reviewing this data it should be
remembered that during the site investigation attempts at sample recovery from the very soft
region between 15 and -10 m AOD were frequently unsuccessful. Therefore the reason that
sample recovery was possible at two locations in this zone may be due to there being a locally
stiffer region of PFA, and thus the mv values for the two specimens recovered from this depth
range may be unrepresentative. The mv values measured on the U100 samples from the zone
that was sedimented through water (i.e. the zone that has probably undergone normal
consolidation followed by secondary compression) fall between the two estimated mv profiles.
Two further mv profiles are shown in Figure 9 as dashed lines. These profiles are for
comparison with the data for the PFA that was surface deposited above the water level during
the first filling stage (i.e. in the zone that was deposited in a denser state and has probably
become over-consolidated due to seasonal variations in the water table and the resulting pore
suctions). The initial void ratio and subsequent response of the PFA in this region cannot
easily be estimated by using consolidation data, so the profile has been estimated using an
initial void ratio of 0.9 (a representative value for this region) and the rebound index Cr for a
100kPa stress increment. The rebound index, Cr, has been used in the estimation of mv in this
region on the assumption that the PFA has become over-consolidated as described above. The
u=0 trend assumes that there is no pore water pressure above the water table, whereas the
SAWT trend assumes the PFA is fully saturated above the water table with the pore water in
The oedometer specimens from the U100 samples from shallow depths were inundated with
water once a seating load had been applied, thus mv values will not be representative of the
PFA on site, which will have been stiffer due to the effect of pore suction. These mv values are
comparable with the u=0 trend shown in Figure 9. Here, despite the uncertainty about the
initial void ratio, the data fit is reasonably good. This gives some credibility to using equation
4 and an estimated initial void ratio to estimate mv in this region of the PFA.
The coefficient of volume compressibility can also be estimated from CPT data using the
equation:
mv = 1/(α.qc) (5)
where α is a constant of proportionality that depends on the soil type (Robertson and
Campanella, 1983a &1983b; Meigh, 1987; Lunne et al., 1997). Suggested values of α for cone
resistance measured with a reference tip are 3 to 11 for normally consolidated sands, 5 to 15 (or
even 30) for over-consolidated sands, 3.5 to 7.5 for low to medium plasticity silts, and 2.5 to 10
for organic silt.
The CPT data from CPT4C, CPT6C and CPT7C has been visually fitted to the mv values
measured in oedometer tests on specimens from U100 samples recovered from the site (for a
100kPa stress increase from σv'o) by varying the α-value until there is good agreement. As cone
resistance is primarily a measure of strength, which in an undrained material will be a function of
the void ratio, it should be anticipated that α may vary with OCR as normally and
over-consolidated soils at the same void ratio have very different compressibility (indeed, different α
-values are recommended for normally and over-consolidated sands; Robertson and Campanella,
1983a; Meigh, 1987). Therefore only the compressibility of specimens recovered from below 15
CPT correlation. Also, as borehole BH1 is fairly near to CPT4C, BH2 is close to CPT6C and
BH3 is close to CPT7C, particular emphasis was placed on the relationship between the CPT
estimate and the compressibility of specimens from the nearest borehole when selecting a
suitable α-value for the mv correlation. The best visual fit of the CPT estimates to the
compressibility of the undisturbed specimens was obtained with an α-value of 11.
The compressibility profiles estimated from the CPT data using an α-value of 11 are shown in
Figure 10, together with the compressibility of the undisturbed samples and the compressibility
profiles estimated from the oedometer tests on the resedimented PFA. Below 15m AOD,
where the PFA is thought to be largely normal consolidated, the volume compressibilities
estimated from CPT data fall largely between the NCC and OC trends calculated from the
consolidation behaviour of the resedimented PFA.
In detail, the compressibility estimated from CPT4C data straddles the NCC trend at depth, but
between -15 and -8m AOD it falls closer to the lower, OC trend (the U100 specimen from BH1
recovered from within this depth range had a compressibility only slightly above the
over-consolidated trend). Between -8 and 10m AOD the CPT estimate typically falls just below
NCC trend. Generally the trend in the compressibility estimated from CPT6C are similar to
that from CPT4C, except that it falls close to the OC prediction from about -20 and -4m AOD
(although a single peak falls on the NCC trend at -9m AOD). The compressibility estimated
from CPT6C straddles the NCC trend from the bottom of the PFA to 12m AOD. At depths just
below the water level during the first stage of filling, the CPT estimates of compressibility fall
away from the NCC trend towards the OC trend (the CPT7C estimate even falls slightly below
the OC trend). Given the uncertain history of the PFA sedimented through water (arising from
is quite remarkable that the compressibility of aged, water-sedimented PFA falls so
overwhelmingly between the NCC and OC trends, which represent a best estimate and a lower
limit on the compressibility of an originally normally consolidated deposit that has become
lightly over-consolidated through creep.
As already stated, it is inappropriate to assume a-priori that the α-value for PFA that has
undergone surface deposition and subsequent pore suction variation, and may therefore be in an
over-consolidated state, is the same as that for PFA that has sedimented through water (i.e.
initially normally consolidated but now lightly over-consolidated through creep). Also, mv has
not been correctly measured on the U100 samples from the surface deposition zone, because
the oedometer specimens were inundated with water once a seating load had been applied
relieving any pore water suction, and so the PFA is in a different state from that tested during
the CPT. Thus it is difficult to make definitive statements about a suitable α-value for PFA
that has undergone surface deposition. However, it can be observed from the CPT estimate of
mv that surface deposition and subsequent pore suction variation appears to result in a material
with a far more variable compressibility than sedimentation through water. It is also interesting
to note that in the surface deposition zone the CPT estimates of compressibility based on an α
-value of 11 generally fall around the SAWT trend line for over-consolidated PFA that is
saturated above the water table except very near the ground surface where it falls near the u=0
trend line for over-consolidated PFA. As the methodology used to estimate the PFA
compressibility in this zone is given some validity by the fit of the u=0 trend to the mv values
from the inundated oedometer tests, it is reasonable to treat the SAWT trend as a guide to the
compressibility in this region (and particularly just above the water table). Thus it is tentatively
CONCLUSIONS
In very loose hydraulically placed PFA it is not possible to establish the variation of
engineering properties within a deposit simply by the laboratory testing of undisturbed
specimens recovered during a site investigation. This is because it can be impossible to recover
even notionally undisturbed samples of the loosest, and therefore weakest and most
compressible material. Thus it is essential that an in-situ method is used to depth profile the
material, otherwise there is a danger that the results of the laboratory test programme will be
biased towards the zones within the PFA that can be sampled.
In the current work the CPT has been successfully used to establish the variation in the volume
compressibility of aged hydraulically placed PFA deposits by employing the widely used
correlation with cone resistance, mv=1/(α.qc). As the CPT is not ideally suited to determining
the compressibility of low permeability soils, it was necessary to determine the constant in this
correlation for the material being investigated. Two approaches have been used to determine a
suitable value of α. Firstly the mv profile from the CPT correlation was compared with mv
measured in oedometer tests on undisturbed PFA samples taken from depth. However, as the
volume compressibility estimated from the CPT was at some locations more than twice that
measured, further corroboration was considered necessary. Therefore PFA was resedimented
in an oedometer cell and its consolidation response was measured. It was found to undergo
significant secondary compression, which must be accounted for when estimating mv for aged
PFA deposits. Thus, mv profiles for aged PFA deposits that were in good agreement with the
measured compressibility values, and bounded the CPT correlations, were derived. In this way
it was established that a value of α=11 should be used for the constant of correlation for
Calibration chamber testing has been widely used to determine the correlation between CPT
data and various soil properties. An implication of this work is that it is inappropriate to rely
on a correlation derived from chamber tests, where ageing cannot be replicated, to determine
the compressibility of a material that undergoes significant secondary compression.
ACKNOWLEDGEMENTS
The authors would like to thank Mr John Ablitt and Biffa Waste Services Ltd. for permission to
use the information and data presented in this paper. They also wish to thank Phillipa Slater
and Inam Ul-Haque for their measurements of the specific gravity of the PFA particles.
REFERENCES
Bjerrum, L. (1967). Engineering geology of Norwegian normally-consolidated marine clays as
related to the settlement of buildings. Geotechnique, 17, 81-118.
Cabrera, J.G. , Hopkins, C.J., Woolley, G.R., Lee, R.E., Shaw, J., Plowman, C. and Fox, H.
(1986). Evaluation of the properties of British pulverised fuel ashes and their influence
on the strength of concrete. American Concrete Institute SP-91 Vol. 1 (Editor V.M.
Malhotra).
Campanella, R.G., Robertson, P.K., Gillespie, D. and Klohn, E.J. (1984). Piezometer-friction
cone investigation at a tailings dam. Canadian Geotechnical Journal, 21, 551-562.
Cousens, T.W. and Stewart, D.I. (2003). Behaviour of a trial embankment on hydraulically
placed PFA. Engineering Geology, 70, 293-303.
De Ruiter, J. (1982). The static cone penetration test: State of the art report. Proceedings of the
2nd European Symposium on Penetration Testing, 389-405.
Helmuth, R. (1987) Fly ash in cement and concrete. Portland Cement Association, Skokie,
Joshi, R.C. and Lohtia, R.P. (1997). Fly ash in concrete; production, properties and uses.
Advances in concrete technology, Vol. 2, Gordon and Breach Science Publishers.
Lambe, T.W. and Whitman, R.V. (1979). Soil Mechanics, SI version. John Wiley and Sons.
Lunne, T., Robertson, P.K. and Powell, J.J.M. (1997). Cone penetration testing in geotechnical
practice. Blackie Academic and Professional, London.
Meigh, A.C. (1987). Cone penetration testing- methods and interpretation.
CIRIA-Butterworths, London.
Road Research Laboratory (1952). Soil Mechanics for Road Engineers. HMSO, London.
Robertson, P.K. and Campanella, R.G. (1983a). Interpretation of cone penetration tests. Part I:
Sand. Canadian Geotechnical Journal, 20, 718-733.
Robertson, P.K. and Campanella, R.G. (1983b). Interpretation of cone penetration tests. Part
II: Clay. Canadian Geotechnical Journal, 20, 734-745.
Senneset, K., Janbu, N. and Svano, G. (1982). Strength and Deformation parameters for cone
penetration tests. Proceedings of the 2nd European Symposium on Penetration Testing,
List of Figures
Figure 1: Typical particle size distribution of the PFA.
Figure 2: SEM images of the PFA.
Figure 3: Data obtained from CPT4C
Figure 4: Data obtained from CPT6C
Figure 5: Data obtained from CPT7C
Figure 6: Relative density profiles determined from (a) CPT4C, (b) CPT6C, and (c) CPT7C.
Figure 7: Oedometer tests on loose PFA prepared by water pluviation.
Figure 8: Schematic diagram showing the stress path of PFA that has undergone primary
consolidation and secondary compression upon subsequent stress increase.
Figure 9: Idealised mv profiles and mv values from the U100 samples recovered from the
boreholes.
Figure 10: Volume compressibility, mv, determined from (a) CPT4C, (b) CPT6C, and (c)
0 20 40 60 80 100
0.001 0.01 0.1 1 10
Particle size (mm)
% p
a
ss
in
g
[image:24.595.116.468.70.221.2](a) (b)
[image:25.595.69.530.96.285.2]0.70
0.80
0.90
1.00
1.10
1.20
1.30
1.40
1.50
1.0
10.0
100.0
1000.0
10000.0
σ
v' kPa
e
Test 4 Test 5 Test 6
Unloading
Loading
[image:26.595.93.516.72.343.2]e1kPa
e1
e
eo
Δecreep
σv′ncl Rebound
line
Secondary consolidation 1-D Normal
Compression line
σv′o σv′1
σv′=1kPa
log
σ
v
′
Figure 8: Schematic diagram showing the stress path of PFA that has undergone primary
[image:27.595.96.454.75.410.2]-30 -20 -10 0 10 20 30
0 0.1 0.2 0.3
mv (m2/MN)
E
lev
at
io
n
(
m
A
O
D
)
BH1 BH2 BH3 BH4
Likely lagoon water level during first stage of filling Average final
lagoon level
NCC trend OC trend
U=0 trend SAWT trend
Figure 9: Idealised mv profiles and mv values from the U100 samples recovered from the
[image:28.595.133.398.72.660.2]Figure 3: Data obtained from CPT4C
0 50 100 150 200
0
10
20
30
40
50
E
lev
a
tio
n
(
m
be
lo
w
g
l)
Sleeve friction (kPa)
0 2 4 6 8
Cone resistance (MPa)
0 4 8
0
10
20
30
40
50
Figure 4: Data obtained from CPT6C
0 50 100 150 200
0
10
20
30
40
50
E
lev
a
tio
n
(
m
be
lo
w
g
l)
Sleeve friction (kPa)
0 2 4 6 8
Cone resistance (MPa)
0 4 8
0
10
20
30
40
50
Figure 5: Data obtained from CPT7C
0 50 100 150 200
0
10
20
30
40
50
E
lev
at
ion
(
m
bel
ow
gl
)
Sleeve friction (kPa)
0 2 4 6 8
Cone resistance (MPa)
0 4 8
0
10
20
30
40
50
-30 -20 -10 0 10 20 30
-50 0 50 100
DR (%)
E lev at io n ( m A O D )
(a) CPT4C
-30 -20 -10 0 10 20 30
-50 0 50 100
DR (%)
E lev at io n ( m A O D )
(b) CPT6C
-30 -20 -10 0 10 20 30
-50 0 50 100
DR (%)
E lev at io n ( m A O D )
(c) CPT7C
[image:32.842.80.565.105.488.2]-30 -20 -10 0 10 20 30
0 0.1 0.2 0.3
mv (m2/MN)
E le v a ti o n ( m AO D)
(a) CPT4C
-30 -20 -10 0 10 20 30
0 0.1 0.2 0.3
mv (m
2 /MN) E levat io n ( m A O D )
(b) CPT6C
-30 -20 -10 0 10 20 30
0 0.1 0.2 0.3
mv (m
2 /MN) E levat io n ( m A O D )
[image:33.842.71.764.100.492.2](c) CPT7C