This is a repository copy of
Asymmetric problems and stochastic process models of traffic
assignment
.
White Rose Research Online URL for this paper:
http://eprints.whiterose.ac.uk/89880/
Version: Accepted Version
Article:
Watling, D orcid.org/0000-0002-6193-9121 (1996) Asymmetric problems and stochastic
process models of traffic assignment. Transportation Research. Part B: Methodological, 30
(5). pp. 339-357. ISSN 0191-2615
https://doi.org/10.1016/0191-2615(96)00006-9
© 1996, Elsevier. Licensed under the Creative Commons
Attribution-NonCommercial-NoDerivatives 4.0 International
http://creativecommons.org/licenses/by-nc-nd/4.0/
[email protected] https://eprints.whiterose.ac.uk/ Reuse
Unless indicated otherwise, fulltext items are protected by copyright with all rights reserved. The copyright exception in section 29 of the Copyright, Designs and Patents Act 1988 allows the making of a single copy solely for the purpose of non-commercial research or private study within the limits of fair dealing. The publisher or other rights-holder may allow further reproduction and re-use of this version - refer to the White Rose Research Online record for this item. Where records identify the publisher as the copyright holder, users can verify any specific terms of use on the publisher’s website.
Takedown
If you consider content in White Rose Research Online to be in breach of UK law, please notify us by
ASYMMETRIC PROBLEMS AND
STOCHASTIC PROCESS MODELS OF TRAFFIC ASSIGNMENT
David Watling
Institute for Transport Studies, University of Leeds, UK
Abstract
There is a spectrum of asymmetric assignment problems to which existing results on uniqueness of equilibrium do not apply. Moreover, multiple equilibria may be seen to exist in a number of simple examples of real-life phenomena, including interactions at priority junctions, responsive traffic signals, multiple user classes, and multi-modal choices.
In contrast, recent asymptotic results on the stochastic process approach to traffic assignment establish existence of a unique, stationary, joint probability distribution of flows under mild conditions, that include problems with multiple equilibria. In studying the simple examples mentioned above, this approach is seen to be a powerful tool in suggesting the relative, asymptotic attractiveness of alternative equilibrium solutions. It is seen that the stationary distribution may have multiple peaks, approximated by the stable equilibria, or a unimodal shape in cases where one of the equilibria dominates.
It is seen, however, that the convergence to stationarity may be extremely slow. In Monte Carlo simulations of the process, this gives rise to different types of pseudo-stable behaviour (flows varying in an apparently stable manner, with mean close to one of the equilibria) for a given problem, and that this may prevail for long periods. The starting conditions and random number seed are seen to affect the type of pseudo-stable behaviour, over long but finite time horizons. The frequency of transitions between these types of behaviour (equivalently, the average sojourn in a locally attractive, pseudo-stable set of states) is seen to be affected by behavioural
1 A slightly stronger definition of equilibrium has been used by some authors, eg Dafermos (1980). The difference is discussed by Smith (1984a). The above follows Smith's definition of `Wardrop equilibrium'.
2 See, for example, Smith (1979b, 1984c) and Horowitz (1984) for alternative, global definitions of stability.
3 It is assumed henceforth that travel cost is a linear, increasing function of travel time, and that the time-weighting is link-independent. Hence `time' and `cost' are interchangeable in the conditions stated.
4 An alternative existence theorem is provided in Smith (1981a), based on properties of the cost functions at individual intersections, assuming the flows at one intersection do not affect costs at another.
1. INTRODUCTION: EQUILIBRIUM TRAFFIC ASSIGNMENT
Traffic assignment is concerned with predicting an average flow for each link in a road network, given rules about the way in which drivers select a route. The demand-side data are given in the form of an origin-destination (OD) matrix, representing the average inter-zonal demand for travel during, say, a peak period. The supply-side data are specified in terms of a set of link travel time functions, which give the average link travel times when the link flows are at a given level. Drivers are assumed to make their route choice based on the generalised travel cost, typically a linear combination of travel time and flow-independent attributes.
Equilibrium traffic assignment models assume that drivers select a route so as to minimise their own travel cost, of which they have perfect predictive knowledge. A traffic assignment is defined
as being in equilibrium if and only if the travel costs on all used routes between each OD pair
are equal, and greater than the cost that would be experienced on any unused route at these flow
levels . An equilibrium is said to be (locally) 1 stable unless arbitrarily small deviations may
cause the system to diverge from the original equilibrium state, following Netter (1972), Braess
and Koch (1979), and Heydecker (1983) . Guaranteeing the existence of a 2 unique stable
equilibrium has long been recognised as being highly desirable. This would ensure that in a before-and-after study of some scheme, modelled differences may be attributed to the effects of the scheme, rather than instability in the model behaviour. For example, a minor change could otherwise cause an equilibrium algorithm to approach different equilibria.
i
Suppose a network has n links, and the (perceived) travel cost for link 3 i is c (v), where v =
1 2 n i
(v ,v ,...,v ) and v is the flow on link i. The Jacobian is defined as the nxn matrix with (i,j)
i j
element
M
c /M
v . A traffic assignment problem is termed separable when the Jacobian isi i i
diagonal; that is to say, when c = c (v ). Beckmann et al (1956) showed that a unique stable
i
equilibrium exists for any separable problem where the c (.) are continuous and strictly
increasing. Dafermos (1971) appears to be the first to have considered the non-separable case, requiring that the Jacobian be symmetric and positive definite. However, many problems of practical interest are neither separable nor symmetric.
Non-separable problems where the symmetry of the Jacobian cannot be guaranteed are termed
asymmetric. The most general result for such problems was derived by Smith (1979b), who established (subject to a technical condition):
!
existence of equilibria under the continuity of the vector of cost functions 4 c(.);
!
uniqueness of equilibrium under the strict monotonicity condition:5 A similar restriction, that each link flow be bounded by the link capacity, was imposed by Beckmann et al (1956). 6 Heydecker (1983) sought to establish a necessary condition for uniqueness, the violation of which would indicate the
presence of no or multiple stable equilibria. In fact, he found his proposed condition was necessary only for positive definiteness, which (as stated above) is not necessary for equilibrium uniqueness.
for all "supply-feasible" vectors 5 v, w of link flows on the network, v =/ w.
Dafermos (1980), while concurrently establishing an existence theorem, showed that Smith's uniqueness condition was equivalent to requiring that the Jacobian be positive definite. This is not a trivial condition to verify in practice, but a useful indicator as to its possible truth or
violation may be gained from a sufficient condition for a symmetric matrix to be positive
definite. This indicator requires that:
(a) the travel cost on each link is an increasing function of the flow on that link, when other
link flows are held constant; and
(b) the dominant explanatory factor in a link's cost is the flow on that particular link, rather
than any other link flow.
which in terms of the Jacobian requires (Sheffi, 1985, p213):
i i i i j (j=/i) i j
M
c /M
v > 0 &M
c /M
v >G
M
c /M
v for all i.In practice, such conditions are often violated: for example, at a priority junction, where delay on a minor arm is strongly dependent on the flows on the major road. It should be recognised, however, that positive definiteness is a sufficient but not a necessary condition for equilibrium
uniqueness . Indeed, it is possible to conceive examples with an indefinite Jacobian but a unique6
equilibrium, as well as those with multiple equilibria (see later). The range of asymmetric
problems falling in this area of uncertainty is in fact even greater, when one considers extensions to the basic model described above, such as:
Multiple user class (MUC) assignment, which allows several groups of user, each with its own OD matrix and generalised cost parameters. Braess and Koch (1979) established existence of MUC equilibria under positive definiteness of the Jacobian, for each link, of UC costs with respect to UC flows. Except in the symmetric case (Dafermos, 1972), no conditions for uniqueness of UC link flows have yet been established. Uniqueness of "total
link flows" - a weighted sum of the UC link flows, based on link-independent weights - has been established by Daganzo (1983) and Van Vliet et al (1985), though only for a restricted class of models where the flow-dependent part of UC costs is a UC-independent function of total link flow.
Stochastic equilibrium assignment (Fisk, 1980; Daganzo, 1982; Sheffi, 1985, chapter 12), where drivers' perceived costs are random variables. Uniqueness is guaranteed only under at least as restrictive assumptions as the deterministic case (positive definiteness), in addition to certain technical conditions on the link cost probability distributions.
Responsive traffic signals and assignment, equilibrium occurring when the flows are in
Even if link costs are assumed separable for given signal timings, asymmetric interactions may arise in the responsive case, since an increase in flow on one junction approach will tend to cause a decrease in the share of green time (and hence an increase in delay at fixed flow levels) to other approaches at that junction. Smith (1981b) proposed some fairly restrictive assumptions for existence of equilibria in this case, although the question of uniqueness has yet to be addressed.
Joint travel choice models including, for example, multi-modal assignment and combined generation-distribution-assignment. Sheffi (1985, chapter 9) shows how a number of these may be reformulated as asymmetric link-interaction, single mode models over suitably extended networks. Fernandez & Friesz (1983) provide a comprehensive review, attributing the most
general theoretical result to Aashtiani and Magnanti (1981). This is based on additional
conditions imposed on the `demand functions', i.e. the OD demand levels as a function of the vector of minimum OD costs:
!
(existence) demand functions are non-negative, continuous, and bounded above;
!
(uniqueness) the vector of negative demand functions is strictly monotone.In multi-modal problems, for example, this latter condition may be violated, since bus delays are most heavily dependent on car flows.
In spite of these gaps in equilibrium theory, there has been little research into understanding problems with asymmetric, indefinite Jacobians, either from an empirical or theoretical point of view. This may in part have been due to the lack of suitable tools. For example, equilibrium solution algorithms are typically only guaranteed to converge under conditions that are at least as restrictive, and in any case are not designed to provide information on multiple solutions.
2. ASYMMETRIC PROBLEMS: SOME EXAMPLES
The study in this paper will be based on a number of examples of asymmetric problems. Highly simplified networks will be used, since many of the analyses performed are only computationally feasible in such cases. However, the models used represent realistic properties of practical interest, and have important implications for the study of larger networks, discussed later. For the moment, it is sufficient that the examples be considered broad descriptions of plausible routes on an isolated OD movement.
The networks considered all consist of a single OD pair, joined by two parallel links/routes with
i 1 2
cost functions c (v ,v ), for i=1,2. Both deterministic and stochastic equilibrium solutions are
discussed. In the latter case, it is supposed that drivers select a route according to a logit model
with dispersion parameter ß (>0):
1 1 2
p (c ,c ) = 1
1 2 1 + exp (ß(c - c ))
1
where p is here the proportion of drivers selecting route 1. If the OD demand is T, the condition
for stochastic equilibrium is:
1 1 1 2
v = T p (c (v),c (v)) .
equilibrium proportion of T using each route is invariant with respect to T, particular values for
T are assumed, for the convenience of the analysis in section 4.
2.1 Cascetta's example
The following example, although rather abstract, is interesting because it has previously been considered in this journal series in a context relevant to the present paper. Cascetta (1989) considered a 2-link network with an OD demand of 10, and cost functions:
1 1
c = 0.7 v + 7
2 2 2
c = -8.464797 v + 31.9296 v < 3.132
2 2 2
c = (2/3) v + (10/3) v
$
3.132Therefore, although the cost functions are separable, they are not monotonically increasing. Morlok (1979) shows how a cost function of this general shape could arise from a demand-responsive bus service, so the example is not entirely abstract if the routes are viewed as modes. A similar argument could be given concerning problems with responsive traffic signals, though these are dealt with explicitly later, in example 2.6.
Cascetta, assuming a logit route choice model with dispersion parameter ß = 0.3, identified two
1
stochastic equilibria, at around v = 3.60 and 9.50 (the latter appears to be a slight typographical
error, since the second equilibrium can be verified to be around 9.95). These two are both stable, as can be verified by an analysis such as Heydecker's (1983). In fact, there is a third stochastic
1
equilibrium, at v = 8.40, but this is unstable.
2.2 Priority junction example
i
Consider a two-link network where the cost (travel time) c on link i (i=1,2) is:
i i i i i
where
(
=(
(v) is the flow-dependent (exit) capacity, and a, b and m are constants. Supposethat link 2 runs parallel to link 1 for some distance, but that link 2 traffic must then give
i
priority to and join link 1 at a priority junction (after which they experience the same delay). If s
1 1
is the saturation flow of link i (i=1,2), it is assumed that
(
=s, but that based on a steady stategap acceptance model:
2
where g > 0 is a gap acceptance parameter and 0.02s represents a "pushing in" capacity that is
1 1
also applied in the case v > s (Van Vliet, 1985). These assumptions are an aggregate
representation of those used in the well-known SATURN model of Van Vliet. The asymmetric
1 2 2
7 The fact that stochastic equilibrium gives unique UC flows, where deterministic equilibrium does not, is known by the work of Daganzo (1983). An analogous (and better known) result arises in single user class problems, where equilibrium route
flows are in general non-unique in the deterministic case but unique in the stochastic case.
For example, assume an OD demand of T=80, with g=0.03 and link-based parameters:
1 1 1 1 2 1 1 1
a = 3.5; b = 2.5; m = 3; s = 250; a = 1.0; b = 4.0; m = 5; s = 170.
1
This example has two stable deterministic equilibria, at v = 0 and 60.80. For ß > 1.18 two
corresponding stable stochastic equilibria arise, for ß < 1.18 there is only one.
2.3 Multiple user class example 1
Consider a two-link network in which a demand of 15 trucks and 100 cars must be routed, and where a truck has a "passenger car equivalent" factor of 3. Link delays, as a function of the total
i i i
equivalent link flows (v = vCAR + 3vTRUCK, for i=1,2) are given by:
and both links are 1 unit in length. Trucks are assumed to value distance twice as much as delay in their cost definition, whereas cars only value it the same as delay. On any link, the Jacobian of UC costs with respect to UC flows in not positive definite - trucks have a greater influence on car costs than car flows do - and in fact there are an infinity of deterministic equilibria. However, the Jacobian of link delays with respect to total link flows is separable and positive definite, and
1
the unique deterministic equilibrium in terms of total link flows is at approximately v =96.7.
However, there is a unique stochastic equilibrium with respect to UC flows : for example, with7
i i
ß=1 at vCAR=63.5 and vTRUCK=9.5.
2.4 Multiple user class example 2
The following two-user class example is due to Netter (1972, Example 1, p414). Denoting the
ki ki
flow and perceived cost of user class k on link i by v and c respectively, then:
11 11 21
c = 0.5 v + 5 v + 6
21 11 21
c = 0.3 v + 0.6 v + 0.8
12 12 22
c = 0.5 v + 3 v + 10
22 12 22
c = 0.2 v + 0.4 v + 4
and the OD demand flow for user class 1 and 2 is assumed to be 16 and 4 respectively. The dominance of user class 2 flows over the perceived costs of user class 1 means that the positive definiteness condition is certainly violated; furthermore, the costs are clearly not of the pce-type studied above. This problem has two stable deterministic equilibria - corresponding to the cases where the total demand of 20 is all routed via link 1 or all via link 2 - and one unstable
equilibrium, where the user class OD demands are evenly split between the two routes.
This example is due to Daganzo (1983, p 294-5). The demand T on a single OD pair is assumed to choose between bus and car according to a demand function. In the traffic model, a bus is assumed to have the same effect on delays as two cars. The bus operates at a fixed frequency on a fixed route, and so - because link delays are assumed to be linear functions of total equivalent car link flows - has a fixed effect on delays. The cost of travel by car is assumed to be equal to the delay, and that by bus equal to twice the delay. Daganzo also proposes a 3-link network
structure for the problem, although this is somewhat artificial due to the use of one link with zero delay. In fact, it is easy to show that these assumptions are equivalent to a single-link network with cost functions:
where the demand of T person trips is split according to a logit demand function:
In the form given above, the violation of the positive definiteness condition is clear. As
2
6
4
, thedemand function approaches a deterministic rule; in the limit there are 3 equilibria, 2 stable
CAR CAR 2
ones at v = 0 and T, and an unstable one at v = / . As mentioned by Daganzo, for large butT
finite
2
there are three corresponding stochastic equilibria.2.6 Responsive signals example
This example, adapted from Smith (1979a), considers two parallel routes that meet at a
signalised intersection working on a fixed cycle time
6
. For each link i (i=1,2), the share of greeni
time
8
is chosen in response to the prevailing flows, following Webster's method:where 0<g<1 is a minimum green-time share (added here to Smith's example to avoid problems
i i i i i
of an undefined delay function at zero green time) and y = v/s, with v and s respectively the
flow and saturation flow. Since green time proportions sum to 1, there is an implicit assumption of no "lost time", and that links cannot have green simultaneously. It is supposed that link costs are given by Webster's two-term formula for expected delay:
i i i
This formula applies when link flows are within capacity (v <
8
s), but not for over-capacityflows. Smith considers this "supply-infeasibility" problem in some detail, but it is not of direct
2
1 2
considered here, since then all demand-feasible flow allocations satisfy y + y < 1, implying that
i i i
the green times given by Webster's control method will always satisfy v <
8
s. The minimum1
green time value (g=0.01) used in the tests below, together with the assumed values for s and
2 i i
s, will not cause any problems either, since all flow allocations satisfy v < (1-g)s.
1 2
Smith assumed further that s=1 and s =2, but did not specify the value used for
6
in his tests.With an OD demand of 0.5 the link flows will be in the range 0 to 0.5, and this is not an
unreasonable range for flows measured in vehicles per second. Therefore, it seems reasonable to
assume
6
to be measured in seconds;6
=60 is used below. Finally, it will be convenient for latertests to be able to use different OD demand levels. In fact, the same equilibrium proportions of
i
demand arise if we assume an OD demand T, provided any link flow v* arising is scaled before
i i
substitution in the cost function: v = v* / 2T . Assuming T=100, three deterministic equilibria
1
arise: two stable ones at the all-or-nothing solutions and one unstable equilibrium around v =
33.67. For ß > 0.13, there are three corresponding stochastic equilibria.
2.7 Dynamic choice models
"Dynamic models" consider the within-day variation in time of traffic flows and driver choices. Asymmetric interactions may arise here due to flows in one time period leading to queues that delay those in later time periods (similar interactions occur when rail/air departures are delayed - see Carey and Kwiecinski, 1994). For example, consider arrivals at a single bottleneck of
i
capacity c vehicles/hour, where the arrival rate in time period i is v vehicles/ hour (i=1,2) and
where each interval is of length t hours. Supposing first-in-first-out (FIFO) queuing discipline
2
applies, the delay to period 1 arrivals may be calculated independently of v : The queue at time t
1 1 1
will rise to q =max(0,(v-c)t), subsequently requiring a time q /c to disappear. By deterministic
queuing theory, the average delay is the integral of this piecewise-linear queuing profile, divided by ct:
Considering now both time periods, the queue at the end of time period 2 will be
2 1 2 2 2
q =max(0,q +(v -c)t). If q>0, this queue will subsequently disappear in a further time q /c. If
2 1 2
q =0, the queue disappeared during time period 2, at a time q /(c-v) after the end of time period
1 2 2 1
If v<c, d is a function of v only. The case v>c is more interesting, and supposing further that
1 2
v+v>2c, the Jacobian of time period delays with respect to time period flows is:
1 2 1 2
Clearly, for c<v< /3 c, an increase in v has a greater marginal effect on d than an increase in
2 v.
In spite of the above asymmetry, it seems difficult to create examples with multiple equilibria. For example, a simple application of this model is equilibrium departure time choice. We assume drivers have no initial preference for a departure time, value cost purely in terms of queuing delay, and that their departure time is the same as their arrival time at the bottleneck.
1 2 60 1
Assuming T=v+v=200, c=60 and t= / , the unique equilibrium is at approximately 5 v =134.8.
Indeed, existence and uniqueness of an equilibrium departure time distribution for a single bottleneck is guaranteed by the work of Fargier (1983), though little is known for more general networks (Alfa, 1986). Similar issues arise in dynamic assignment modelling (see Jayakrishnan et al, 1995, for a recent review), although intuitively the potential for such interactions is
8 Smith is the only one to offer a proof of convergence to the set of equilibrium solutions for a general network, under the specialised form of dynamic process he proposed.
3. STOCHASTIC PROCESS (SP) MODELS OF TRAFFIC ASSIGNMENT
3.1 Introduction
We have so far assumed that an assignment problem is adequately characterised by its states of long-term equilibrium. A number of authors have also considered the dynamic evolution of this system towards points of deterministic (eg Smith, 1984b) and stochastic equilibrium (eg Alfa et
al, 1979; Horowitz, 1984; Ben-Akiva et al, 1986; Vythoulkas, 1990; Emmerink et al, 1994) .8
These are all essentially deterministic process (DP) models. For consider, as an example, the
within-day static traffic assignment problem. A dynamic model of evolution toward stochastic equilibrium has the following general structure:
1. [Initialisation] Set time period (eg day) counter k=0. Assume some initial mean perceived link costs.
2. [Demand-side] Increment k. Based on the current mean perceived costs and the
assumed probability distribution of perceived costs, calculate the expected (mean) route
flows and hence the mean link flows for period k.
3. [Supply-side] Calculate the experienced link costs for period k arising from the mean flows in 2 (eg from cost-flow relationships).
4. [Learning] Update the mean perceived link costs, based on the new experiences in step
3 (eg via some kind of weighted average of experienced costs in at most the last m
periods, for some given m). Return to step 2.
For given initial costs, the evolution of this system may be precisely determined, ie it is indeed deterministic. If the model reaches a stable stochastic equilibrium state, the flows and costs in subsequent periods will never change. Note that the flow expectations in step 2 are conditional ones, given the starting conditions in step 1. There is no claim that if a stochastic equilibrium is reached, it will be invariant with respect to the starting conditions.
In contrast, Cascetta (1989) considered the dynamic evolution as a discrete time stochastic
process (SP). In this case, steps 2 and 3 above are replaced by:
2'. [Demand-side] Increment k. The current mean perceived costs and the assumed
probability distribution of perceived costs together define a joint probability distribution
for route, and thence link, flows. The link flows in period k are random variables,
following this distribution.
3'. [Supply-side] Calculate the experienced link costs for period k arising from the flows in 2' (eg from cost-flow relationships).
Note the important distinction between 3 and 3' - the former takes as input the mean flows, whereas the latter is based on the flow random variable, implicitly taking account of the whole probability distribution of flows rather than just a mean value. In this case, the evolution of the system from a given starting condition can only be determined according to a probability law, ie
it is indeed stochastic. The analogue of an equilibrium state in a DP model is here a stationary
9 The term `state' should be clarified. In equilibrium and DP approaches, it refers to any assignment of link flows to the network that is feasible with the OD matrix, where flows may be fractional. In SP approaches, it may be variously defined, but is always in terms of discrete variables, such that the number of feasible states is finite. For example, in a two-link single OD problem with an integer demand T, there are 2 possible (micro-) states at the individual route choice level,T corresponding to all the possible combinations of choices of the T individuals on any one day. When referring to SP models in this paper, we will typically consider a macro-state description in terms of total link flows, giving T+1 possible states in this example.
of the different system states. Reported applications of SP models, while sparse in the assignment literature, have been reported in behavioural choice problems in other transport fields (see Kitamura, 1988, and Hensher, 1988, and the references therein) and the social
sciences in general (see the review of De Palma and Lefèvre, 1987). The distinctive feature of the present application -namely disutilities with non-separable asymmetric interactions - appears, however, to set it aside from previous studies.
SP models differ in a number of ways from DP and stochastic equilibrium models, not all of
which are immediately apparent. For example: the absolute magnitude of origin-destination
flows affects the relative sizes of route flows in the former, but not in the latter two approaches; likewise, SP models treat OD flow variables as discrete, rather than continuous. See Cascetta
(1989) for a discussion of other differences. In spite of this, similar tools are useful for solving
these problems in practice, notably stochastic network loading procedures based on Monte Carlo methods. The use of these in probit-based stochastic equilibrium approaches is well-documented (Sheffi, 1985), and a similar approach may be adopted in DP models for approximating step 2:
The OD demand is divided into N equal parts, each is assigned to a route based on cost
minimising rules given a pseudo-random sampling from the perceived link cost distribution, and finally the resulting flows are combined. The result will therefore have a pseudo-random
element, meaning that at stochastic equilibrium the subsequent flows may still vary. It should be recognised, however, that this is purely an error of estimation, rather than a representation of
real variability, since by choosing an extremely large value of N the error is made negligible.
In SP models Monte Carlo methods may be used in a subtly different way, to generate a
pseudo-random "observation" of the whole process (referred to as a realisation) over some given time
horizon. In practice, at step 2', we perform the same stochastic loading procedure as above for
ij
each day, except that we must divide the (discrete) demand for OD pair (i,j) into T parts, each
part representing a single individual. In this case, the generated flows will continue to vary, even when the stationary stage is reached; the observed variance is an intrinsic feature of the SP approach, and (as the results in 3.2 establish) provide an estimate of the stationary variance in the underlying process.
3.2 Existence, uniqueness, stability and ergodicity
Cascetta (1989) established a number of powerful results in relation to SP assignment models.
He imposed various conditions on the `route choice probabilities', these latter defined for each k,
as the time period k probabilities of any user choosing the various routes available, given the
10 W e note in passing an interesting analogy between this communication condition and a global stability property studied by Smith (1979b) in the context of deterministic equilibrium.
(i) are time homogeneous, ie depend only on the sequence of previous states, not on the
(absolute) periods in which these occurred;
(ii) are strictly positive for all feasible routes; and
(iii) do not depend on more than a finite number of previous states.
An implication of (i) is that the average demand matrix must be constant over time, and (iii) implies that potential users will at some stage start to `forget' experiences. (ii) is satisfied by conventional stochastic choice models, such as logit or probit, and ensures that states
"communicate" (any state may be reached from any other) . Cascetta proved that if these rather10
weak conditions were satisfied, then the resulting process would possess a unique stationary probability distribution, that is independent of the starting conditions and - once the stationary period is reached - the elapsed number of days. Furthermore, under these conditions the process is `ergodic'. This implies, for example, that stationary flow means and variances of the
underlying process may be estimated from the stationary part of a single pseudo-random
realisation.
These results are powerful for a number of reasons, since they hold for various definitions of `state', including individual route choices, route flows and link flows; and for individual vehicle microsimulation models as much as aggregate cost-flow relationships. Most notably, there is no explicit restriction on the supply-side. That is to say, a unique stationary probability distribution is guaranteed to exist even for asymmetric indefinite cost functions and problems with multiple conventional equilibria. However, a critical point is that all these are asymptotic properties, holding over infinite time. As we shall see in section 4, over extremely long but finite periods, such models may exhibit rather different behaviour.
3.3 The SP approach for separable problems
Some attention has been paid in the past to properties of SP models, though under the implicit assumption of separable costs and/or a unique conventional equilibrium. This work is important to mention, primarily to clarify a number of critical distinctions with the non-separable case (section 4). Davis and Nihan (1993) showed that a SP assignment model may, under certain conditions, be approximated by the sum of a DP and a Gaussian SP. Further, they note that `the stationary distribution for the [approximating] process will also be Gaussian, with a mean equal
to the [sic] deterministic fixed point', proposing an additional assumption whereby this fixed
point `is the stochastic user equilibrium'.
n n n
they considered a two-link network with cost functions c (v )=a+bv (n=1,2; b>0) and OD
demand T, where the unique deterministic (and stochastic) equilibrium is clearly T/2. Assuming
a logit rule with dispersion parameter ß=1 and a driver learning model with m=1, it was shown
that the stationary distribution of a SP approach was unimodal or bimodal according to b<2/T or
b>2/T.
This latter (bimodal) example may seem surprising, particularly in the light of Davis and Nihan's intuitively appealing Gaussian approximation. In fact, it is important to understand that this is a pathological example, due partly to the `sharp' effect on costs of drivers changing route, and partly to the implied variance in perceived costs being small. On the first point: in real networks, link flows are made up of a number of route flows, meaning costs are less sensitive to changes in one route flow. On the second point: the bimodality condition may
equivalently be interpreted as b=1 and ß>2/T, recalling that in the logit model the variance in
perceived costs is proportional to 1/ß. As ß becomes extremely large but finite, drivers tend to
behave identically on any given day, and from
any given initial conditions a simulation of this process will be seen to oscillate perpetually on
1
alternate days between v =0 and T (or states close thereto). Although such periodic behaviour is
unstable in a deterministic sense, it is the stationary behaviour of the SP, since the
probabilities of occupying the different states on any randomly selected day are stable
1
(approximately, probability of 0.5 for states v =0 and T, and zero for other states). See also
Horowitz (1984) for a similar example with a DP model.
An alternative way of characterising the two types of behaviour above - and one that will prove
useful in later examples - is in terms of the one-step transition probability matrix. This is the
(T+1)x(T+1) matrix P with (i,j) element given by the conditional probability:
ij 1 1
P = Pr (v =j today | v =i yesterday) (i=0,1,...,T; j=0,1,...,T)
which is uniquely defined because we have assumed m=1 ("the Markov property"), as:
w he re
i
q
is given by the assumed route choice rule, in this case the logit probability Fo
r ex a
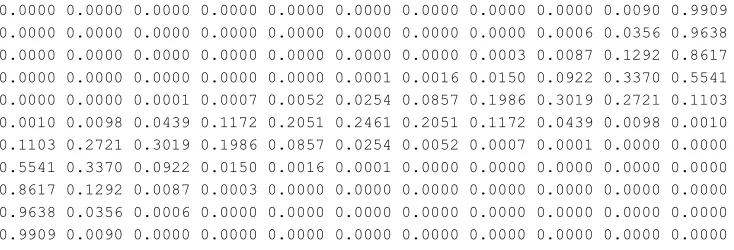
mple, with T=10, b=1, and ß=0.1 (upper) or ß=0.7 (lower), this matrix is (to 4 d.p.):
0.0000 0.0001 0.0007 0.0048 0.0227 0.0740 0.1677 0.2605 0.2655 0.1604 0.0436
0.0000 0.0002 0.0018 0.0109 0.0423 0.1129 0.2093 0.2662 0.2222 0.1099 0.0245
0.0000 0.0006 0.0047 0.0227 0.0722 0.1580 0.2398 0.2497 0.1706 0.0691 0.0126
0.0001 0.0016 0.0109 0.0432 0.1127 0.2018 0.2508 0.2138 0.1196 0.0397 0.0059
0.0003 0.0042 0.0229 0.0747 0.1597 0.2341 0.2383 0.1663 0.0762 0.0207 0.0025
0.0010 0.0098 0.0439 0.1172 0.2051 0.2461 0.2051 0.1172 0.0439 0.0098 0.0010
0.0025 0.0207 0.0762 0.1663 0.2383 0.2341 0.1597 0.0747 0.0229 0.0042 0.0003
0.0059 0.0397 0.1196 0.2138 0.2508 0.2018 0.1127 0.0432 0.0109 0.0016 0.0001
0.0126 0.0691 0.1706 0.2497 0.2398 0.1580 0.0722 0.0227 0.0047 0.0006 0.0000
0.0245 0.1099 0.2222 0.2662 0.2093 0.1129 0.0423 0.0109 0.0018 0.0002 0.0000
Fig 1: Transition probability matrix (separable costs: T=10, b=1, ß=0.1)
0.0000 0.0000 0.0000 0.0000 0.0000 0.0000 0.0000 0.0000 0.0000 0.0090 0.9909
0.0000 0.0000 0.0000 0.0000 0.0000 0.0000 0.0000 0.0000 0.0006 0.0356 0.9638
0.0000 0.0000 0.0000 0.0000 0.0000 0.0000 0.0000 0.0003 0.0087 0.1292 0.8617
0.0000 0.0000 0.0000 0.0000 0.0000 0.0001 0.0016 0.0150 0.0922 0.3370 0.5541
0.0000 0.0000 0.0001 0.0007 0.0052 0.0254 0.0857 0.1986 0.3019 0.2721 0.1103
0.0010 0.0098 0.0439 0.1172 0.2051 0.2461 0.2051 0.1172 0.0439 0.0098 0.0010
0.1103 0.2721 0.3019 0.1986 0.0857 0.0254 0.0052 0.0007 0.0001 0.0000 0.0000
0.5541 0.3370 0.0922 0.0150 0.0016 0.0001 0.0000 0.0000 0.0000 0.0000 0.0000
0.8617 0.1292 0.0087 0.0003 0.0000 0.0000 0.0000 0.0000 0.0000 0.0000 0.0000
0.9638 0.0356 0.0006 0.0000 0.0000 0.0000 0.0000 0.0000 0.0000 0.0000 0.0000
0.9909 0.0090 0.0000 0.0000 0.0000 0.0000 0.0000 0.0000 0.0000 0.0000 0.0000
Fig 2: Transition probability matrix (separable costs: T=10, b=1, ß=0.7)
The matrix in Fig 1 has a balanced look, most states transforming into any other state with a non-negligible probability. In Fig 2, however, the probabilities are more closely concentrated on the
1 1
second diagonal; for example, states v =0, 1 and 2 are highly likely to transform into v =10, and
vice versa. It can be shown that in general, the strength of this imitation is reduced by reducing
ß or increasing m.
3.4 Large problems and Monte Carlo simulation of the SP approach
i
In the logit-based example considered in section 3.3, the choice probability q could be computed
analytically, and because the network had only two links, the transition probabilities were seen to follow a simple Binomial distribution. In such a case, the simplest way to generate a Monte Carlo realisation of the process is to repeatedly simulate the link flow directly from a binomial distribution. This technique is used, for analytical convenience, in the examples throughout this paper. An alternative technique, that produces just the same sort of results as those discussed later,
would be - for each individual 1,2,...,T - to sample a perceived cost from an independent Weibull
i
probability distribution (with mean c) on each link, and to assign that individual to the link with
the lowest perceived cost. In this way, link flows are an aggregation of individual choices. The equivalence of these two techniques has been long-established in the random utility theory literature.
Other stochastic choice models may, of course, be implemented in a similar way: for example, assuming a Normal distribution of link costs gives rise to a probit model. The probit approach has the advantage that, in larger networks, it does not suffer from any of the well-documented deficiencies of the logit approach (Sheffi, 1985). Moreover, the technique described above, whereby individual choices are explicitly simulated, may be extended in an obvious way to general networks
ij ij
with Normal link cost distributions. In this way, one day of the SP approach requires
G
Tinvestigation, is to employ the recent work of Maher (1992), whereby probit choice probabilities may be computed without the need for individual simulation).
The author has applied the individual choice simulation approach to a (separable) problem with some 440 links, 70 zones, and 20000 individuals, and has obtained reasonable run-times with the latest generation of personal computers. It should be recognised, however, that the run-time is clearly highly dependent on the number of days simulated. In separable problems, simulations have been observed to stabilise rapidly around the stationary position, usually in 20-50 days. As we shall see in section 4.4, asymmetric problems may behave quite differently, and this emphasises the need to gain a better understanding of such approaches in small networks, where simulating a large number of days is feasible.
4. STOCHASTIC PROCESS MODELS IN ASYMMETRIC PROBLEMS
In this section we examine SP models in relation to the asymmetric examples considered in section
2, in three main ways. Consider the simplest case m=1, then the (T+1)-vector r* - denoting the
unknown stationary probability distribution of the link 1 flow - satisfies:
r = P r* t *
where P is the transition probability matrix, as defined in section 3.3, and the superscript `t' denotes
the transposition operator. This fixed point problem defines a system of T linear equations in T
unknowns (one constraint and variable is deleted, since the elements of r* must sum to 1), that may then be solved by any standard technique, eg Gaussian elimination (Barnett, 1990).
Alternatively, we may examine the evolution of the SP from some given initial conditions. Let the
(T+1)-vector r(k) denote the probability distribution of the link 1 flow at the end of day k, where r(0)
is the given initial condition. Still considering only the case m=1, the evolution of the probability distribution is calculated recursively from:
r(k+1)= P rt (k) (k=0,1,2,...).
r(0) is either defined explicitly, or as a point distribution (ie probability mass 1 at an "initial flow of
1
v(0) "), or implicitly as the distribution corresponding to some initial mean perceived costs.
For m>1, the notation is more messy but the principles are similar, so only the outline is given here. The probability of occupying a state on day k now depends on the states occupied on days k-1, k-2,
ij i
where v(s) is the link 1 flow on a previous day s. On any day k>m (to be more general replace m by min(k,m)), a transition is now an m-step one, from one of the (T+1)m possible combinations of states
which could have occurred in the previous m days.
In addition to solving directly for the stationary distribution and to calculating the exact evolution of the probability distribution, a third method of analysis is considered: simulation of the process using Monte Carlo methods (see comments at the end of section 3.1). This will almost certainly be the only feasible method of implementing the SP approach with networks / demand levels of a realistic size.
4.1 The stationary distribution
In cases where conventional stochastic equilibrium models lead to a unique solution, we have seen that, except in extreme cases, the stationary distribution of a SP model is unimodal with a mean approximated by the equilibrium solution. A natural extension to cases of multiple equilibria is to expect the distribution to be bimodal, with peaks approximated by the stable equilibria. For the multi-modal problem 2.5, this is indeed the case, with the perfectly symmetric form illustrated in Fig 3.
Fig 3: Stationary distribution for multi-modal example (T=10,m=1,
2
=3.0).CAR
The stable stochastic equilibria are at v =0.03 and 9.98 in this case. Not surprisingly by its
definition, the unstable equilibrium is not significant. For larger m (eg m=3 or 10) and/or large but smaller
2
(eg2
=1.5), the distribution is flatter but still clearly bimodal. Similar comments apply to the multiple user class example 2 (section 2.4). A little more interesting is Cascetta's example (2.1),Fig 4: Stationary probability distribution for Cascetta's example (m=1).
1 1
Taking an arbitrary division into {v : v=9,10} and the remaining states (as we see later, this turns out not to be so arbitrary), the SP approach may be considered to be saying that in the long term, from arbitrary starting conditions, states in the region of the upper stable equilibrium are around 4 times as likely to occur (probability 0.8) as those around the lower equilibrium. The stationary mean can be regarded as some kind of weighted average of the equilibria, although it could be questioned whether the mean is an appropriate measure to use in such circumstances. These
powerful results, on the global attractiveness of the possible states, could not be obtained from an
equilibrium analysis, which is essentially "static" and only considers local measures of attractiveness (stability).
This predominance of one of the equilibrium solutions is even more exaggerated in the responsive signals (2.6; see Watling, 1995) and priority junction (2.2) examples. In the former case, multiple stochastic equilibria arise for ß not too small. In spite of this, the stationary distribution is, for all practical purposes, exclusively concentrated in the vicinity of the upper equilibrium. For example,
1
for T=100, ß=0.13, m=1, this upper equilibrium is at v=98.90, whereas the stationary mean and
standard deviation are 98.34 and 1.76 respectively. Similar behaviour occurs in the priority junction example; the lower of the equilibria completely dominates here.
These examples illustrate that the SP approach has clear benefits in cases of multiple conventional equilibria, not only identifying them but providing insights into their relative plausibility. We attempt to understand these examples a little further in the following section, before discussing some of the difficulties in the implementation of the SP approach.
4.2 The transition probability matrix
characterising similar dynamic behaviour. (A suggestive reason to expect they may be different is
gained from the comments on increasing m, which in 3.3 was seen to smooth out the bimodality,
whereas in, for example, the multi-modal case above the bimodality remains but is slightly less peaky). Consider, for example, the multi-modal problem (2.5):
0.6152 0.3063 0.0686 0.0091 0.0008 0.0000 0.0000 0.0000 0.0000 0.0000 0.0000
0.4196 0.3807 0.1554 0.0376 0.0060 0.0006 0.0000 0.0000 0.0000 0.0000 0.0000
0.2166 0.3580 0.2663 0.1174 0.0340 0.0067 0.0009 0.0001 0.0000 0.0000 0.0000
0.0719 0.2165 0.2934 0.2357 0.1242 0.0449 0.0113 0.0019 0.0002 0.0000 0.0000
0.0126 0.0691 0.1706 0.2497 0.2398 0.1580 0.0722 0.0227 0.0047 0.0006 0.0000
0.0010 0.0098 0.0439 0.1172 0.2051 0.2461 0.2051 0.1172 0.0439 0.0098 0.0010
0.0000 0.0006 0.0047 0.0227 0.0722 0.1580 0.2398 0.2497 0.1706 0.0691 0.0126
0.0000 0.0000 0.0002 0.0019 0.0113 0.0449 0.1242 0.2357 0.2934 0.2165 0.0719
0.0000 0.0000 0.0000 0.0001 0.0009 0.0067 0.0340 0.1174 0.2663 0.3580 0.2166
0.0000 0.0000 0.0000 0.0000 0.0000 0.0006 0.0060 0.0376 0.1554 0.3807 0.4196
0.0000 0.0000 0.0000 0.0000 0.0000 0.0000 0.0008 0.0091 0.0686 0.3063 0.6152
Fig 5: Transition probability matrix for multi-modal example (T=10,m=1,
2
=1.5).The probability mass in Fig 5 is concentrated on the leading diagonal (even more so for larger
2
),whereas in Fig 2 it is focused on the second diagonal. That is to say, in the case above there is a high probability that today's flows will be in the vicinity of yesterday's. In one respect this is not surprising, since it is in essence what we mean by the local stability of equilibria in conventional models. Transition matrices of this type also underlie examples 2.2, 2.4 and 2.6.
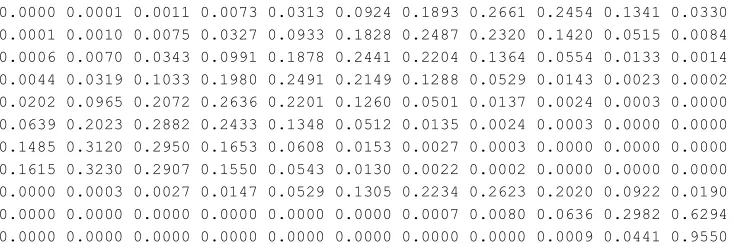
Cascetta's example (2.1) is also interesting to study:
0.0000 0.0001 0.0011 0.0073 0.0313 0.0924 0.1893 0.2661 0.2454 0.1341 0.0330
0.0001 0.0010 0.0075 0.0327 0.0933 0.1828 0.2487 0.2320 0.1420 0.0515 0.0084
0.0006 0.0070 0.0343 0.0991 0.1878 0.2441 0.2204 0.1364 0.0554 0.0133 0.0014
0.0044 0.0319 0.1033 0.1980 0.2491 0.2149 0.1288 0.0529 0.0143 0.0023 0.0002
0.0202 0.0965 0.2072 0.2636 0.2201 0.1260 0.0501 0.0137 0.0024 0.0003 0.0000
0.0639 0.2023 0.2882 0.2433 0.1348 0.0512 0.0135 0.0024 0.0003 0.0000 0.0000
0.1485 0.3120 0.2950 0.1653 0.0608 0.0153 0.0027 0.0003 0.0000 0.0000 0.0000
0.1615 0.3230 0.2907 0.1550 0.0543 0.0130 0.0022 0.0002 0.0000 0.0000 0.0000
0.0000 0.0003 0.0027 0.0147 0.0529 0.1305 0.2234 0.2623 0.2020 0.0922 0.0190
0.0000 0.0000 0.0000 0.0000 0.0000 0.0000 0.0007 0.0080 0.0636 0.2982 0.6294
[image:19.596.116.485.435.560.2]0.0000 0.0000 0.0000 0.0000 0.0000 0.0000 0.0000 0.0000 0.0009 0.0441 0.9550
Fig 6: Transition probability matrix for Cascetta's example (m=1).
In Fig 6 we may identify a set of states (eg {9,10}) in a small block in the bottom right corner that are `locally attractive', ie highly likely to transform into a state in the same set. There is a clear, though less distinct, block in the top left corner (eg corresponding to states {1,2,3,4,5,6,7}), with only a small number of states offering the opportunity for communication between these attracting regions. This begins to raise some doubts about the reasonableness of Cascetta's irreducibility condition (ii) in section 3.2. Although all transition probabilities are in fact non-zero, a number are extremely small (we return to this issue later).
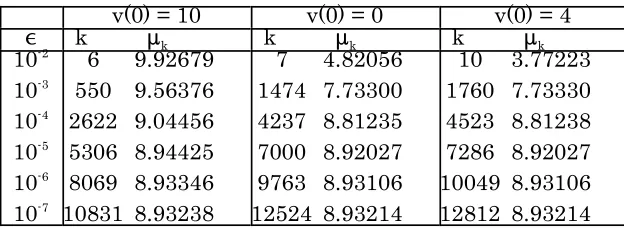
For Cascetta's problem (2.1) with m=1, table 1 illustrates the convergence rate to the stationary distribution under various starting conditions.
v(0)=10 v(0)=0 v(0)=4
k k k k k k
,
k:
F
k:
F
k:
F
10-2 10-3 10-4 10-5 10-6 10-7
51 9.14591 2.18725
133 8.86969 2.48152
223 8.83534 2.51359
312 8.83195 2.51670
402 8.83161 2.51701
491 8.83158 2.51704
92 8.45621 2.81589
181 8.79356 2.55142
271 8.82782 2.52048
360 8.83119 2.51739
450 8.83154 2.51708
102 8.45150 2.81913
192 8.79406 2.55097
281 8.82778 2.52053
371 8.83120 2.51739
[image:20.596.141.453.631.746.2]460 8.83154 2.51708
Table 1: Convergence to stationarity for Cascetta's example (m=1)
On each day, the whole probability distribution is calculated, but for illustration only its mean and
standard deviation are reported.
,
refers to the change in the mean and standard deviation betweenday k and day k-1. The results verify Cascetta's theorem, that the stationary probability
distribution (and hence the stationary values of
:
andF
) is independent of the starting conditions. In the case v(0)=10, the process is first attracted towards values close to the higher of the two stable stochastic equilibrium states, and then is gradually drawn down in the direction of the lower stable equilibrium. For v(0)=0 and 4, closer to the lower equilibrium, this behaviour is reversed (this is clearer from examining earlier days in the process, not shown here). This is consistent with the intuitive explanation of the approach, that - although it finds the stable equilibria attractive - it attempts to settle down in a position which is a compromise (weighted average) between the two. The most important feature of these results is, however, that convergence is quite slow. When thebetween-day difference in (
:
,F
) first drops below 10 , even though the differences thereafter-2continue to fall (this is not a chance fluctuation, with convergence in later days monotonic), it takes
k k
many more days before
:
andF
truly approximate their stationary values to within a 10 error.-2As m becomes larger, the convergence rate slows disproportionately. Table 2 shows the convergence
pattern for m=3. Unfortunately, it did not prove computationally feasible to study m=10 in this way, the value used by Cascetta (in this case there are 11 possible combinations of 10-day period states10
that need to be considered in computing the transitions). However, we can certainly say that
convergence would be incredibly slow, and certainly slower than for m=3. This is because, as m
increases, with a high probability the process spends longer periods around each attracting region,
since a longer sequence m of `extreme' experienced costs is required to change the mean perceived
costs significantly. See section 4.4 for a consideration of larger m.
v(0) = 10 v(0) = 0 v(0) = 4
k k k
,
k:
k:
k:
Table 2: Convergence to stationarity for Cascetta's example (m=3)
In examples 2.2, 2.4, 2.5 and 2.6 a similar pattern emerges, with convergence tending to slow down considerably with an increase in m, and for similar reasons an increase in ß (
2
in example 2.5), since both reduce the variance in flows around an attracting region and thereby the probability that these regions will communicate. Furthermore, this convergence rate may be dependent on the initialconditions, most notably in the responsive signals example (2.6). For example, with ß=0.13 and m=1
1
and a starting condition of v (0)=50 or 100, less than a hundred days are required to attain the
1
stationary mean and standard deviation to two decimal place accuracy, whereas with v(0)=0 around
50000 days are necessary. For higher ß, such as ß=0.3, the problem was more serious - starting from
1
v(0)=0, after 100000 days virtually all the probability mass was concentrated in the states 0-8,
whereas the stationary distribution has virtually all probability in states 92-100. It was estimated that at this stage, the probabilities for states 92-100 were increasing at an approximately linear rate
of around 10 per day.-26
4.4 Monte Carlo simulation of the process
In networks of a realistic size, none of the techniques in 4.1-4.3 will be feasible. On the other hand, Monte Carlo simulations are very simple to program and implement and, as discussed in section 3.4, converge rapidly in separable problems, even in large networks (eg Timms and Watling, 1993). As we may expect from the comments in 4.3, asymmetric problems unfortunately pose greater difficulties. Consider first, however, an asymmetric case where the simulation approach works as
expected. A typical such simulation, from Cascetta's example with m=1, is illustrated in Fig 7.
Fig 7: Simulation of Cascetta's example (m=1), post-100-day mean beneath.
1 1 Since in the bimodal cases such as that in Fig 3, the stationary mean is unrepresentative of any likely system state, fundamental questions are raised as to the applicability of evaluation measures (eg economic, user-benefit) based on mean flows/costs. Ideally, these measures should take account of the whole stationary distribution, rather than just a mean, and should at the very least allow the input of multiple modes of the distribution with weights estimated from the stationary distribution.
are proportional to the average length of time each region is occupied). That is to say, the transitions illustrated are an integral part of the stationary behaviour. The simulation reaches a position reasonably close to the true mean (8.83) between days 300 and 400, having only occupied each attracting region for two or three periods.
As m is increased, the average "sojourn" around each region increases in duration. It does not take
too large a value of m before the typical length of a single sojourn exceeds a reasonable number of
days to simulate, giving rise to a biased estimate of the stationary behaviour. For example, with
m=10, in simulations of length 1000 days (first 100 discarded in forming the mean) and a starting
1
state of v(0)=10, fifty different simulations (random seeds) all gave rise to an apparently stable
1
mean flow on link 1 in the range 9.93-9.96. With a starting state of v (0)=0, however, 38 of the
simulations reached a stable mean flow in the range 3.59-3.69, and 12 in 9.93-9.96. For a single simulation, the only indication of non-stationarity was a hardly-discernible trend in the mean flow to approach the other attracting region as the simulation progressed.
Therefore, over a long time horizon simulations may attain one of two "pseudo-stable" positions, depending on the starting conditions and random number seed. The results reported by Cascetta (1989) for this example - where a unique stationary mean was obtained from such simulations - are either atypical or were obtained from an enormous number of days. In any case, they cause users to be dangerously over-optimistic when applying such techniques to asymmetric problems; certainly, a great deal of care is needed.
Similar behaviour was observed in simulations of examples 2.2, 2.4, 2.5 and 2.6. Even regions that are asymptotically insignificant (ie in terms of the stationary distribution) may be attractive for long
1
periods. For example, in the responsive signals example (2.6) with m=1, ß>0.15 and v (0)=0,
simulations may occupy only states in the vicinity of the lower stochastic equilibrium solution for many thousands of days, even though these have negligible probability in the true stationary distribution.
5. CONCLUSION
There is a range of asymmetric traffic assignment problems of practical interest that may possess multiple deterministic or stochastic equilibrium solutions. In stochastic process models, however, these problems give rise to a unique stationary probability distribution, as established by Cascetta. In simple examples studied in the current paper, this distribution was seen to have peaks
approximated by the stable equilibria . Equally, however, some examples were seen to possess a11
in the sense that the stochastic process will ultimately approach it from arbitrary starting conditions.
The stochastic process approach therefore has appealing asymptotic properties, but the rate of convergence to stationarity may be extremely slow. The irreducibility condition of Cascetta's theorem requires that all states communicate with a non-zero probability; while this holds under traditional stochastic choice rules, some probabilities may be extremely small. The effect is best observed in Monte Carlo simulations of the process, where for thousands - even hundreds of thousands - of days, a pseudo-stable type of behaviour prevails, with flows varying about an apparently stable mean close to one of the equilibrium solutions. Different pseudo-stable behaviour (ie varying close to different equilibria) may be exhibited depending on the initial conditions, and in different realisations of the process from the same initial conditions.
In practice, when using a stochastic process simulation to estimate the stationary distribution of an asymmetric problem, it is clearly necessary that a range of initial conditions and random number seeds be tested, and advisable that at least one extremely long simulation be performed. A simulation should first be run with the model parameters set to values that give rise to the highest
behavioural variance (m=1 and small ß in the model considered in the current paper), since this
gives the greatest chance of transition between multiple attracting regions.
Alternatively, such simulations may be used to estimate a transient (yet pseudo-stable) probability
distribution over a specified time-scale from some given initial conditions. The initial conditions will need to be carefully chosen, eg in a study of a hypothetical network change, the starting conditions for the current year, do-something run could be observed conditions on the street. A sensitivity analysis with respect to the seed value is still required. In addition, it may be appropriate for the `days' to assume a less abstract form in order to justify the choice of evaluation time-scale, perhaps coarsely representing seasonal variations in weekday travel demand. From a methodological point of view, should we wish to deter transitions between pseudo-stable regions caused by small network changes, the use of variance reduction techniques (Rathi, 1992) or explicit behavioural rules based on notions of inertia (Mahmassani and Jayakrishnan, 1991) may be appropriate.
It is an open question as to whether real-life networks exist with multiple equilibrium/ pseudo-stable solutions, except in so far as the simple examples considered here coarsely represent movements on an isolated OD pair. In larger networks, routes for different OD movements typically overlap, meaning that link flows (and hence costs) are less affected by a change for a single OD pair. Intuitively, this smaller variance will cause transitions between attracting regions to occur with an even lower probability. In practice, equilibrium algorithms are currently applied to asymmetric indefinite problems without regard to the issue of multiple solutions. Given the number of ready-calibrated networks for equilibrium analysis, there is clearly a good deal of research potential in applying the stochastic process approach to these, notwithstanding the difficulties in monitoring and interpreting the simulations.
This work was supported by funding from the Engineering and Physical Sciences Research Council of Great Britain. I would like to thank David Grey, Mike Smith and Dirck Van Vliet for a number of stimulating discussions during this work, and Ennio Cascetta for his comments on some earlier results of the research. The views expressed in the paper are, however, the responsibility of the author alone.
REFERENCES
AASHTIANI, H.Z. & MAGNANTI T.L. (1981). Equilibria on a Congested Transportation Network.
SIAM Journal on Algebraic and Discrete Methods 2 (3), 213-226.
ALFA, A.S. & MINH, D.L. (1979). A stochastic model for the temporal distribution of traffic demand
- the peak hour problem, Transpn Sci 13, 315-324.
ALFA, A.S. (1986). A review of models for the temporal distribution of peak traffic demand.
Transpn Res 20B(6), 491-499.
BARNETT, S. (1990). Matrices: Methods and Applications. Clarendon Press, Oxford.
BECKMANN, M., MCGUIRE, B. & WINSTEN, C.B. (1956). Studies in the Economics of
Transportation, Yale University Press, New Haven, Connecticut.
BEN-AKIVA, M., DE PALMA, A. & KANAROGLOU, P. (1986). Dynamic model of peak period
traffic congestion with elastic arrival rates, Transpn Sci 20 (2), 164-181.
BRAESS, D. & KOCH, G. (1979). On the existence of equilibria in asymmetrical multiclass-user
transportation networks, Transpn Sci 13 (1), 56-63.
CAREY, M. (1992). Nonconvexity of the dynamic traffic assignment problem, Transpn Res 26B
(2), 127-134.
CAREY, M. & KWIECINSKI A. (1994). Swapping the order of scheduled services to minimise
expected costs of delays. Transpn Res 28B(6), 409-428.
CASCETTA, E. (1989). A stochastic process approach to the analysis of temporal dynamics in
transportation networks, Transpn Res B 23B (1), 1-17.
DAFERMOS, S. (1971). An extended traffic assignment model with applications to two-way traffic,
Transpn Sci 5, 366-389.
DAFERMOS, S. (1972). The traffic assignment problem for multi-class user transportation
networks, Transpn Sci 6, 73-87.
DAFERMOS, S. (1980). Traffic equilibrium and variational inequalities, Transpn Sci 14 (1),
42-54.
DAGANZO, C.F. (1982). Unconstrained extremal formulation of some transportation equilibrium
problems, Transpn Sci 16 (3), 332-360.
DAGANZO, C.F. (1983). Stochastic network equilibrium with multiple vehicle types and
asymmetric, indefinite link cost Jacobians, Transpn Sci 17 (3), 282-300.
DAVIS, G.A. & NIHAN, N.L. (1993). Large population approximations of a general stochastic traffic
assignment model. Operations Research 41 (1), 169-178.
DE PALMA, A., and LEFEVRE, C. (1987). The theory of deterministic and stochastic
Modelling, ed. by C.S.Bertuglia, G.Leonardi, S.Occelli, G.A.Rabino, R.Tadei and A.G.Wilson, Croom Helm, Kent, UK, 490-540.
EMMERINK, R.H.M., AXHAUSEN, K.W., NIJKAMP, P. & RIETVELD, P. (1994). Effects of
information in road networks with recurrent congestion. Transpn, forthcoming.
FARGIER, P. (1983). Effects of the choice of departure time on road traffic congestion: Theoretical
approach. In Proc 8th Int Symp on Transpn and Traffic Theory, ed. by V.F.Hurdle, E.Hauer
and G.N.Steuart, held June 24-26 1981, University of Toronto Press.
FERNANDEZ, J.E. & FRIESZ, T.L. (1983). Equilibrium Predictions in Transportation Markets: The
State of the Art. Transpn Res 17B (2), 155-172.
FISK, C. (1980). Some developments in equilibrium traffic assignment methodology, Transpn Res
14B, 243-255.
HENSHER, D. (1988). Model specification for a dynamic discrete continuous choice automobile
demand system. In Behavioural Modelling in Geography and Planning, ed. by R.C.Golledge and
H.Timmermans, Croom Helm, Kent, UK.
HEYDECKER, B.G. (1983). Some consequences of detailed junction modelling in road traffic
assignment, Transpn Sci 17 (3), 263-281.
HOROWITZ, J.L. (1984). The stability of stochastic equilibrium in a two-link transportation
network, Transpn Res 18B (1), 13-28.
JAYAKRISHNAN, R., TSAI, W.K. & CHEN, A. (1995). A dynamic traffic assignment model with
traffic-flow relationships. Transpn Res 3C (1), 51-72.
KITAMURA, R. (1988). An analysis of weekly activity patterns and travel expenditure. In
Behavioural Modelling in Geography and Planning, ed. by R.C.Golledge and H.Timmermans, Croom Helm, Kent, UK, 399-423.
MAHER, M.J. (1992). SAM - A Stochastic Assignment Model. In Mathematics in Transport
Planning and Control, ed. J.D. Griffiths, Oxford University Press.
MAHMASSANI, H.S. & JAYAKRISHNAN, R. (1991). System performance and user response under
real-time information in a congested traffic corridor, Transpn Res 25A (5), 293-308.
MORLOK, E.K. (1979). Short run supply functions with decreasing user costs, Transpn Res 13B,
183-187.
NETTER, M. (1972). Affectations de trafic et tarification au coût marginal social: critique de
quelques idées admises, Transpn Res 6, 411-429.
RATHI, A.K. (1992). The use of common random numbers to reduce the variance in network
simulation of traffic, Transpn Res 26B (5), 357-363.
SHEFFI, Y. (1985). Urban Transportation Networks, Prentice-Hall, New Jersey.
SMITH, M.J. (1979a). Traffic control and route-choice: a simple example, Transpn Res 13B,
289-294.
SMITH, M.J. (1979b). The existence, uniqueness and stability of traffic equilibrium, Transpn Res
13B (4), 295-304.
SMITH, M.J. (1981a). The existence of an equilibrium solution to the traffic assignment problem
when there are junction interactions, Transpn Res 15B (6), 443-451.
SMITH, M.J. (1981b). Properties of a traffic control policy which ensure the existence of a traffic
equilibrium consistent with the policy, Transpn Res 15B (6), 453-462.
SMITH, M.J. (1984a). Two alternative definitions of traffic equilibrium, Transpn Sci 18B (1),
SMITH, M.J. (1984b). The stability of a dynamic model of traffic assignment. An application of a
method of Lyapunov, Transpn Sci 18 (3), 245-252.
TIMMS, P.M. & WATLING, D.P. (1993). Modelling route guidance strategies under day-to-day variability and individual behaviour. Contribution to EC project LLAMD-MARGOT deliverable M7,
Proportional routeing strategies, DRIVE office, Brussels.
VAN VLIET, D. (1985). SATURN User Manual and Notes, Institute for Transport Studies, University of Leeds, Leeds, UK.
VAN VLIET, D., BERGMAN, T. & SCHELTES, W.M. (1985). Equilibrium traffic assignment with
multiple user classes, Proc. PTRC 14th Summer Annual Meeting, Seminar M, 111-122.
VYTHOULKAS, P.C. (1990). A dynamic stochastic assignment model for the analysis of general
networks, Transpn Res 24B (6), 453-469.
WATLING, D.P. (1995). Modelling responsive signal control and route choice. Paper presented at