Variability and patterning in permanent tooth size of four human ethnic groups.
A. H. Brook1, R. C. Griffin1, G. Townsend1,2, Y. Levisianos1, J. Russell3, and R. N. Smith1* 1International Collaborating Centre in Oro-facial Genetics and Development, University of
Liverpool, School of Dental Sciences, Daulby Street, Liverpool L69 3GN, UK 2School of Dentistry, University of Adelaide, SA 5005, Australia
3Corporate Information and Computing Services, University of Sheffield, 285 Glossop Road,
Sheffield S10 2HB, UK
*Corresponding author. Dr RN Smith. 0151 7065118
E-mail address: [email protected]
This paper has been submitted for consideration for inclusion in a Supplement to Archives of Oral Biology. This Supplement arises from a series of papers given at an International Workshop on Oral Growth and Development held in Liverpool on November 26-28, 2007. The papers to be submitted consist of a series of review and new concept papers to be followed by papers
Abstract
Aims:Dental dimensions vary between different ethnic groups, providing insights into the factors controlling human dental development. This paper compares permanent mesiodistal crown diameters between four ethnic groups, highlighting patterns of tooth size between these groups and considers the findings in relation to genetic and environmental influences.
Methods and Results:Mesiodistal crown dimensions were recorded using standardised manual measurements on dental casts derived from four different human populations: Southern Chinese; North Americans of European ancestry; Modern British of European ancestry and Romano-British. Analyses based on double determinations showed that measurements in all study
samples were reliable to an accuracy of 0.1mm. The Southern Chinese sample was found to have the largest teeth overall, whereas the Romano-British sample generally displayed the smallest mesio-distal crown dimensions (p<0.001). However, the Modern British sample had the largest maxillary central incisors, mandibular central and lateral incisors, and mandibular canines, while the North American sample had the largest maxillary first and second molars. Comparisons of coefficients of variation for teeth within each class showed that the later-forming teeth displayed greater variation in mesio-distal size than the earlier-forming teeth.
Conclusion:The different patterns of tooth size observed between the study samples are thought to reflect differences in the relative contributions of genetic, and environmental influences to dental development between the four populations. For example, it is proposed that major
also distinct differences in the patterns of crown size between the groups, with the later-forming teeth in each type generally showing greater size variation.
Introduction
Teeth can provide evidence about the nature and extent of diversity between human populations (1) and variations in dental crown size have been reported between different populations (2). Numerous factors can contribute to variation in tooth size and these may be described broadly as genetic, epigenetic and environmental influences (3, 4, 5). Previous studies have confirmed the presence of sexual dimorphism within the human dentition (6-8) and examples of ethnic differences and geographic variability in tooth size have been documented (2).
A strong genetic contribution to variation in tooth size has been shown but environmental factors may also play a role (3, 9). For example, low birth weight has been linked to a reduction in the mesiodistal width of deciduous teeth (5, 10, 11). Alvesalo (7) has shown that there is sexual dimorphism displayed in the dentition, with males tending to have larger teeth than females (9), reflecting X chromosome linkage with the Y chromosome also having an impact. For example, both 47,XXY males and 47,XYY males have larger teeth than 46,XY males (6, 8).
This study aims to compare dental crown size between four human populations from different geographical regions and time periods in order to determine:
1. Whether there are any overall differences in permanent mesiodistal crown diameters between the groups.
2. Whether the patterns of the mesio-distal diameters in each group are compatible with current understanding of the morphogenetic field concept (13).
3. Whether the patterns of variability in mesio-distal diameters for different tooth types were different between the groups.
Materials and Methods
Mesio-distal dental crown dimensions were compared between a Southern Chinese group, a North American group of European ancestry, a Modern British group of European ancestry and a Romano-British group.
measurements from the permanent dentition are used here. The Modern British data were derived from 30 males and 30 females aged 12-20 years from Sheffield, England. All subjects were of European ancestry. The data on the Romano-British population were derived from the excavated skeletal remains of the Poundbury cemetery, Dorset, UK in use during the period 200-400 AD, and now housed in the Natural History Museum, London. They travelled to the UK to form part of the supporting network for the Roman Legions, but their exact origin is not known as many were recruited on route from other countries. It is also uncertain as to their future, but many would have fully integrated into the population and remained there with their families.
The skeletons were aged and sexed by the Museum staff. For this study 30 male and 30 female skulls with complete permanent dentitions were selected from the mixed juvenis/adultus group (14-24 years). Ethical approval was gained for this study.
Mesiodistal (MD) crown width was defined as the greatest distance between the contact points of the approximal surfaces of the dental crown, with the calipers parallel to the occlusal and buccal surfaces (15). Where the tooth was rotated or adjacent teeth were not present, the measurement was taken between the points where contact with the neighboring tooth would normally occur.
The authors note that with modern techniques and approaches such as 2 dimensional and 3 dimensional imaging and analysis, the variables could be assessed more accurately and reliably. These techniques also facilitate the use of additional variables such as surface area.
Each tooth was measured on two separate occasions and the mean value of the measurements was used. Different recording sheets were used on each occasion to ensure no access to the previous measurements. If there was a discrepancy greater than 0.4mm between the recordings, the measurements were discarded. No data were obtained on the maxillary and mandibular second molar teeth for the Modern British population.
Since there was no statistically significant difference for each individual tooth type between the findings from right and left sides, the measurements for both sides were pooled in these results. For each population the intra- and inter-operator reliability was determined from the repeat measurements and analysed by paired t-tests.
Results
Reliability testing across the four ethnic groups showed similar results, indicating that each set of data were reliable to 0.1mm and that valid comparisons between the groups could be made. Moreover, the standard deviations for dental dimensions in each ethnic group were similar within each tooth type (Figs 1-4).
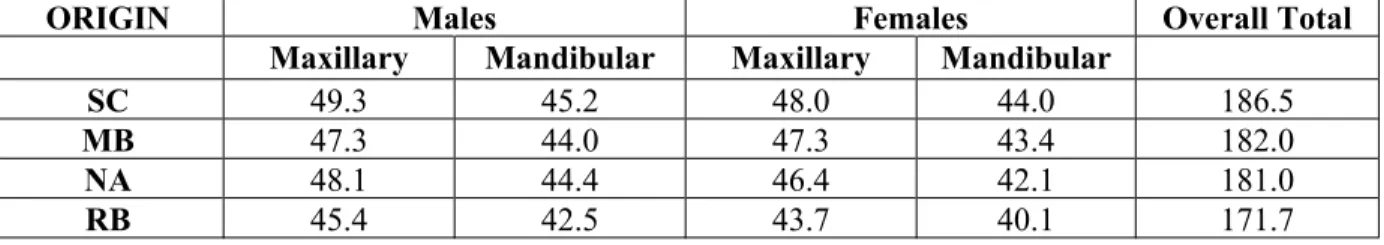
The combined MD crown diameters for the Southern Chinese sample were largest overall compared with the other three groups, while those of the Romano-British sample were the smallest (Table 1). The MD dimensions for all four populations are shown in Figs 1-4, and the significance and variance outputs for group comparisons for each tooth type are shown in Table 2. While the Southern Chinese had the largest size for the majority of tooth types, the Modern British had the largest maxillary central incisors, mandibular central and lateral incisors, and mandibular canines. The North Americans had the largest maxillary first and second molars (Figure 5). This varying pattern of tooth size is illustrated in Figs 6 and 7.
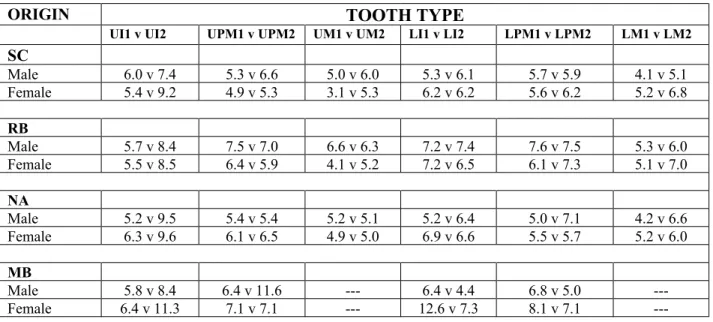
Comparison of coefficients of variation between the first and second teeth of each tooth type, e.g. upper central incisor vs. upper lateral incisor, showed the later forming teeth usually demonstrated greater variation (Table 3).
Discussion
likely to reflect genetic and environmental differences between this group and the other three considered here. A synthesis of data on dental dimensions from different populations worldwide (12) has indicated that western Eurasian populations tend to have the smallest teeth, with indigenous Australians, Melanesians, Micronesians, sub-Saharan Africans and native Americans tending to have large teeth. East and Southeast Asian populations were found to be intermediate in tooth size between these groups. The data presented here for the three modern populations match this pattern.
Hanihara and Ishida (12) have suggested that the distribution of tooth sizes observed in their study may be due to the impact of agriculture on the operation of natural selection on tooth size, with the use of agriculture reducing the effects of natural selection. This hypothesis is not supported by the data for the Romano-British population included in the present study, which showed smaller mesiodistal dimensions than were observed in any of the modern populations. Although Hanihara and Ishida (12) also included measurements from the same Romano-British population, they did not compare the data from this population with data from modern European populations. If the smaller tooth size in western Eurasian populations was due to a longer history of agriculture in these populations, then it would be expected that the Romano-British population would have larger teeth than both the modern British and North American populations. Instead, it is possible that genetic differences between the Southern Chinese and the British and North American populations may be contributing to the differences observed.
were included in this study, it is possible that a limited amount of tooth wear may have occurred even in these young individuals, and that this may have contributed to the smaller tooth size of this population. Hillson (17) identified a series of factors affecting tooth wear. These include masticator forces, non-chewing parafunctional activities, use of teeth as tools, and the nature of the diet. A tough fibrous diet requiring prolonged mastication, and the abrasivity of food consumed, could potentially contribute to tooth wear, as seen in the older cohorts of this population (18). However, evidence from defects of enamel development suggests that this group experienced recurrent illnesses, high lead ingestion and poor nutrition (19), a conclusion consistent with the archaeological evidence for health within this population (20). Moreover, these Romano-Britons also had a higher frequency of hypodontia and microdontia than Modern Britons (21). As these anomalies are associated with small tooth size (9), this suggests that the smaller Romano-British tooth size is largely developmental in origin and that major environmental factors may well have influenced tooth development in this ethnic group.
being smaller and more variable (Figs 1-4, 6, 7). The values of coefficients of variation (Table 3) also showed that these later-forming teeth tended to be more variable in M-D diameter.
In conclusion, using a standardized methodology, significant differences in M-D crown dimensions have been demonstrated between ethnic groups. There were varying patterns of tooth size between the groups and the later-forming teeth in each tooth type were smaller and showed greater variation. These differences reflect different contributions of genetic and environmental influences to tooth size variability within and between human populations.
Acknowledgements
References
1. Keiser J. Human Adult Odontometrics. Cambridge: Cambridge University Press, 1990. 2. Moorrees C, Thomsen S, Jensen E, Yen P. Mesiodistal crown diameters of deciduous and permanent teeth in individuals.J Dent Res1957;36:39-47.
3. Townsend G, Brown T. Heritability of permanent tooth size. Am J Phys Anthropol
1978;49:497-504.
4. Townsend G and Brook A. Genetic, epigenetic and environmental influences on dental development. Ortho Tribune2008;3:3-6.
5. Fearne J, Brook A. Small primary tooth-crown size in low birth weight children. Early Human Development1993;33(2):81-90.
6. Townsend G, Alvesalo L. Tooth size in 47,XYY males - evidence for a direct effect of the Y chromosome on growth.Aust Dent J1985;30:268-272.
7. Alvesalo L. The influence of sex-chromosome genes on tooth size in man. Proceedings of the Finnish Dental Society1971;67:3-54.
8. Townsend G, Alvesalo L. The size of permanent teeth in Klinefelter (47,XXY) syndrome in man.Arch Oral Biol1985;30:83-84.
9. Brook A. A unifying aetiological explanation for anomalies of human tooth number and size.Arch Oral Biol1984;29(5):373-378.
10. Keene H. Epidemiologic study of tooth size variability in caries free naval recruits. J Dent Res1971;50:1331-1345.
12. Hanihara T, Ishida H. Metric dental variation of major human populations. Am J Phys Anthropol2005;128:287-298.
13. Townsend G, Harris E, Lesot H, Clauss F and Brook A. Morphogenetic fields within the human dentition: a new clinically relevant synthesis of an old concept. Arch Oral Biol doi 10.1016/j.archoralbiol 2008.
14. Brook A, Griffin R, Smith R, Townsend G, Kaur G, Davis G, et al. Tooth size patterns in patients with hypodontia and supernumerary teeth.Arch Oral Biolin press.
15. Moorees C, Reed R. Correlation among crown diameters of human teeth. Archives of Oral Biology1954;9:685-697.
16. Ling J, Wong R. Tooth dimensions of Southern Chinese.Homo2007;58:67-73. 17. Hillson S. Dental Anthropology. Cambridge: Cambridge University Press, 1996.
18. Brook A, Hector M, Underhill C and Foo LK. Approximal attrition and permanent tooth crown size in a Romano-British population.Dental Anthropology2006;19:23-28.
19. Brook A, Smith J. Hypoplastic enamel defects and environmental stress in a homogeneous Romano-British population.Eur J Oral Sci2006;114:370-374.
20. Farwell D, Molleson T. Poundbury, Vol. 2. - the Cemeteries. Dorchester: Friary Press, 1993.
Figure legends
Figure 1. Mesiodistal crown dimensions of permanent maxillary teeth in males of four different ethnic groups (means and standard deviations shown).
Figure 2. Mesiodistal crown dimensions of permanent mandibular teeth in males of four different ethnic groups (means and standard deviations shown).
Figure 3. Mesiodistal crown dimensions of permanent maxillary teeth in females of four different ethnic groups (means and standard deviations shown).
Figure 4. Mesiodistal crown dimensions of permanent mandibular teeth in females of four different ethnic groups (means and standard deviations shown).
Figure 5. Comparison of tooth size between four ethnic groups: number of times tooth size in each group was significantly larger than in the other three groups is shown on the y axis (see Table 2).
Figure 6. Comparison of mean tooth size per tooth type between different ethnic groups (males).
Table 1. Sum of the mesiodistal crown diameters for all tooth types in different ethnic
ORIGIN Males Females Overall Total
Maxillary Mandibular Maxillary Mandibular
SC 49.3 45.2 48.0 44.0 186.5
MB 47.3 44.0 47.3 43.4 182.0
NA 48.1 44.4 46.4 42.1 181.0
RB 45.4 42.5 43.7 40.1 171.7
Table 2. Tooth size comparison between four ethnic groups: F values and significance levels. The first letter of the group with the larger teeth is indicated, together with the level of significance (* = 0.05, ** = 0.01, *** = 0.001or greater significance)
Significance and variance F outputs for all possible country comparisons per tooth type
TOOTH UI1 UI2 UC UPM1 UPM2 UM1 UM2 LI1 LI2 LC LPM1 LPM2 LM1 LM2
Modern UK/Chinese
Variance F 6.16 7.07 2.94 29.70 58.67 1.05 - 408.35 23.60 25.55 8.91 22.93 36.55
-Level of significance *U **C ***C ***C ***U ***U *** U **C ***C ***C
Modern UK/Romano British
Variance F 18.52 4.85 20.23 32.23 0.26 33.56 - 152.96 93.06 67.71 11.36 0.05 4.77
-Level of significance ***U *U ***U ***U ***U ***U ***U ***U **U *R
Modern UK/North American
Variance F 6.22 1.95 0.19 0.76 17.36 0.36 - 342.99 1.92 58.12 0.32 1.73 0.74
-Level of significance *U ***N ***U ***U
Chinese/North American
Variance F 0.02 33.70 10.73 89.67 32.22 5.41 0.49 0.68 42.12 9.51 30.71 31.59 92.72 1.22
Level of significance ***C **C ***C ***C *N ***N **C ***C ***C ***C
Chinese/Romano British
Variance F 0.01 39.16 68.38 230.73 112.27 48.19 52.43 26.50 23.82 33.49 73.09 38.45 16.99 8.51
Level of significance ***C ***C ***C ***C ***C ***C ***C ***C ***C ***C ***C ***C **C
Romano British/North American
Variance F 8.67 1.18 35.50 51.91 38.02 67.75 69.63 27.49 51.39 14.17 20.53 3.90 15.28 3.23
Table 3. Comparison of the values of coefficient of variation for tooth size between mesial and distal teeth of each type.
SC = South Chinese, RB= Romano Briton, NA = North American, MB = Modern Briton.
ORIGIN TOOTH TYPE
UI1 v UI2 UPM1 v UPM2 UM1 v UM2 LI1 v LI2 LPM1 v LPM2 LM1 v LM2
SC
Male 6.0 v 7.4 5.3 v 6.6 5.0 v 6.0 5.3 v 6.1 5.7 v 5.9 4.1 v 5.1 Female 5.4 v 9.2 4.9 v 5.3 3.1 v 5.3 6.2 v 6.2 5.6 v 6.2 5.2 v 6.8
RB
Male 5.7 v 8.4 7.5 v 7.0 6.6 v 6.3 7.2 v 7.4 7.6 v 7.5 5.3 v 6.0 Female 5.5 v 8.5 6.4 v 5.9 4.1 v 5.2 7.2 v 6.5 6.1 v 7.3 5.1 v 7.0
NA
Male 5.2 v 9.5 5.4 v 5.4 5.2 v 5.1 5.2 v 6.4 5.0 v 7.1 4.2 v 6.6 Female 6.3 v 9.6 6.1 v 6.5 4.9 v 5.0 6.9 v 6.6 5.5 v 5.7 5.2 v 6.0
MB