Silicate melt under pressure:
coordination changes and trace element partitioning
Eleanor Rose Mare
August 2017
A thesis submitted for the degree of Doctor of Philosophy of The Australian National University
© Copyright by Eleanor Rose Mare 2017
Declaration
This thesis contains the results of research done in the Research School of Earth Sciences, The Australian National University, between 2013 and 2017. I certify that this thesis contains no material which has been accepted or submitted for the award of any other higher degree or graduate diploma in any tertiary institution and to the best of my knowledge and belief, the thesis contains no material previously
published or written by another person, except where otherwise acknowledged.
Eleanor Rose Mare
Acknowledgements
Firstly I would like to thank my supervisors, Hugh O’Neill and Andrew Berry. They have both been exceptionally supportive and encouraging supervisors, from helping me get to grips with a new research area, to reading drafts of my resume when I applied for jobs, and helping me make progress when I felt stuck. I am very grateful for all of their support. They have also provided helpful and detailed feedback on drafts of this thesis. Greg Yaxley and Jörg Hermann, my advisors, have also provided valuable advice and support.
I spent a lot of time in the Experimental Petrology Lab over the years and am very grateful for the technical support from Dean Scott and David Clarke; I have learned a great deal from them. I also thank Robert Rapp for his help with the multi-anvil. He very kindly ran a couple of multi-anvil experiments for me when I was very busy preparing for a beamtime. I have also appreciated the advice received from many other staff and students in the Petrology group over the years, in particular the later-year students who were here when I arrived: Jeremy Wykes, Mike Jollands, Paolo Sossi, Prokopiy Vasilyevand Tarun Whan (Tazz). Tazz was also my first office-mate and made me feel very welcome.
I have enjoyed many fruitful conversations with Charles Le Losq, who is one of the few other people in the department directly interested in silicate melt structure. Charles has helped me to get a better understanding of my NMR results, and I am also very grateful for the time he spent adapting some scripts to do some clever fitting of some of my spectra.
Several people have provided technical support in the other labs around RSES: Jung-Woo Park, Mike Jollands, Peter Tollan and James Tolley with the
LA-ICPMS; Ulli Troitzch in the XRD labs; Robert Rapp with the electron microprobe; Penny King and Jörg Hermann in the IR lab; and Hui Juan Li, Laure Gauthiez-Putallaz, Morgan Williams and Melanie Sieber with the SEM. I am grateful for all of their assistance.
Advanced Microscopy, ANU. In particular, I thank Hua Chen and Frank Brink for their assistance.
I also thank my collaborators at the University of St Andrews, Sharon Ashbrook and Nasima Kanwal. I spent two months in Sharon’s research group and learned a great deal. In particular, I must thank Nasima in particular for her patience in explaining many aspects of NMR spectroscopy to me, for running many experiments, and for performing fits to all of the 27Al spectra presented in this thesis. This is an enormous amount of work and I am very grateful to her. Both Sharon and Nasima have contributed to revisions of Chapter 3 of this thesis. I also thank Daniel Dawson, Scott Sneddon, Robert Moran and Joseph Hooper for their assistance and friendship during my time in St Andrews.
The UK 850 MHz solid-state NMR Facility used in this research was funded by EPSRC and BBSRC (contract reference PR140003), as well as the University of Warwick including via part funding through Birmingham Science City Advanced Materials Projects 1 and 2 supported by Advantage West Midlands (AWM) and the European Regional Development Fund (ERDF). Collaborative assistance from the 850 MHz Facility Manager (Dinu Iuga, University of Warwick) is
acknowledged.
All of the X-ray absorption spectroscopy for this thesis was was undertaken on the X-ray Absorption Spectroscopy beamline at the Australian Synchrotron, part of ANSTO. I gratefully acknowledge assistance from the beamline scientists there, including Chris Glover, Peter Kapen and Bernt Johannessen.
Thanks also to Daniel Neuville for performing a Tg analysis on one of my samples, a crucial piece of information for interpreting my results!
I received financial support throughout my candidature from several awards. The Australian Government Research Training Program Scholarship (formerly
enabled me to attend several small conferences and workshops, and I am very grateful for all of these opportunities.
Thanks also to Josephine Magro, Maree Coldrick, Mary Hapel and Joy McDermot for administrative support over the years, and for making me feel so welcome. Josephine and Maree in particular have been very supportive in the final stages of my write-up. I also thank Brian Harrold for the lunchtime walks, teas, and all the fruitcake!
I am also very grateful to the Research Skills and Training team at the ANU, for providing writing days and evenings (funded by the Postgraduate and Research Students Association, PARSA). They kindly allowed me to attend all of their sessions over the last month or two of my write-up stage. I found these sessions enormously helpful, in speeding up my progress and making the whole experience more fun!
The sense of community at RSES is very strong and this is part of the reason I have enjoyed my time here so much; I have met so many great people. Firstly, my officemates over the years: Tazz Whan, Rachel Stott, Johanna Sommer, Ting Chen, Laura Miller, and Melanie Sieber. I am very grateful for their friendship and support. Secondly, I’d like to thank everyone who has done writing sessions with me in the last few months, including Louise Schoenveld, Kate Holland, Ali Kimbrough, Melanie Sieber, Laura Miller, Jennifer Wurtzel, Hannah James and Kelsie Long. Some days the only way I have mustered up the energy to write is because they were there with me, and I am very thankful for that. Thirdly, the many friends and friendly faces who I have met either at morning teas, or lunches, or just generally around. There are too many to name, but they include the
officemates and writing buddies already mentioned, along with: Kathryn Hayward, Mari Rosa Scicchitano, Jess Aimes, Rose Manneau, Shayne Lakey, Suzette
Loiselle, Jessica Lowczak, Matthew Valetich, Brendan Hanger, and Emmanuel David, and many others.
I also acknowledge my new colleagues and friends at the University of St Andrews. In particular, my supervisor, Sami Mikhail, has been very supportive. Matthew Warke, Tim Kinnaird, Elyse Allender, Adi MacArtney and others have been very welcoming and I am grateful for their friendship.
There are a few other people outside of RSES who have made the last few years really enjoyable. Firstly, my fantastic housemates: Kat Owen, Rachel Stott, and Mya Anumarlapudi and Simone Cilia. Simone made me feel immediately at home in Woodlands Cottage, Dunino, and Kat and Mya have helped out a lot over the last month of my thesis-writing, by cooking me delicious food when I had no energy left to cook myself! Secondly, two close friends deserve a special mention: Tom Meumann and Kat Owen. Tom has been a very good friend to me for many years. I’m very grateful to him for providing me with a listening ear and a cup of tea on so many occasions. Kat has also been a wonderful friend for the 4.5 years that we have lived together. A great deal has happened in that time and I’m glad to have been able to share so much of it with her. I really appreciate her warmth, encouragement and support.
Abstract
Many geochemical models of magmatic processes, such as the formation of the Earth’s metallic core, are based on trace element partition coefficients.
Fundamental to these models is an understanding of how partition coefficients vary with pressure. The main objective of this thesis is to explore one factor that controls the pressure-dependence of partitioning: the coordination environment (i.e. the number of bonded oxygens) of cations in silicate melt.
Changes in the coordination number of major elements, Si and Al, are well known to occur in natural melts with pressure, but similar changes have been
demonstrated for only a few trace elements: Ni, Co and Lu. In this work, coordination environments of Ge were Ga were studied. X-ray absorption spectroscopy of aluminosilicate glasses was used to show that both Ge and Ga begin to change their coordination from about 1 GPa, and this change is not yet complete at 10 GPa.
In glasses quenched from high-pressure melts, Ge and Ga average coordination increased rapidly between 4 and 5 GPa, suggesting that a change in major element coordination might influence the coordination of both trace elements. To assess this possibility, nuclear magnetic resonance spectroscopy was used to determine
changes in the local environments of major elements in the same or similar glasses to which Ge and Ga coordination was studied. Al coordination changed rapidly between 4 and 5 GPa, as had been observed for Ge and Ga. In particular, the Ga and Al average coordination numbers correlate well. These observations indicate that changes in the coordination of major elements may indeed influence the coordination of trace elements.
The effect of a Ge coordination change on partitioning was determined by
The observed coordination changes of Ge4+ will be relevant in models of the Earth’s core formation only if Ge4+ is the stable species at the reducing conditions of the magma ocean at that time (below the iron-wüstite oxygen buffer, IW). However, previous work has indicated the possibility of Ge2+ stability in silicate melts around these conditions. This was tested using X-ray absorption spectroscopy of glasses quenched from melts prepared at varying oxygen fugacity. The spectra show that the Ge4+–Ge2+ transition occurs over the range ∆IW +2 to ∆IW -2. Olivine-melt partitioning experiments indicate that Ge2+ is highly incompatible, in contrast to Ge4+, which has a partition coefficient close to one.
Contributions
The key contributions made by this thesis are as follows:
• The first observations of pressure-induced coordination changes of Ge4+ and
Ga3+ when dissolved as trace cations in silicate melts; this extends the so-far limited work on trace element coordination changes
• A discussion of the effect of coordination changes on trace element
partitioning
• The first evidence to suggest that major element coordination changes may
influence those of trace elements
• The first spectroscopic evidence for the stability of Ge2+ in silicate melts at
low oxygen fugacity, and the first constraints on the olivine–melt
Table of Contents
Chapter 1: Overview ... 17
1.1 The importance of silicate melts in the Earth ... 17
1.2 Geochemical constraints on magmatic processes ... 19
1.3 The effect of pressure on trace element partitioning ... 22
1.4 Silicate melt structure ... 23
1.5 The approach taken in this thesis ... 26
Element-specific techniques ... 26
Other techniques ... 27
Justification of the approach taken in this thesis ... 28
1.6 Research questions and thesis structure ... 31
Structure of this thesis ... 33
Chapter 2: Coordination change of Ge4+ and Ga3+ in silicate melt with pressure ... 35
2.1 Introduction ... 36
2.2 Methods ... 38
Sample synthesis ... 38
Sample characterisation ... 45
X-ray absorption spectroscopy ... 46
2.3 Results ... 47
Sample characterization ... 47
X-ray absorption spectroscopy ... 50
2.4 Discussion ... 59
Evidence for and extent of coordination changes ... 59
Factors that might affect preserved coordination environments ... 60
Differences in coordination change between quenched melts and annealed glasses ... 67
Similarity between Ge and Ga ... 69
Effect of composition ... 69
2.5 Conclusions ... 70
Chapter 3: Relationship between trace and major element coordination changes in silicate melts: insights from nuclear magnetic resonance spectroscopy ... 71
3.1 Introduction ... 72
3.2 Methods ... 74
Sample synthesis ... 74
17O enrichment ... 76
Sample characterization ... 77
NMR spectroscopy ... 77
3.3 Results ... 80
Sample characterisation ... 80
Aluminium-27 ... 81
Silicon-29 ... 90
Aluminium–silicon correlation ... 94
Magnesium-25 ... 97
Oxygen-17 ... 98
Gallium-71 ... 101
3.4 Discussion ... 103
Aluminium-27 ... 103
Silicon-29 and the aluminium–silicon correlation spectra ... 107
Magnesium-25 ... 108
Calcium-43 ... 109
Oxygen-17 ... 109
Gallium-71 ... 110
Relationships between Al and trace elements ... 111
3.5 Conclusion ... 112
3.6 Acknowledgements ... 112
Chapter 4: Pressure effect on partitioning of Ge4+ between olivine and silicate melt .. 115
4.1 Introduction ... 116
4.2 Methods ... 118
Sample synthesis ... 118
Major and trace element analysis ... 120
4.3 Results ... 121
4.4 Discussion ... 125
Are the samples in equilibrium? ... 125
Comparison to previous work ... 126
A thermodynamic evaluation of the effect of pressure on partitioning ... 131
4.5 Conclusion ... 137
Chapter 5: Divalent germanium: stable at low fO2 and highly incompatible in olivine139 5.1 Introduction ... 140
5.2 Methods ... 142
Sample synthesis ... 142
Sample characterisation ... 148
X-ray absorption spectroscopy ... 149
5.3 Results ... 150
Experimental products (ambient-pressure glasses) ... 150
fO2 of high-pressure samples ... 152
X-ray absorption spectroscopy ... 153
Partitioning experiments ... 163
5.4 Discussion ... 170
Partitioning and coordination of Ge2+ ... 170
The fO2 of the Ge4+–Ge2+ transition ... 171
Implications ... 172
5.5 Conclusion ... 174
Chapter 6: Concluding remarks ... 177
6.1 Discussion ... 177
Limitations of the results ... 178
Directions for future work ... 178
6.2 Conclusion ... 180
Chapter 7: Supplementary Material ... 195
7.1 Preparation of model compounds ... 195
7.2 Major element compositions of glass samples ... 197
7.3 Ge and Ga concentrations in glasses ... 199
7.4 Ge2+ in annealed glasses ... 202
7.5 27Al fit parameters ... 207
7.6 17O fit parameters ... 209
7.7 Analyses of partitioning experiments ... 209
List of Figures
Figure 2.1. Cross section through a piston cylinder assembly. ... 41Figure 2.2. BSE images of MA1118. ... 50
Figure 2.3. Ge and Ga K-edge XANES spectra of sample B1-080316. ... 50
Figure 2.4. Ge and Ga K-edge XANES spectra of model compounds. ... 51
Figure 2.5. Ge and Ga K-edge XANES spectra of glasses of various compositions. ... 52
Figure 2.6. Comparison of low- and high-pressure spectra with model compounds. . ... 53
Figure 2.7. Ge2+ component in spectra of annealed glasses. ... 54
Figure 2.8. Ge K-edge XANES spectra of samples synthesised at the pressures indicated. ... 56
Figure 2.9. Linear combination fits of Ge and Ga XANES spectra. . ... 57
Figure 2.10. The Ge high-pressure component plotted against pressure of synthesis. ... 58
Figure 2.11. The Ga high-pressure component plotted against pressure of synthesis. ... 58
Figure 2.12. Ge K-edge EXAFS spectra of samples of NHPG-1 composition. ... 59
Figure 2.13. ConceptualillustrationofhowtheTfofsamplesmayvarydependingonwhat temperature theycrosstheglasstransition. ... 62
Figure 3.1. 27Al MAS and MQMAS NMR spectra of selected samples. ... 82
Figure 3.2. 27Al MAS NMR spectra of D2173, lightly and heavily ground. ... 83
Figure 3.3. 27Al MAS and MQMAS NMR spectra for a sample containing a sharp peak with no quadrupolar coupling. ... 84
Figure 3.4. 27Al MAS NMR spectra of glasses containing different Ga concentrations. ... 84
Figure 3.5. 27Al MQMAS NMR spectra of samples with 11 wt% Ga. ... 85
Figure 3.6. Fits to the spectrum of D2213 (glass annealed at 3.5 GPa). ... 85
Figure 3.7. Plots showing how the percentage of each Al species varies with pressure. ... 88
Figure 3.8. Average Al coordination number (CN) as a function of pressure. ... 88
Figure 3.9. Comparison of Ge, Ga and Al coordination changes as a function of pressure in the composition CMAS7G. ... 89
Figure 3.10. Relationship between Ge, Ga and Al coordination changes.. ... 90
Figure 3.11. 29Si MAS NMR spectra of samples made at pressures indicated. ... 91
Figure 3.12. Features of the Si NMR peak plotted against pressure.. ... 92
Figure 3.13. Peak heights and positions as a function of pressure for the fits to 29Si spectra. ... 94
Figure 3.14. Fits to the 29Si spectra. ... 95
Figure 3.15. 27Al-29Si D-HMQC correlation spectra. ... 96
Figure 3.16. 25Mg MAS NMR spectra. ... 97
Figure 3.17. Fits to 25Mg spectra of B3-180615 at two fields. ... 98
Figure 3.18. 43Ca MAS NMR spectrum of B3-180615. ... 98
Figure 3.19. 17O NMR spectra of D1679 (1 GPa) collected at 14.1 T. ... 99
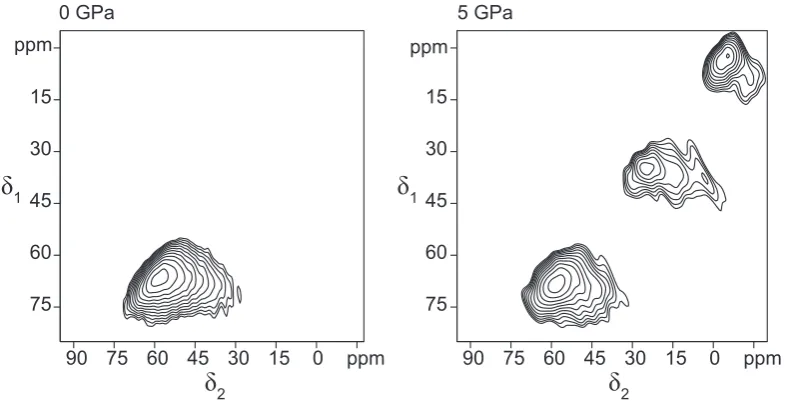
Figure 3.20. 17O NMR spectra of uhppc-269 (5 GPa) collected at 14.1 T. ... 99
Figure 3.21. 17O NMR spectrum of uhppc-269 (5 GPa), and models. ... 100
Figure 3.22. 17O NMR spectra after 17O enrichment via the gas-exchange method. ... 100
Figure 3.23. 71Ga MAS NMR spectra at two fields.. ... 101
Figure 3.24. Close up of the same 71Ga spectra along with fitted curves. ... 102
Figure 3.25. 71Ga spectra of samples containing lower Ga concentrations. ... 103
Figure 3.26. Comparison of Al coordination environments in the literature to those determined in this study.. ... 106
Figure 3.27. Comparison of average Al coordination number as a function of pressure in this study to similar compositions in the literature. ... 106
Figure 4.2. lnKD plotted against pressure (A) and inverse temperature (B). ... 124
Figure 4.3. The fit to lnKD data. ... 125
Figure 4.4. Temperature dependence of lnKD at ambient pressure.. ... 128
Figure 4.5. Comparison of my data to literature data at high pressure (uncorrected).. ... 129
Figure 4.6. Comparison of my data to literature data at high pressure (corrected).. ... 130
Figure 4.7. A comparison of my data to the predicted change in lnKD with pressure.. ... 133
Figure 4.8. Same as Figure 4.7, but predicted change in lnKD includes compressibility. ... 135
Figure 5.1. The fO2 ranges investigated, and Ge valence states determined by four previous studies. ... 141
Figure 5.2. Experimental assembly that was suspended in a furnace by the Al2O3 rod for ambient-pressure, low-fO2 experiments. ... 144
Figure 5.3. Backscattered electron image of sample D30/11/15. ... 151
Figure 5.4. Normalised XANES spectra of end-member samples. ... 153
Figure 5.5. Ge K-edge XANES spectra of all samples. ... 155
Figure 5.6. Ge K-edge XANES spectra of glasses containing different concentrations of Ge . 157 Figure 5.7. Example of the linear combination fit. ... 158
Figure 5.8. Linear combination fits to the spectrum of sample E02/12/13A (black). ... 158
Figure 5.9. Linear combination fitting results for glass samples.. ... 160
Figure 5.10. Ge K-edge EXAFS spectra. ... 161
Figure 5.11. Backscattered electron image of sample D2357. ... 163
Figure 5.12. Partition coefficients of C4444, D2413, D2368-i, and D2368-ii.. ... 167
Figure 5.13. Partition coefficients plotted against their ionic radii.. ... 169
Figure 7.1. Analytical totals plotted against pressure for quenched melts, as an estimate of how water content might vary with pressure. ... 198
Figure 7.2. The complete set of spectra collected for Chapter 2.. ... 203
Figure 7.3. Linear combination fit to the Ge XANES spectrum of sample D2125 ... 204
Figure 7.4. Linear combination fits to the Ge XANES spectra of samples indicated.. ... 205
Figure 7.5. The variation in Ge2+ with pressure.. ... 206
List of Tables
Table 2.1. Nominal compositions of starting mixes (wt% oxide). ... 39Table 2.2. Ge- and Ga-doped quenched melt samples (composition series). ... 42
Table 2.3. Ge- and Ga-doped quenched melt samples (pressure series). ... 43
Table 2.4. Ge- and Ga-doped annealed glass samples. ... 44
Table 2.5. Model compounds with known Ge or Ga coordination environments. ... 45
Table 2.6. Energy ranges and step sizes used to acquire XANES and EXAFS spectra. ... 47
Table 2.7. Average compositions of glasses made with different starting compositions, determined using FE-SEM. ... 48
Table 2.8. Fit parameters from Equation 2.1 used to determine the Ge2+ component in the annealed glasses. ... 55
Table 3.1. Nominal major element compositions of starting materials. ... 75
Table 3.2. List of samples and their experimental conditions. ... 76
Table 3.3. Compositions of glass samples from EDS analysis. ... 81
Table 3.4. Results of the fits to 1D MAS spectra at different magnetic field strengths. ... 86
Table 3.5. Al coordination numbers derived from fits to the spectra collected at 14.1 T. ... 87
Table 3.6. Positions, centroids and half widths of 29Si peaks. ... 92
Table 3.7. Mean fit parameters for fits to 29Si spectra recorded at 9.4 T. ... 93
Table 3.8. 71Ga fit parameters for sample B1-101215 at different fields. ... 102
Table 4.1. Nominal starting compositions. ... 118
Table 4.2. Trace element concentration in sample D2413. ... 119
Table 4.3. Experimental conditions. ... 120
Table 4.4. Olivine–melt partition and distribution coefficients ... 123
Table 4.5. Compilation of literature data for olivine–melt partitioning of Ge (expressed as lnKD where KD is the Ge–Si distribution coefficient between olivine and melt). ... 127
Table 4.6. Literature data for molar volumes of components in Equation 4.1. ... 132
Table 5.1. Nominal major element compositions of starting materials (wt%). ... 143
Table 5.2. Experimental conditions of ambient-pressure, low-fO2 experiments. ... 145
Table 5.3. List of high-pressure experiments. ... 145
Table 5.5. List of standards used for comparison to glasses made at low fO2. ... 148
Table 5.6. Energy ranges and step sizes used to acquire XANES and EXAFS spectra. ... 150
Table 5.7. Major element compositions for selected samples. ... 151
Table 5.8. Compositions of metal alloys in high-pressure experiments, CoO or NiO concentration in the melt, and calculated fO2 relative to IW. ... 153
Table 5.9. List of samples corresponding to spectra shown inFigure 5.5. ... 156
Table 5.10. EXAFS fit parameters for spectra of Ge4+ standards, q-GeO2 and E04/11/13, and the Ge2+-bearing glass, D12/04/16. ... 163
Table 5.11. Major and trace element analyses of experimental olivines. ... 164
Table 5.12. Major and trace element analyses of experimental melt. ... 165
Table 5.13. Olivine–melt partition coefficients, D, for the elements indicated. ... 166
Table 7.1. Compositions (wt%) of selected samples (CMAS7G) prepared for Chapter 2. ... 197
Table 7.2. Compositions (wt%) of selected samples (CMAS7G) prepared for Chapter 3. ... 197
Table 7.3. Compositions (wt%) of selected samples in the CMAS7A pressure series prepared for Chapter 1. ... 198
Table 7.4. Compositions (wt%) of samples in the NHPG-1 pressure series prepared for Chapter 2. ... 198
Table 7.5. Ge and Ga concentrations and presence of vesicles in glass samples. ... 199
Table 7.6. Parameters obtained by fitting 27Al MAS and MQMAS NMR spectra. All fits are to spectra collected at 14.1 T unless indicated otherwise. ... 207
Table 7.7. Fit parameters used in fits to 17O spectra. ... 209
Table 7.8. Major and trace element analyses of experimental olivines. ... 210
Table 7.9. Major and trace element analyses of experimental melt. ... 214
List of Equations
Equation 2.1 ... 53Equation 2.2 ... 55
Equation 4.1 ... 116
Equation 4.2 ... 116
Equation 4.3 ... 117
Equation 4.4 ... 124
Equation 4.5. ... 133
Equation 4.6 ... 134
Equation 4.7 ... 134
Equation 4.8 ... 134
Equation 5.1 ... 152
Equation 5.2 ... 158
Equation 5.3 ... 159
Equation 5.4 ... 159
Equation 5.5 ... 159
Equation 5.6 ... 159
Equation 5.7 ... 167
Chapter 1:
Overview
Silicate liquids have been involved with much of the chemical differentiation and ongoing evolution of the Earth, and other planetary bodies. Earth is a relatively large planet, at least in comparison to the other rocky planets in our solar system, and so it can sustain very high pressures in its interior. At very high pressures, the structure and properties of silicate liquids are known to change. Yet we are only beginning to understand these changes and their consequences for planetary evolution.
This thesis is concerned with how pressure-induced changes in the structure of silicate liquids may affect the distribution of trace elements. Trace elements (elements of low abundance in a system) are widely used to test and refine our models of large-scale magmatic processes. Presently, the strength of our models is hampered by an incomplete understanding of how trace elements behave in silicate liquids at high pressures. The behaviour of trace elements is fundamentally tied to the structural changes that may occur in silicate liquids with pressure. Therefore, the objective of this thesis is to explore these structural changes and their effect on the behaviour of trace elements.
In this introductory chapter, I begin with an overview of the importance of silicate liquids in the Earth. I then discuss the geochemical constraints that we have on major magmatic processes that have occurred during Earth’s history, and show that understanding the behaviour of trace elements at high pressure is key to these models. Next I provide an overview of the structure of silicate liquids and the changes that occur with pressure, and explain how these changes may affect trace elements. I then describe how I will build on previous work in this thesis, and provide a justification for the approach I have taken. Finally I set out the research questions and the structure of the thesis.
1.1
The importance of silicate melts in the Earth
accretion (Taylor and Norman 1992). These magma oceans would have enabled efficient segregation of metal and silicate to form planetary cores, and the
subsequent crystallisation of the silicate magma could have profound influences on the differentiation of the silicate part of planets (Carlson et al. 2014). In the Earth, layers of neutrally buoyant melt may still exist in the mantle, and these melt layers may influence the distribution of volatile and incompatible trace elements (Tauzin et al. 2010). Furthermore, in geologically active planets such as the Earth and Venus, ongoing melting in the upper mantle and crust fundamentally influences the evolution of the planetary surfaces and their atmospheres (Ryan and Chauvel 2014; Mikhail and Heap 2017).
The best evidence that we have for a magma ocean on the early Earth comes from two geophysical arguments. The first argument is that the energetic nature of planetary accretion would have generated a great deal of heat. For example, the moon-forming impact should have led to extensive melting on the proto-Earth (Cameron and Benz 1991; Tonks and Melosh 1993; Elkins-Tanton 2012; de Vries et al. 2016). The second argument is that the process of core formation appears to have been so efficient that it must have occurred in a magma ocean. If there was no magma ocean, molten metal could not have percolated through a solid silicate matrix without leaving some residual metal behind. No metal is seen in the rocks of the upper mantle, so it is assumed that metal-silicate segregation must have
occurred in a magma ocean, where the process would be more efficient (e.g. Stevenson 1990; Shannon and Agee 1996; Bagdassarov et al. 2009).
However, a layer of partial melt above the transition zone in the mantle is far more well established. The basis for this is a low seismic velocity layer at about 350 km depth (Revenaugh and Sipkin 1994; Tauzin et al. 2010). It is widely accepted that this ‘low velocity layer’ is due to the presence of around 1 vol% partial melt (Tauzin et al. 2010; Hier-Majumder and Courtier 2011; Hier-Majumder et al. 2014; Freitas et al. 2017). The presence of melt can be explained by the fact that transition zone minerals can store far more water than upper mantle minerals. Any water released by transition zone minerals will lower the solidus of the upper mantle peridotite and cause partial melting (Hirschmann 2006; Freitas et al. 2017).
Magmatism is also responsible for the generation of the Earth’s crust, with continental crust produced by hydrous melting at subduction zones and oceanic crust produced by decompression melting of the mantle at mid-ocean ridges. In turn, oceanic crust subducts and is eventually recycled back into the mantle (Carlson et al. 2014). The process of plate tectonics is the only way by which the atmosphere, hydrosphere and biosphere interact with the deep Earth, and this is fundamentally influenced by magmatism (Ryan and Chauvel 2014).
1.2
Geochemical constraints on magmatic processes
at ambient pressure (e.g. Jones and Drake 1986). When Li and Agee (1996) observed that Ni and Co partition coefficients changed with pressure at different rates, they extrapolated their results to obtain a pressure of around 30 GPa for metal–silicate equilibration in a magma ocean. They postulated that this pressure corresponded to the deepest part of the magma ocean, where metallic droplets would pool and equilibrate with the silicate melt, before sinking through the solid mantle below as metal diapirs. Because this inference required extrapolating from lower to higher pressures, many subsequent studies have attempted to measure partition coefficients at ever-higher pressures. Recent studies involving many
siderophile elements model the equilibration pressure as being 40–50 GPa (Bouhifd and Jephcoat 2003; Wood et al. 2006; Kegler et al. 2008; Cottrell et al. 2009;
Bouhifd and Jephcoat 2011; Siebert et al. 2011; Mann et al. 2012; Siebert et al. 2012; Blanchard et al. 2015; Fischer et al. 2015; Laurenz et al. 2016).
Do these studies provide proof that core formation occurred in the presence of a very deep magma ocean? There are two key issues that complicate the
interpretation of these results. Firstly, despite predicted pressures of around 40–50 GPa for the base of the magma ocean, few studies have reported partitioning experiments at pressures exceeding 25 GPa; the few higher-pressure experiments reported are limited to Ni, Co, V and Cr partitioning (Bouhifd and Jephcoat 2003; Bouhifd and Jephcoat 2011; Siebert et al. 2012; Fischer et al. 2015). Therefore, many models of core formation in the Earth are based on extrapolating data
measured at <25 GPa to twice that pressure. Secondly, it has been widely discussed in recent years that metallic cores began forming in planetesimals in the first 1–2 million years of the solar system, before these planetesimals accreted to form
planets (see Halliday 2013). Therefore, siderophile trace element distributions in the Earth record a complex history of metal–silicate exchange in both the early
If a deep and long-lived magma ocean did exist on the early Earth, it might have left behind other geochemical tracers in addition to the signature of core formation recorded by siderophile elements. Many studies have tried to find evidence of mantle hetereogeneities resulting from the fractional crystallisation of a magma ocean. There is abundant petrological evidence for a magma ocean on the Moon, for example (Smith et al. 1970; Wood et al. 1970; Taylor and Norman 1992;
Wieczorek et al. 2006; Warren and Taylor 2014), but similar evidence for the Earth is surprisingly scarce. Only a few studies have claimed to have found evidence in the form of isotopic anomalies of Xe, Nd, He and Ne (Labrosse et al. 2007; e.g. Coltice et al. 2011; Mukhopadhyay 2012; Guitreau et al. 2013; Pető et al. 2013; Peters et al. 2018).
There are several reasons why finding geochemical evidence for silicate
differentiation in an early magma ocean is so difficult. Firstly, the dynamics and behaviour of a deep magma ocean are not easy to predict. For example, would it crystallise starting from the bottom (Carlson 1994; Walter and Trønnes 2004; Carlson et al. 2014), or from the middle (Stixrude et al. 2009)? And when it starts to crystallise, do the crystals remain entrained in the rapidly convecting magma, or do they segregate from the melt enabling fractional crystallisation? How and where fractional crystallisation would begin will depend on a complex interplay involving the density contrast between minerals and melts (which depends on the
dramatic events that the Earth has ever experienced. If we are to model these processes, we must better understand the properties of silicate liquids, and the partitioning of trace elements, at very high pressures.
1.3
The effect of pressure on trace element partitioning
As described in the previous section, understanding the pressure–dependence of trace element partitioning is of fundamental importance for modelling large-scale magmatic processes that have influenced the Earth’s evolution. Many studies of metal–silicate partitioning at high pressures have shown that trace element partition coefficients do depend on pressure, and in different ways for different elements (e.g. Siebert et al. 2011). In contrast, the pressure-dependence of trace element
partitioning between silicate minerals and silicate melts has been less well studied. Partly this is because the high temperatures required make these experiments more technically challenging, and it can be difficult detangle the relative effects of melt composition, pressure and temperature. A few studies that have investigated olivine–melt partitioning at very high pressures include Taura et al. (1998), Imai et al. (2012), and Suzuki et al. (2012) – these authors performed experiments up to 14, 10 and 20 GPa respectively. From a thermodynamic point of view, the exchange equilibrium between a trace element component in two coexisting phases should depend on pressure, because smaller volumes will be favoured at higher pressures (e.g. Capobianco and Watson 1982). However, there is no successful model that can predict the variation of trace element partition coefficients as a function of pressure.
The best predictive model developed for trace element partitioning so far is known as the ‘lattice strain model’, which was developed by Blundy and Wood (1994) and was built on earlier work by Onuma et al. (1968) and Brice (1975). This model is based on the concept of trace cations substituting onto particular crystal lattice sites in a mineral, with the compatibility depending on the relative ‘match’ between the trace cation and the lattice site in terms of size and charge (a concept first described by Goldschmidt 1937). Although this approach has been very successful for
and Imai et al. (2012) argue that this apparent ‘softening’ of the lattice sites is more likely to be related to a structural change in the melt. Indeed, beyond the initial attempts of Imai et al. (2012), the melt is largely ignored in the lattice strain models, and the partition coefficients are assumed to be completely controlled by the
crystallographic sites. However, as will be described next, we have a wealth of evidence to suggest that there are dramatic changes in the structure of silicate melts with pressure, which could affect trace element partitioning in unknown ways.
1.4
Silicate melt structure
A commonly-used parameter to describe melt structure is NBO/T, the ratio of non-bridging oxygens (NBO) to tetrahedrally coordinated cations (T) (Mysen et al. 1982). Bridging oxygens (BO), also known as bonding oxygens, are oxgyens that bridge between two tetrahedral units. NBO are oxygens which bond with only one tetrahedral unit, and provide weak bonds with network modifying cations.
Therefore, a higher ratio of NBO/T means a composition with more network modifiers; pure SiO2 has a theoretical NBO/T of 0, whereas basaltic melts have NBO/T of 0.6–0.9 (Mysen et al. 1982). The concept of NBO/T has been a useful tool to describe melt structure at ambient pressure, where the main control on structure is composition. However, pressure is now known to cause structural changes that are not well-encompassed by the concept of NBO/T. In particular, the coordination numbers of cations increase with pressure.
Waff (1975) was the first to propose that pressure-induced coordination changes of cations might occur in melts. This was proposed on the basis of comparison with crystal phase transitions with pressure: for example, when sodium and calcium feldspars transform into pyroxene and garnet structures, Al changes its
coordination from four-fold to six-fold. Waff (1975) suggested that similar
transitions were likely to occur in melts, and would have important consequences for melt density and viscosity. This prediction inspired a number of studies to search for experimental evidence for such coordination changes. However, the initial studies found no evidence (Fleet et al. 1984; Hochella and Brown 1985), most likely because (a) the pressures studied were not high enough, and (b) the compositions studied were NBO-poor, and we now know that coordination changes occur more readily in more NBO-rich compositions (Stebbins 2016). However, the late 1980’s and early 1990’s, unambiguous evidence for the pressure-induced coordination change of Al and Si was found using nuclear magnetic resonance (NMR) spectroscopy (Stebbins and McMillan 1989; Xue et al. 1989; Yarger et al. 1995).
Since these initial studies, a lot of research has been done to investigate structural changes of silicate melts with pressure, using a variety of techniques (Stebbins 2016). The emerging picture is that liquids accommodate initial compression by mechanisms such as shrinking of the inter-tetrahedral bond angles, and the
wide pressure range (Guillot and Sator 2007; Sanloup et al. 2013; Wang et al. 2014). Most studies on these structural changes have aimed to understand ‘structure-property relationships’ – in particular, how structural changes control physical properties like viscosity and density (Wolf and McMillan 1995). For example, polymerised compositions display a reduction in viscosity with initial compression, followed by an increase in viscosity at higher pressures (Wolf and McMillan 1995; Kono 2018), and this phenomenon has been explained in terms of the structural changes (Wang et al. 2014). Understanding these phenomena is indeed very important for physical models of magmatic processes at high pressure (Stixrude et al. 2009). However, so far, there has been little attention to how these structural changes may affect trace element partitioning.
The potential importance of coordination changes in controlling partitioning was first pointed out by Keppler and Rubie (1993). These authors showed that Co and possibly Ni increased their coordination numbers with pressure in albite glasses, using crystal field spectroscopy. However, the albite composition is quite different to the mafic or ultramafic melts that would be relevant at depth in the Earth. Compositions better resembling natural melts were studied by Jones (2012) using X-ray absorption spectroscopy (XAS). Jones showed that Ni2+ changed its
coordination from predominantly four-fold to predominantly six-fold over the pressure range of 1–4 GPa. This coincides with a change in the
pressure-dependence of its partition coefficient, suggesting that the partitioning may indeed be affected by the coordination changes. Over the same pressure range, no changes in coordination environments were observed for Co2+, W6+, Fe2+ and Fe3+, but the maximum pressure investigated was only 4 GPa (Jones 2012). More recently, de Grouchy et al. (2017) showed that Lu coordination changed abruptly from 6-fold to 8-fold at ~ 5 GPa in a model basaltic melt, using in-situ X-ray diffraction
1.5
The approach taken in this thesis
Thus far I have described how (a) silicate melts are important in Earth evolution, (b) trace element partition coefficients are useful in modelling these processes, and (c) trace element partition coefficients may depend on structural changes in silicate melt with pressure. Therefore, the overall objective of this thesis is to explore pressure-induced changes in the structure of silicate melt that may affect trace element partitioning behaviour. I will now briefly review the experimental
techniques that can be used to study coordination changes, and justify the approach taken in this thesis.
Element-specific techniques
By far the most unambiguous method of determining coordination environments, at least for Si and Al, is NMR spectroscopy (Stebbins and Xue 2014). NMR is ideal because it is element-specific, and the 4-, 5- and 6-fold coordinated peaks are easily resolved in the spectra for Si and Al (Kanzaki et al. 1992; Yarger et al. 1995). 17O NMR spectroscopy has also been used to infer different O environments as a
function of pressure (e.g. Lee et al. 2004; Allwardt et al. 2005b). However, for some elements, using NMR to determine their environment is challenging because of low natural abundances of the NMR-active nucleus, and/or large quadrupolar
broadening of the spectra, e.g. for 25Mg and 43Ca (Shimoda et al. 2008; Gambuzzi et al. 2015). A major limitation of NMR spectroscopy is that it is difficult to study trace elements, because long (and hence expensive) acquisition times are needed to obtain spectra with acceptable signal-to-noise ratios. Recording NMR spectra on samples at high temperatures and even high pressures can be done, but most studies investigate glasses at room temperature and pressure. This is because, at high
X-ray absorption spectroscopy (XAS) is another element-specific technique that has been widely used for determining cation coordination environments in glasses and melts (Henderson et al. 2014; Mastelaro and Zanotto 2018). XAS studies of
elements heavier than phosphorous are routine (Penner-Hahn 1999), and even lighter elements such as Al, Si, Mg, Ca and even O can be studied (Li et al. 1995; Poe et al. 2001; Neuville et al. 2004; Henderson et al. 2014; e.g. Moulton et al. 2016). Unlike NMR spectra, X-ray absorption spectra reflect an average of all environments in a sample, and so the spectra are more difficult to interpret, and model compounds with known coordination environments are needed. However, the real strength of XAS, especially in comparison to NMR, lies in trace element work, because good spectra can be obtained of trace elements at concentrations as low as hundreds of ppm (Sutton et al. 2005; Newville 2014). XAS studies can also be done in-situ at high temperature in furnaces (e.g. Wilke et al. 2001; Berry et al. 2003b) and at high pressure in diamond anvil cells (Cormier et al. 2007; Sanloup et al. 2018) or large-volume presses (Pohlenz et al. 2018).
X-ray Raman scattering (XRS), also known as inelastic X-ray scattering, is a novel technique in which ‘hard’ X-rays can be used to obtain spectra from light elements. For light elements, this is a significant advantage, because the ‘soft’ x-rays that would be used for traditional XAS are easily attenuated in air. XRS has has been used to investigate changes in the local environment around O and Si with pressure (Lee et al. 2014), and may be a promising tool for future ultra-high pressure
research (Petitgirard 2017).
Other techniques
Raman spectroscopy has been used by many authors to investigate changes in the structure of compressed melts and glasses (Xue et al. 1991; e.g. Poe et al. 2001). However, as a vibrational spectroscopy, Raman spectra arise from many different vibrational modes of all species present in a sample, and so peak assignment can be difficult in a multicomponent glass. Some studies investigate simple systems
high-pressure experiments are routine (Durben and Wolf 1991; e.g. Deschamps et al. 2009; Kojitani et al. 2013) and do not require access to a synchrotron light source. X-ray and neutron diffraction also provide valuable information about the structure of high-pressure glasses and melts (Salmon and Zeidler 2015). X-ray diffraction (XRD) has been used on glasses at room pressure (e.g. Tan and Arndt 1999), at high pressure but room temperature (e.g. Meade et al. 1992), and at high pressure and temperature (e.g. Funamori et al. 2004; Sanloup et al. 2013; de Grouchy et al. 2017). Diffraction suffers from similar limitations as Raman spectroscopy, in that it is not element-specific, and so interpreting the contributions to the integrated
diffraction patterns in multicomponent systems can be challenging. For example, in order to estimate coordination numbers of Si using XRD on a basaltic melt,
Sanloup et al. (2013) had to make large assumptions about the coordination number of Al. Recently, de Grouchy et al. (2017) used a novel approach to apply the method to a ‘trace’ element (Lu, present at 4 wt% in the melt). These authors collected data from Lu-bearing and Lu-free compositions in order to isolate the contribution of Lu. They found evidence for a coordination change of Lu using this strategy, however their fits were also based on assumed Al coordination
environments from literature data. Nevertheless, this may be a promising approach for future work.
Finally, it should be noted that many studies have used molecular dynamic
simulations to investigate coordination changes of major elements in silicate melts with pressure (Karki 2010). Studies have investigated both simple systems such as GeO2 (e.g. Shanavas et al. 2006), multicomponent CMAS systems (e.g. Matsui 1996) and ‘natural’ systems (Guillot and Sator 2007). There is also promising work looking at trace element partitioning from this viewpoint (Wagner et al. 2017). Molecular dynamical studies can provide valuable information, often before the technical capabilities are available to verify the results experimentally. However, a detailed review of the findings of these studies is beyond the scope of this chapter.
Justification of the approach taken in this thesis
chosen because it provides the least ambiguous data for major elements. For both techniques, studying glasses ex situ, rather than melts in situ, was easier – this enabled large datasets to be collected, so that the results could be shown to be reproducible, and the NMR spectra could be interpreted with less ambiguity. However, there are structural differences between a glass and its corresponding melt at high pressure and temperature. When a melt is quenched, the structure continues to rearrange until it becomes so viscous that it ‘falls out of equilibrium’ with the rapidly dropping temperature. At this point, the melt structure is ‘frozen in’, and the temperature at which this occurs is known as the ‘fictive temperature’, Tf (Stebbins 2016). The structure of a glass therefore does not represent the
temperature at which it was melted; it represents Tf. For a perfectly isobarically quenched melt, the pressure recorded by the melt structure (the ‘fictive pressure’, Pf) should equal the pressure at which the sample was melted and quenched, but
whether isobaric quenching is really possible in practice is questionable. These factors will be discussed in more detail in Chapter 2.
Trace element partitioning experiments were undertaken to complement the XAS and NMR data. The advantage of partitioning experiments is that the problems associated with quenching glasses are not an issue, because the distribution of trace elements is set during the experiment and chemical diffusion cannot occur on the fast timescale of the quench. I chose olivine–melt as the system to study for the partitioning experiments, rather than a metal-silicate system. This was because the composition of olivine should not vary much between experiments, so the effect of a change in the melt should be easier to interpret.
Two trace elements were chosen for study in this thesis: Ge and Ga. These elements were chosen for two reasons. Firstly, Ge and Ga are moderately
siderophile elements that have been used in many models of core formation in the Earth (Schmitt et al. 1989; Walker et al. 1993; Hillgren et al. 1996; Jana and Walker 1997a; Jana and Walker 1997b; Capobianco et al. 1999; Holzheid et al. 2007; Righter et al. 2011; Siebert et al. 2011; Blanchard et al. 2015; Righter et al. 2017). The high-pressure partitioning behaviour of these elements is therefore of interest in these models. Secondly, Ge and Ga are expected to undergo
radii. This means that germanate minerals undergo pressure-induced phase changes at lower pressures than silicate minerals (Ringwood 1970). In addition, the
coordination number of Ge in GeO2 glass increases at lower pressures than that of Si in SiO2 glass (Itié et al. 1989; Ohtaka et al. 2001; Ohtaka et al. 2002; Majérus et al. 2004; Ohtaka et al. 2004; Vaccari et al. 2009; Baldini et al. 2010; Hong et al. 2014). It is reasonable to expect the same phenomenon to occur when Ge and Ga are dissolved in multicomponent melts as trace elements, but this has never been tested.
Finally, while the coordination of Ge4+ was investigated in this work, some studies have suggested that Ge2+ may be stable in silicate melts at low oxygen fugacity (fO2). If so, this might have important consequences for both the study of Ge4+ coordination undertaken here, and for Ge geochemistry in general. It has long been known that a given element in a different redox state can have a vastly different behaviour. The most well-known example of this is iron, which is the most abundant multivalent element in the upper mantle (Osborn 1959). Fe2+ and Fe3+ behave so differently that they are often treated as different elements (Berry et al. 2003a). Reactions involving Fe2+ and Fe3+ control the oxygen fugacity of the mantle (Frost 1991; Frost and McCammon 2008). The oxygen fugacity, in turn, controls the valence state of multivalent trace elements, such as V, Cr, Mn, Ti, and Eu. Understanding how the different oxidation states of these trace elements partition between minerals and melts can then provide a wealth of information, both in terms of recording the oxygen fugacities at which rocks formed (Mallmann and O’Neill 2009; Trail et al. 2012; e.g. Mallmann and O’Neill 2013) and identifying particular magmatic processes (e.g. Eu is often used to identify the crystallisation of plagioclase from a melt; Weill and Drake 1973). The existing data indicate that Ge2+ may be stable at low fO
1.6
Research questions and thesis structure
The first research question addressed in this thesis is: do Ge4+ and Ga3+ undergo pressure-induced coordination changes when dissolved as trace cations in silicate melts? To answer this question, a series of Ge- and Ga-doped glasses were made at a range of pressures. The glasses were made using two approaches: either
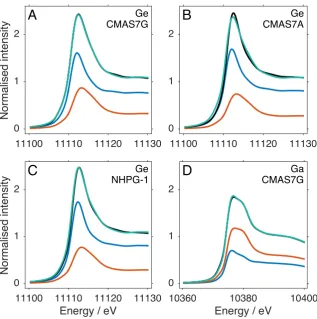
quenching melts from high temperature, or annealing the glass near the ‘glass transition temperature’ (Tg, the temperature at which a glass relaxes into a liquid). Ge- and Ga- K edge X-ray absorption near edge structure (XANES) spectra of these glasses were recorded. The XANES spectra show that both Ge and Ga increase their average coordination number with pressure, from around 1–2 GPa up to at least 10 GPa, and probably higher.
A surprising result was observed in the XANES spectra: in a particular set of samples, both Ge and Ga average coordination increased rapidly between 4 and 5 GPa. These two elements are not expected to behave in a similar way to one
How do such coordination changes affect trace element partitioning? This is the third research question addressed in this thesis. To address this, Ge4+ partitioning between olivine and melt was studied. The olivine–melt system was chosen rather than metal–silicate, because the composition of olivine is relatively constant
regardless of the pressure, temperature and melt composition. Thus, changes in the partitioning can be attributed more easily to changes occurring in the structure of the silicate melt. Ge4+ is shown to become slightly more incompatible (having a preference for the melt) with pressure, whereas the opposite would be predicted in the absence of any coordination changes. However, quantitatively predicting how the coordination changes of Al3+ and Ge4+ in the silicate melt affect partitioning was unsuccessful. This highlights the need for a new form of an equation of state that incorporates coordination changes.
Finally, the fourth research question addressed in this thesis is: at what fO2 does Ge2+ become stable? To answer this, Ge valence state was determined using XAS in a series of glasses quenched from melts at a range of fO2. The spectra show that that Ge4+ transitions to Ge2+ between ∆IW +2 and ∆IW -2, where IW is the fO
2 at the iron–wüstite buffer. Therefore, Ge2+ was most likely to be the stable species at the time of core formation in the Earth. Preliminary experiments on the partitioning of Ge2+ between olivine and melt indicate that this species is highly incompatible, in contrast to Ge4+ which has a partition coefficient of close to one. Whether Ge2+ undergoes pressure-induced coordination changes is unknown.
Structure of this thesis
This thesis is organised into four main chapters, each addressing one of the research questions described above. The coordination environments of Ge4+ and Ga3+ in silicate melts are investigated in Chapter 2; a possible relationship between major and trace element coordination is assessed in Chapter 3; the effect of these
Chapter 2:
Coordination change of Ge
4+and
Ga
3+in silicate melt with pressure
Abstract–The increase in the coordination numbers of Si and Al in silicate melts
has been well studied, but few trace elements have been investigated to see if they do the same. In this work, the coordination of Ge and Ga in silicate glasses was studied using X-ray absorption spectroscopy. The glasses were prepared either by quenching melt or annealing glass at a range of pressures. Both Ge and Ga increase their coordination number with pressure from about 2 up to at least 10 GPa. The rate of the coordination change of Ge with pressure is higher in more
2.1
Introduction
As discussed in Chapter 1, pressure-induced changes in the coordination number of Ge and Ga are expected in silicate melts for two reasons. Firstly, Ge and Ga are geochemically similar to Si and Al respectively, both of which increase their coordination number with increasing pressure (Wolf and McMillan 1995). Secondly, coordination changes have been observed in germanate and gallate glasses (Micoulaut et al. 2006; Cormier et al. 2007), as well as in chalcogenide glasses (e.g. Durandurdu and Drabold 2002; Yildirim et al. 2016). However, natural melts will contain Ge and Ga in trace quantities only. In this chapter I test the hypothesis that Ge and Ga will undergo pressure-induced coordination changes when dissolved as trace elements in multi-component melts.
X-ray absorption spectroscopy (XAS) is an ideal technique with which to test this hypothesis. XAS is element-specific, and the spectra are sensitive to the local environment of the element of interest. Spectra are plotted as the absorption of rays by the sample (or fluorescence of rays from the sample) as a function of X-ray energy. Absorption or fluorescence is at a maximum when the energy matches the binding energy of core electrons in the element of interest. Above this energy, the average local environment of the target element in the sample modulates the probability of absorption. Thus, changes in the shape of the spectra reflect changes in the local environment, including the coordination number. Quantitative
information on coordination numbers and bond lengths can be obtained from the part of the spectrum well above the absorption edge, known as the extended X-ray absorption fine structure (EXAFS). On the other hand, the part of the spectrum close to the absorption edge, known as X-ray absorption near edge structure
(XANES), is more sensitive to changes in local environment. XAS has been used in many previous studies to determine coordination changes of Ge in germanate glasses (Itié et al. 1989; Ohtaka et al. 2001; Ohtaka et al. 2002; Majérus et al. 2004; Ohtaka et al. 2004; Cormier et al. 2007; Vaccari et al. 2009; Baldini et al. 2010; Hong et al. 2014), and Ga in sodium gallosilicate and sodium gallogermante glasses (Cormier et al. 2007).
the second set were prepared by taking a quenched melt prepared at 1 atm, and then annealing that glass at temperatures near the glass transition temperature (Tg), and a range of pressures. These samples are referred to as ‘annealed glasses’
throughout this thesis.
For quenched melts, it is well recognized that the structure of the glass is not the same as the structure of the actual melt at high temperature and pressure (Stebbins 2016). One difference is that the melt structure does not reflect the temperature of synthesis; it reflects the ‘fictive temperature’ (Tf). Tf is the temperature at which the viscosity of the melt is too high to allow for structural rearrangement on the
timescale of cooling, i.e. the temperature at which the melt structure is ‘frozen in’. The other possible difference is that the melt structure may not reflect the pressure of synthesis, instead reflecting a lower ‘fictive pressure’ (Pf). This could result from localised pressure drops within the melt during the quench, because when the temperature drops, either the sample or the surrounding assembly may shrink, leading to pressure drops which cannot be instantaneously compensated for by the apparatus applying more pressure (Bista et al. 2015; Gaudio et al. 2015b).
Annealed glasses were synthesised in an effort to reduce the effect of a pressure drops during quenching. The rationale behind this is that because the experimental run temperature is lower, the temperature drop needed to ‘freeze in’ the structure (i.e. cross the glass transition) is smaller, and the time taken to reach the glass transition will also be shorter. These factors should reduce the likelihood that localised pressure drops in the sample will affect the Pf recorded. Indeed, previous work has shown that annealed glasses record higher densities and Al coordination numbers than quenched melts made at the same pressure (Bista et al. 2015; Gaudio et al. 2015b). Gaudio et al. (2015b) suggested that the differences in density and Al coordination between quenched melts and annealed glasses of albite composition could be explained entirely by a higher Pf in the annealed glasses.
Pf, as for the quenched melt experiments. To estimate an appropriate temperature/timescale, Tg analysis was used.
Tg can be measured for a glass sample using a range of methods, including
differential scanning calorimetry (Moynihan 1995). In this method, heat capacity (Cp) is measured while the glass is heated at a constant rate, typically 10 ºC/min, and the glass transition temperature is found as a maximum or a slope break in the Cp–T curve. Tg depends on the heating rate (Moynihan et al. 1974), and so in this thesis, when Tg is quoted as a number, this means Tg measured at a heating rate of 10 º/min.
Once the Tg of the composition used in this study was known, the annealed glass experiments were performed at temperatures close to Tg. The samples were held at these temperatures for (typically) two hours; a longer timescale than the timescale of heating for Tg analysis, to ensure structural relaxation. However, some
experiments were performed at lower temperatures, and because we have no precise constraints on how the glass transition varies with the timescale, it is unknown whether these samples were still behaving as liquids. If they were not behaving as liquids, a much lower Pf would be expected, because the glass should not have the capability to relax fully at the pressure of the experiment. Indeed, this may well have occurred for some of the samples, as will be shown.
In this chapter XANES spectra are presented that show the coordinations of Ge and Ga are unaffected by composition at low pressure, but increase with pressure in both quenched melts and annealed glasses. The difference in results between
quenched melts and annealed glasses is surprising, as is the similarity of the results for the two elements. These features raise questions that will be addressed using nuclear magnetic resonance spectroscopy in Chapter 3.
2.2
Methods
Sample synthesis
The glasses in this study were synthesised from 13 different starting materials, which are listed in Table 2.1. Powdered oxide mixes of several compositions
additional material for the CMAS7G composition, were synthesised from reagent grade SiO2, Al2O3, MgO, and TiO2 (all dried at 1000 °C), Na2CO3, K2CO3 and Ca3(PO4)2 (all dried at 200 °C), and CaCO3, Fe2O3, and Cr2O3 (which were not dried). These reagents were mixed under acetone in an agate mortar, and the mix was then dried as a powder at 110 °C, pelletised and decarbonated by firing in air at
[image:39.595.109.545.243.573.2]1050 °C. Approximately 3000 ppm reagent grade GeO2 and/or Ga2O3 was then added to the starting materials, and mixed thoroughly under acetone.
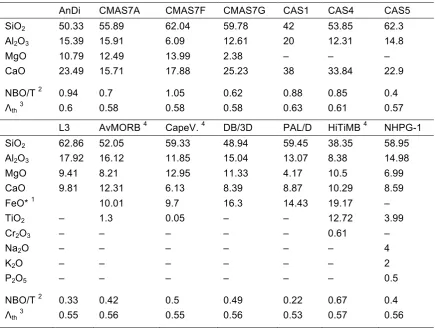
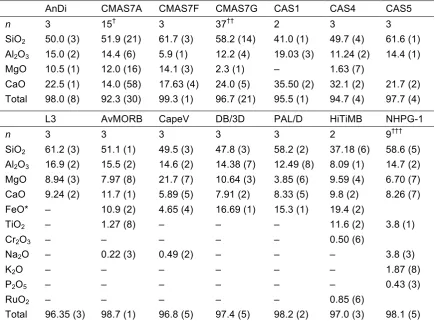
Table 2.1. Nominal compositions of starting mixes (wt% oxide).
AnDi CMAS7A CMAS7F CMAS7G CAS1 CAS4 CAS5 SiO2 50.33 55.89 62.04 59.78 42 53.85 62.3
Al2O3 15.39 15.91 6.09 12.61 20 12.31 14.8
MgO 10.79 12.49 13.99 2.38 – – – CaO 23.49 15.71 17.88 25.23 38 33.84 22.9 NBO/T 2 0.94 0.7 1.05 0.62 0.88 0.85 0.4
Λth3 0.6 0.58 0.58 0.58 0.63 0.61 0.57
L3 AvMORB 4 CapeV. 4 DB/3D PAL/D HiTiMB 4 NHPG-1 SiO2 62.86 52.05 59.33 48.94 59.45 38.35 58.95
Al2O3 17.92 16.12 11.85 15.04 13.07 8.38 14.98
MgO 9.41 8.21 12.95 11.33 4.17 10.5 6.99 CaO 9.81 12.31 6.13 8.39 8.87 10.29 8.59 FeO* 1 10.01 9.7 16.3 14.43 19.17 – TiO2 – 1.3 0.05 – – 12.72 3.99
Cr2O3 – – – – – 0.61 –
Na2O – – – – – – 4
K2O – – – – – – 2
P2O5 – – – – – – 0.5
NBO/T 2 0.33 0.42 0.5 0.49 0.22 0.67 0.4
Λth3 0.55 0.56 0.55 0.56 0.53 0.57 0.56 1 FeO* refers to total iron expressed as FeO. 2 NBO/T is the ratio of non-bridging oxygens to
tetrahedrally coordinated cations. This was calculated following Appendix 1 in Mills (1993). The calculation requires knowing the Fe3+/Fe2+ ratio, because Fe2+is a network modifier whereas Fe3+ may act as a network former. Equation 7 in Kress and Carmichael (1991) was used to find the Fe2O3/FeO ratio for each composition, assuming an fO2 of air, pressure of 1 atm, and
temperature of 1400 °C. This results in 2Fe2O3/(FeO+2Fe2O3) of approximately 0.6 for all the
Fe-bearing compositions in this study. For the NBO/T calculation, all Fe3+ is assumed to be a network former in tetrahedral coordination (Mysen and Richet, 2005). 3Λthrefers to a theoretical
optical basicity, which was calculated based on the stoichiometry of the composition following Equation 2 in Duffy and Ingram (1993) using optical basicities of oxides from Ottonello et al. (2001). 4 Composition name abbreviations are AvMORB = Average MORB, CapeV. = Cape Vogel, and HiTiMB = High-Ti Mare Basalt.
with polyethylene oxide glue, loaded onto Pt/Rh wire loops, and hung in the furnace from a Pt wire chandelier. The Ge-doped samples were prepared in Pt capsules, which were welded shut at one end and crimped at the other end, because of the greater volatility of Ge. Larger batches of Ge- and Ga-doped glass were required to prepare the annealed glasses. Initially, these batches were made by melting the powdered oxide composition in graphite crucibles for about 15 min at 1300 °C. However, these samples retained very little Ge, despite the short run time.
This is probably because the graphite crucible imposed a low fO2 on the melt, increasing the volatility of Ge. To avoid this problem, subsequent samples were prepared in alumina crucibles. All ambient-pressure samples were prepared in air and quenched in water.
High-pressure experiments up to 6 GPa were conducted using end-loaded Boyd-England type piston cylinder apparatuses (200 T apparatuses were used up to 4 GPa, and 500 T from 4.5–6 GPa). For the quenched melt experiments, each sample was prepared by loading 50-60 mg of the oxide starting material into a 3.5 mm diameter Pt capsule, with ~5-6 mg of a Ru-RuO2 oxygen buffer mix (80% RuO2, 20% Ru) packed at each end of the capsule. The annealed glass experiments were prepared by loading powdered glass into 3.5 mm diameter Ag or Pt capsules with no oxygen buffer. Before welding the capsules shut, they were crimped loosely and dried at 110 °C overnight. Capsules in the quenched melt experiments were placed in an assembly composed of MgO, graphite, Pyrex and NaCl (see Figure 2.1); annealed glass experiments were run at low temperatures and so Pyrex was omitted from the assembly. This assembly was wrapped in Teflon foil and inserted into a 1/2” or 5/8” pressure vessel (the 5/8” assembly was only used for pressures up to 0.5 GPa). A Type B thermocouple, sheathed in mullite with a 5 mm alumina tip, was inserted through a bore in the top MgO spacer. The samples were equilibrated for 10 min to 24 h, at the temperatures and pressures listed inTable 2.2, Table 2.3,
Figure 2.1. Cross section through a piston cylinder assembly.
Three annealed glass experiments were also conducted at higher pressures (8 and 10 GPa) in a 1200 T split sphere multi-anvil apparatus. For each experiment, the powdered glass starting material was packed into a 3.5 mm diameter Pt capsule, which was inserted into a Geophysical Lab 14/8 “G2” box assembly. This assembly consists of a box-shaped graphite heater surrounded by alumina and zirconia sleeves, inserted into an MgO octahedron (for a full description, refer to Leinenweber et al. 2012), and allows for a relatively large sample volume and reduced temperature gradients. A Type C thermocouple, sheathed in alumina, was used. The octahedron was placed in the centre of eight truncated cubes made of Toshiba F grade tungsten carbide, with pyrophyllite gaskets. Fibreglass sheets were used to insulate the outer faces of the cubes from the anvils, and copper electrodes on two of the cubes enabled power to flow through the heater. The experimental conditions are listed inTable 2.4. The pressure was ramped up over 6-20 h, and the sample was then heated at 100 °C/min to the desired temperature, held for 2 h, and
then power was cut to quench the sample. Pressure was then slowly released over ~12 h.
Pt capsule MgO
Graphite heater Pyrex NaCl
Steel top plug
Pyrophyllite Mitre Type B thermocouple bead Alumina Mullite
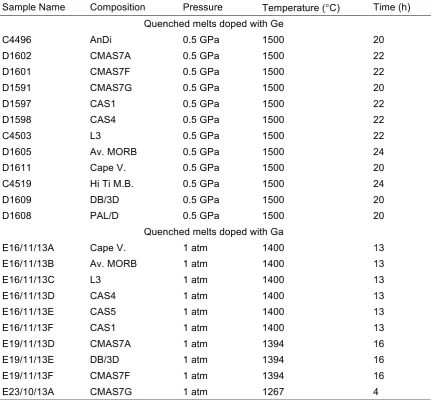
Table 2.2. Ge- and Ga-doped quenched melt samples (composition series).
Sample Name Composition Pressure Temperature (°C) Time (h)
Quenched melts doped with Ge
C4496 AnDi 0.5 GPa 1500 20 D1602 CMAS7A 0.5 GPa 1500 22 D1601 CMAS7F 0.5 GPa 1500 22 D1591 CMAS7G 0.5 GPa 1500 20 D1597 CAS1 0.5 GPa 1500 22 D1598 CAS4 0.5 GPa 1500 22 C4503 L3 0.5 GPa 1500 22 D1605 Av. MORB 0.5 GPa 1500 24 D1611 Cape V. 0.5 GPa 1500 20 C4519 Hi Ti M.B. 0.5 GPa 1500 24 D1609 DB/3D 0.5 GPa 1500 20 D1608 PAL/D 0.5 GPa 1500 20
Quenched melts doped with Ga
Table 2.3. Ge- and Ga-doped quenched melt samples (pressure series).
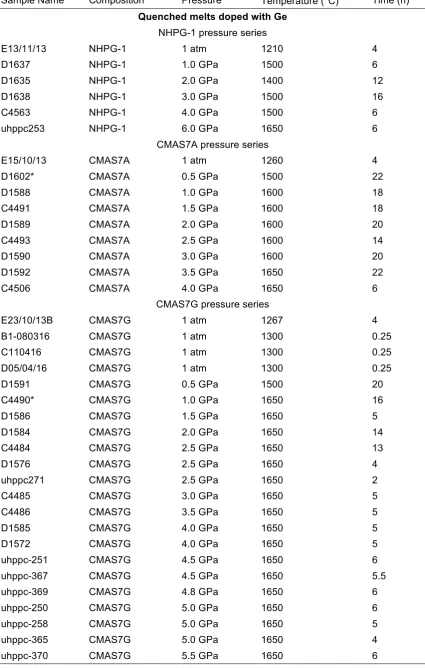
Sample Name Composition Pressure Temperature (°C) Time (h)
Quenched melts doped with Ge
NHPG-1 pressure series
E13/11/13 NHPG-1 1 atm 1210 4 D1637 NHPG-1 1.0 GPa 1500 6 D1635 NHPG-1 2.0 GPa 1400 12 D1638 NHPG-1 3.0 GPa 1500 16 C4563 NHPG-1 4.0 GPa 1500 6 uhppc253 NHPG-1 6.0 GPa 1650 6
CMAS7A pressure series
E15/10/13 CMAS7A 1 atm 1260 4 D1602* CMAS7A 0.5 GPa 1500 22 D1588 CMAS7A 1.0 GPa 1600 18 C4491 CMAS7A 1.5 GPa 1600 18 D1589 CMAS7A 2.0 GPa 1600 20 C4493 CMAS7A 2.5 GPa 1600 14 D1590 CMAS7A 3.0 GPa 1600 20 D1592 CMAS7A 3.5 GPa 1650 22 C4506 CMAS7A 4.0 GPa 1650 6
CMAS7G pressure series
Table 2.3. (Continued).
Sample Name Composition Pressure Temperature (°C) Time (h)
Quenched melts doped with Ga
CMAS7G pressure series
[image:44.595.52.490.399.747.2]E23/10/13A* CMAS7G 1 atm 1267 4 B1-080316 CMAS7G 1 atm 1300 0.25 D1604 CMAS7G 0.4 GPa 1650 24 D1580 CMAS7G 1.0 GPa 1650 4 D1578 CMAS7G 2.0 GPa 1650 5 D1576 CMAS7G 2.5 GPa 1650 4 D1574 CMAS7G 3.0 GPa 1650 4 D1577 CMAS7G 3.5 GPa 1650 14 D1572 CMAS7G 4.0 GPa 1650 5 uhppc-367 CMAS7G 4.5 GPa 1650 5.5 uhppc-369 CMAS7G 4.8 GPa 1650 6 uhppc-258 CMAS7G 5.0 GPa 1650 5 uhppc-365 CMAS7G 5.0 GPa 1650 4 uhppc-370 CMAS7G 5.5 GPa 1650 6
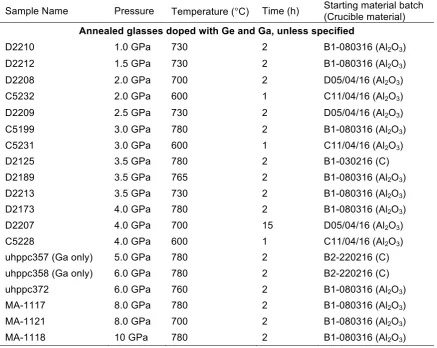
Table 2.4. Ge- and Ga-doped annealed glass samples.
Sample Name Pressure Temperature (°C) Time (h) Starting material batch (Crucible material)
Annealed glasses doped with Ge and Ga, unless specified
D2210 1.0 GPa 730 2 B1-080316 (Al2O3)
D2212 1.5 GPa 730 2 B1-080316 (Al2O3)
D2208 2.0 GPa 700 2 D05/04/16 (Al2O3)
C5232 2.0 GPa 600 1 C11/04/16 (Al2O3)
D2209 2.5 GPa 730 2 D05/04/16 (Al2O3)
C5199 3.0 GPa 780 2 B1-080316 (Al2O3)
C5231 3.0 GPa 600 1 C11/04/16 (Al2O3)
D2125 3.5 GPa 780 2 B1-030216 (C) D2189 3.5 GPa 765 2 B1-080316 (Al2O3)
D2213 3.5 GPa 730 2 B1-080316 (Al2O3)
D2173 4.0 GPa 780 2 B1-080316 (Al2O3)
D2207 4.0 GPa 700 15 D05/04/16 (Al2O3)
C5228 4.0 GPa 600 1 C11/04/16 (Al2O3)
uhppc357 (Ga only) 5.0 GPa 780 2 B2-220216 (C) uhppc358 (Ga only) 6.0 GPa 780 2 B2-220216 (C) uhppc372 6.0 GPa 760 2 B1-080316 (Al2O3)
MA-1117 8.0 GPa 780 2 B1-080316 (Al2O3)
MA-1121 8.0 GPa 700 2 B1-080316 (Al2O3)