This is a repository copy of Interaction Data Sets In The UK: An Audit. White Rose Research Online URL for this paper:
http://eprints.whiterose.ac.uk/4491/
Monograph:
Dennett, A., Duke-Williams, O. and Stillwell, J. (2007) Interaction Data Sets In The UK: An Audit. Working Paper. The School of Geography, The University of Leeds
School of Geography Working Paper 07/5
[email protected] https://eprints.whiterose.ac.uk/
Reuse
Unless indicated otherwise, fulltext items are protected by copyright with all rights reserved. The copyright exception in section 29 of the Copyright, Designs and Patents Act 1988 allows the making of a single copy solely for the purpose of non-commercial research or private study within the limits of fair dealing. The publisher or other rights-holder may allow further reproduction and re-use of this version - refer to the White Rose Research Online record for this item. Where records identify the publisher as the copyright holder, users can verify any specific terms of use on the publisher’s website.
Takedown
If you consider content in White Rose Research Online to be in breach of UK law, please notify us by
INTERACTION DATA SETS IN THE UK:
AN AUDIT
Adam Dennett, Oliver Duke-Williams and John Stillwell
Centre for Interaction Data Estimation and Research (CIDER)
School of Geography University of Leeds
Leeds LS2 9JT United Kingdom
June 2007
ii
This working paper is an online publication and may be revised.
Full contact details of the authors are:
School of Geography, University of Leeds, Leeds,
LS2 9JT
Tel: +44 (0 in UK) 113 34 33300 Fax: +44 (0 in UK) 113 34 33308
Adam Dennett
Oliver Duke-Williams
John Stillwell
iii
Contents
Acknowledgements iv
Glossary of Acronyms iv
List of Figures vii
List of Tables vii
Preface ix
1 Introduction 1
2 Census Interaction Data Sources 5
2.1 Census Tables 5
2.2 Origin-Destination Statistics 7
2.3 Commissioned Tables 10
2.4 Samples of Anonymised Records 12
2.5 Longitudinal Studies 18
3 Administrative Interaction Data Sources 25
3.1 NHSCR Data for England and Wales, 1975-1998 25
3.2 NHSCR and Patient Register Data since 1998 for
England and Wales 57
3.3 NHSCR and Patient Register data since 1998 and for
Scotland and Northern Ireland 69
3.4 Pupil Commuting Data from the PLASC 71
3.5 Student Interaction Data from HESA 73
3.6 Hospital Episode Statistics 77
3.7 Worker Registration Data 79
3.8 National Insurance Number Statistics 80
3.9 Home Office Asylum Seekers and Visitor Switchers 82
3.10 Other Sources 83
4 Survey Interaction Data Sources 88
4.1 Labour Force Survey 88
4.2 International Passenger Survey 95
4.3 General Household Survey and Northern
Ireland Continuous Household Survey 99
4.4 Integrated Household Survey (formerly
Continuous Population Survey) 101
4.5 National Travel Survey 102
4.6 Summary 104
5 Conclusions 106
References 113
iv Acknowledgement
The Centre for Interaction Data Estimation and Research (CIDER) is a Data Support
Unit, funded (RES-348-25-0005) by the Economic and Social Research Council as
part of the Census Programme, 2006-2011.
Glossary of Acronyms
AF Armed Forces
APS Annual Population Survey
ARIMA AutoRegressive Integrated Moving Average
ASCII American Standard Code for Information Interchange
BCS British Cohort Study
BHPS British Household Panel Survey
CAMS Controlled Access Microdata Sample
CAS Census Area Statistics
CASWEB Census Area Statistics on the Web
CD Compact Disk
CeLSIUS Centre for Longitudinal Study Information and User Support
CHI Central Health Index (in Northern Ireland)
CHI Community Health Index (in Scotland)
CHS Continuous Household Survey
CIDER Centre of Interaction Data Estimation and Research
CIDS Census Interaction Data Service
CPS Continuous Population Survey
CSA Central Services Agency
CSO Central Statistical Office
DAS Destination-Age-Sex
DETR Department for Environment, Transport and the Regions
DfES Department for Skills and Education
DOB Date Of Birth
DOM Date Of Migration
DVLA Driver and Vehicle Licensing Agency
DWP Department of Work and Pensions
EEA European Economic Area
EFS Expenditure and Food Survey
ELSA English Longitudinal Study of Ageing
ESDS Economic and Social Data Service
ESRC Economic and Social Research Council
EU European Union
FE Further Education
FHSA Family Health Service Authority
FPC Family Practitioner Committee
GCSE General Certificate of Secondary Education
GB Great Britain
GBLFS Great Britain Labour Force Survey
GHS General Household Survey
v
GROS General Register Office Scotland
HA Health Area
HBA Health Board Area
HE Higher Education
HEI Higher Education Institution
HES Hospital Episode Statistics
HESA Higher Education Statistics Agency
HM Her Majesty
HO Home Office
HRP Household Reference Person
HSE Health Survey for England
IC Information Centre
IHS Integrated Household Survey
ILR Individual Learner Record
IMPS Improving Migration and Population Statistics
IOM Isle Of Man
IPS International Passenger Survey
IPSS Integrated Population Statistics System
KS Key Statistics
LAD Local Authority District
LEA Local Education Authority
LGD Local Government District
LFS Labour Force Survey
LLSOA Lower Layer Super Output Area
LS Longitudinal Study
LSC Learning and Skills Council
LSCS Longitudinal Studies Centre - Scotland
LSEM Longitudinal Study of Ethnic Minorities
LSYPE Longitudinal Study of Young People in England
MGRP Moving Group Representative Person
MLSOA Middle Layer Super Output Area
NCDS National Child Development Survey
NeSS Neighbourhood Statistics Service
NHS National Health Service
NHSCR National Health Service Central Register
NHSISD National Health Service Information Statistics Directorate
NI Northern Ireland
NI CHI Northern Ireland Central Health Index
NI IC Northern Ireland Information Centre
NI LFS Northern Ireland Labour Force Survey
NILS Northern Ireland Longitudinal Study
NINo National Insurance Number
NIRS National Insurance Recording Scheme
NI SAR Northern Ireland Sample of Anonymised Records
NISRA Northern Ireland Statistics and Research Agency
NOMIS National Online Manpower Information System
NPD National Pupil Database
NSHD National Survey of Health and Development
NS-SEC National Statistics SocioEconomic Classification
vi
OA Output Area
OAS Origin-Age-Sex
OD Origin-Destination
ODPM Office of the Deputy Prime Minister
OMN OMNibus Survey
ONS Office of National Statistics
OPCS Office of Population Censuses and Surveys
OSI Office of Science and Innovation
PAS Patient Administration System
PC Parliamentary Constituency
PCT Primary Care Trust
PGCE Postgraduate Certificate in Education
PIAG Patient Information Advisory Group
PLASC Pupil Level Annual School Census
PRDS Patient Register Data System
PUD Primary Unit Data
QNHS Quarterly National Household Survey
SAM Small Area Microdata
SAR Sample of Anonymised Records
SCAG Security and Confidentiality Advisory Group
SCAM Small Cell Adjustment Method
SDC Statistical Disclosure Control
SEN Special Education Needs
SHA Strategic Health Authority
SIC Standard Industrial Classification
SLS Scottish Longitudinal Study
SMS Special Migration Statistics
SNHSCR Scottish National Health Service Central Register
SOA Super Output Area
SOC Standard Occupational Classification
SPSS Statistical Package for the Social Sciences
ST Standard Table
STS Special Travel Statistics
SWS Special Workplace Statistics
TDOM True Date Of Migration
TIM Total International Migration
TIMMIG TIMe Series MIGration
UA Unitary Authority
UCAS University Central Admissions System
UK United Kingdom
UKBORDERS United Kingdom Boundary Outline and Reference Database for
Education and Research Study
UKLHS United Kingdom Household Longitudinal Survey
UPN Unique Pupil Number
UPTAP Understanding Population Trends And Processes
WICID Web-based Interface to Census Interaction Data
vii List of Figures
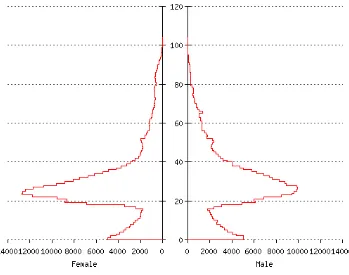
Figure 3.1 Five records of primary unit data for 1998Q2 Figure 3.2: Age and sex structure of moves in 1998Q1 Figure 3.3: Daily registrations counts, 1998Q1
Figure 3.4: Acceptance dates for migrants contained in 1997 quarterly files
Figure 3.5: Acceptance dates in 1997 for migrants contained in 1997 quarterly files Figure 3.6: Acceptance and migration dates for migrants in 1997 quarterly files
Figure 3.7: Levels of movement, at three spatial scales, 1975-98 Figure 3.8: Compatibility of FHSA and HA boundaries
Figure 3.9: 2001 Health Authority boundaries in the UK
Figure 3.10: An almost complete hierarchy and connectivity of UK geographies, 2007 Figure 3.11: Eurostat’s interface to internal migration data
List of Tables
Table 2.1: Detail from KS Table 24 at district level
Table 2.2: Tables and counts in the 2001 and 1991 interaction data sets held in
WICID
Table 2.3: Commissioned tables with ‘origin’ and ‘destination’ in the table title Table 2.4: Type of geography and numbers of areas for spatial variables in the 1991
SAR data sets
Table 2.5: Type of geography and numbers of areas for spatial variables in the 2001 SAR and CAMS data sets
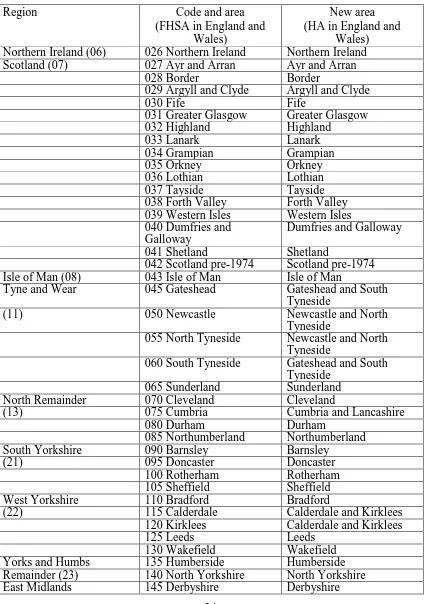
Table 3.1: Main changes in the NHSCR record structure Table 3.2: Current entity descriptions
Table 3.3: Codes for UK areas used in NHSCR
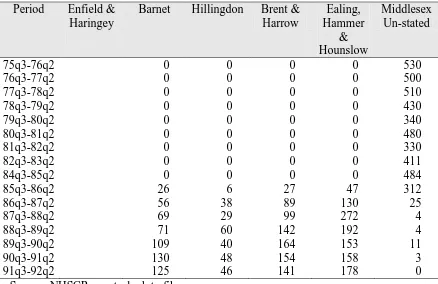
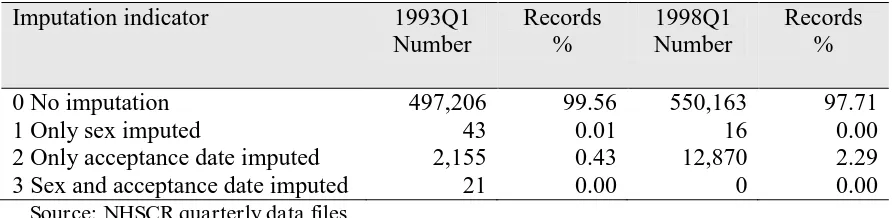
Table 3.4: NHSCR flows from Middlesex to Leeds, 1975-76 to 1991-92 Table 3.5: Records with date of birth imputation, 1993Q1 and 1998Q1
Table 3.6 Records with sex and acceptance date imputed, 1993Q1 and 1998Q1
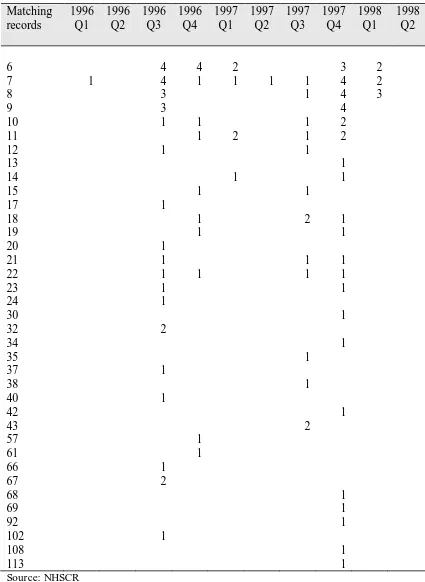
Table 3.7: Incidence of matching records, 1996Q1-1998Q2
Table 3.8: Distribution of two to five matching records, 1996Q1-1998Q2 Table 3.9: Distribution of multiple births in 1997
Table 3.10: Distribution of six and over matching records, 1996Q1-1998Q2
Table 3.11 Distribution of matching records in NHSCR data excluding matching records with Northern Ireland origins
Table 3.12: Identical migrants as a percentage of all migrants excluding matching records with Northern Ireland origins
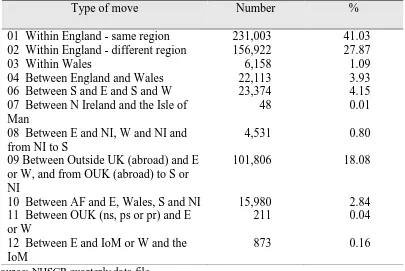
Table 3.13: Identical migrants excluding migrants with alpha characters in any field Table 3.14: Types of move, 1998Q1
Table 3.15: Other categories of move, 1998Q1
Table 3.16: Records with true migration dates, 1996Q1 to 1998Q2
Table 3.17: True quarters of migration for 1998Q1 migrants
Table 3.18: NHSCR inter-regional migration matrix in year ending December, 2005 Table 3.19: Changes between FHSAs (100 zones) and HAs (2001 pre-2002 change)
in England and Wales
viii Table 3.21: Example of quinary age group data
Table 3.22: Sample of migration statistics in Scotland by Council Area, 2005 Table 3.23: Sample of migration statistics in NI by LGD, 2004-05
Table 3.24. NINo registrations in respect of non-UK nationals, by local authority area, 2005-06
Table 3.25: Example of data file of asylum seekers and visitor switchers by destination area and age, 1998
Table 4.1: Broad categories of variable contained in the LFS
Table 4.2: An example of a simple inter-regional flow matrix for counts of individuals derived from the LFS, 2000-01
Table 4.3: An example of an immigration matrix derived from the LFS, 2000-01 Table 4.4: Summary of LFS availability in GB and NI, 1973-2006
Table 4.5: Migration flow data for Northern Ireland, 1998-99
Table 4.6: Observed emigration flows from UK origins to foreign destinations, Quarter 1 in 2005
Table 4.7: An immigration flow matrix derived from the GHS, 2004-05
Table 4.8: A regional flow matrix for all trips carried out by the sample population in
the ‘travel week’, 2004
ix
P
reface
Interaction or flow data involves counts of flows between origin and destination areas
and can be extracted from a range of sources. The Centre for Interaction Data
Estimation and Research (CIDER) maintains a web-based system (WICID) that
allows academic researchers to access and extract migration and commuting flow data
(the so-called Origin-Destination Statistics) from the last three censuses. However,
there are many other sources of interaction data other than the decadal census,
including national administrative or registration procedures and large scale social
surveys. This paper contains an audit of interaction data sets in the UK, providing
detailed description and exemplification in each case and outlining the advantages and
shortcomings of the different types of data where appropriate. The Census
Origin-Destination Statistics have been described elsewhere in detail and only a short
synopsis is provided here together with review of the interaction data that can be
derived from other census products.
The primary aims of the audit are to identify those interaction data sets that exist that
might complement the census origin-destination statistics currently contained in
WICID and to assess their suitability and availability as potential data sets to be held
in an expanded version of WICID. Tables or flow data sets are included for
exemplification. The paper concludes with a series of recommendations as to which of
these data sets should be incorporated into a new information system for interaction
flows that complement the census data and also provide opportunities for new
INTERACTION DATA SETS IN THE UK: AN AUDIT
1 INTRODUCTION
Between August 2001 and July 2006, the Census Interaction Data Service (CIDS)
operated as a ‘Data Support Unit’ under the ESRC/JISC-funded Census Programme
for 2001-2006, with the primary function of allowing registered users to access,
extract and analyse the ‘Origin-Destination Statistics’ collected from successive
population censuses in 1981, 1991 and 2001. These data sets are referred to as the
‘census interaction data sets’ and include the Special Migration Statistics (SMS), Special Workplace Statistics (SWS) and Special Travel Statistics (STS), together with
estimated flow data derived from them. Essentially, they are data sets that contain
flows of migrants or commuters between origins and destinations at various spatial
scales. Registered users wishing to access data from these data sets can do so by
running queries through the Web-based Interface to Census Interaction Data (WICID)
(Stillwell and Duke-Williams, 2003; Stillwell, 2006a, 2006b) and extracting subsets
for independent analysis and visualisation. Additional population-at-risk data have
been included in the system to enable rates of interaction to be computed within
WICID at users’ discretion.
Since August 2006, CIDS has become the Centre for Interaction Data Estimation and
Research (CIDER) supported by ESRC funding under the Census Programme
2006-2011. CIDER aims to provide access to these detailed data sets through to the next
census in 2011 and to redesign the WICID interface so as to further facilitate query
building, extraction and data analysis. This has become increasingly important as the
number of primary and derived data sets and the number of different ‘geographies’
held in WICID have expanded. Whilst it is the case that the census interaction data
sets have been and remain under-used, it has also become evident that there is a need
to ensure that researchers have a good understanding of the data sets contained in
WICID and, in particular, an awareness of both the advantages and shortcomings of
2
At a time when the results of the 2001 Census are becoming more and more outdated,
it also makes sense to complement and enhance our interpretation of the census flow
statistics with interaction data from other sources. This is the raison d’etre for this
paper which reports on an audit that we have conducted of all types of interaction data
that are available on a national basis in the UK. Moreover, having developed WICID
for the specific function of storing and providing users with access to census
interaction data, it is timely to explore the possibilities of adapting the system for
other origin-destination flow data sets that will provide new and beneficial insights
into human interaction behaviour. It would be extremely useful, for example, to bring
data sets into WICID that allow us to identify migration or commuting trends between
censuses or to be able to substantiate the magnitude and pattern of flows derived from
census sources with flows derived from alternative sources, e.g. for students or
immigrants, or even to study less well known population flows not picked up by the
standard Census questions, such as those experienced by patients travelling to receive
treatment.
The paper identifies a range interaction data sources that have the potential to provide
information about the time series context for census data and the trends in interaction
behaviour between censuses or for sub-national population estimation and projection.
Some of these data are currently available online from internet web sites but may
require licensing agreements if they are to be made accessible via WICID; others are
much less accessible, have disclosure controls limitations, and require extensive
derivation or estimation effort if their potential is to be realised; in all cases, the
process of data gathering and assembly requires the establishment of good
collaborative working relationships with the providers as well as detailed data
provision and licensing agreements.
Whilst British population censuses are accepted as providing the most comprehensive
and most reliable interaction data that are available, particularly for small area studies,
several of the potential non-census interaction data sets originate from administrative
sources and involve the collection of records arising from some transaction,
registration or as a record of service delivery. They are collected for administrative
3
Government departments. Jones and Elias (2006) have recently completed a selected
audit of administrative data sets, most of which are used to provide stock information.
These data sources include variables that provide information about either the
migration or the commuting characteristics of NHS patients, school pupils, university
students, workers and those attending hospital. In some cases, registration data have
much simpler structure than census data and are only available at a relatively
aggregate spatial scale but are particularly valuable because they are produced on a
regular temporal basis. In other cases, the information on migration or mobility has to
be generated from the primary unit data using time-consuming data matching and
manipulation algorithms.
Surveys are the third main source of interaction data and, in many cases, surveys such
as the Labour Force Survey (LFS) or the International Passenger Survey (IPS) provide
reasonably detailed data on migration questions but are of limited value because their
sample sizes allow only restricted spatial coverage. The IPS data on immigrants and
emigrants are only published at regional scale and even then, users are advised to
smooth out irregularities in the data by calculating three year averages. However, in
many cases, survey data are particularly valuable because of the cross-classification
possibilities that are available with primary unit data, even though the geographical
dimension may be limited.
The availability of non-census registration and survey interaction data would increase
interest in and use of the WICID system provided by CIDER for academic researchers
and students. Furthermore, this development is in line with ESRC emphasis on a more
integrated National Data Strategy, a plan to ensure that the data resources required to
inform future research issues are in place (Elias, 2006). Under the current ESRC
award, CIDER is aiming to assemble non-census-based data that would be collected
and incorporated into WICID from the beginning of the second year of the Census
Programme (August 2007), commencing with the inclusion of a set of historical
NHSCR data and their respective populations at risk that will be explained later in the
paper. The integration of this NHSCR data set within WICID will necessitate
re-design of the interface and the metadata framework but will provide CIDER with a
4
establish the feasibility of incorporating interaction data from these and other potential
sources during the course of the exercise.
This paper provides a review of the potential sources of interaction data that exist in
the UK together with information about their definitional characteristics, estimation
methods, attributes, limitations and availability. Sections 3 and 4 deal respectively
with different administrative and survey data sources. Section 5 contains our
assessment of the various data sources identified and reported in the paper and makes
a series of recommendations as to which data sets might be most usefully be
incorporated into a future enhanced version of WICID. However, we begin in Section
5
2 CENSUS INTERACTION DATA SOURCES
The Census of Population is an extremely important source of two types of interaction
data: migration flows taking place in the 12 months prior to the census, and flows of
commuters to work (in the UK) and to study (in Scotland). There are various census
products from which interaction data can be extracted: the main census tables; the
Special Migration, Workplace and Travel Statistics; commissioned tables; the
Samples of Anonymised Records; and the Longitudinal Study. These sources are
discussed in turn with particular reference to data available from the latest (2001)
Census.
2.1 Census Tables
The Office of National Statistics (ONS) produces a range of tables of counts based on
the 2001 Census. These include: Key Statistics (KS); Standard Tables (ST); ST
Theme Tables; Census Area Statistics (CAS); CAS Theme Tables; CAS Univariate
Tables; and Armed Forces Tables. The KS tables provide an overview and summary
of the main topics of the 2001 Census in a limited number of simple univariate tables
for output areas (OAs) the smallest geographical units of the 2001 Census.The ST
data sets provide the most detailed information available from the 2001 Census in a
large number of cross-tabulations but only down to ward level in England, Wales and
Northern Ireland, and postcode sector level in Scotland. The CAS data are roughly
equivalent to those covered in the ST data sets but are available at OA scale like the
KS and are less detailed in order to protect the confidentiality of personal information.
Armed Forces tables provide information on members of the Armed Forces and data
are available down to local authority district (LAD) level for England and Wales only.
Certain tables from amongst these contain interaction data, including:
KS24: Migration (All people);
ST008: Resident type by age and sex and migration;
ST009: Age of household reference person (HRP) and number of dependent
children by migration of households;
ST010: Household composition my migration of households;
TT033: Migration (People): All people in the area and those who have moved
6
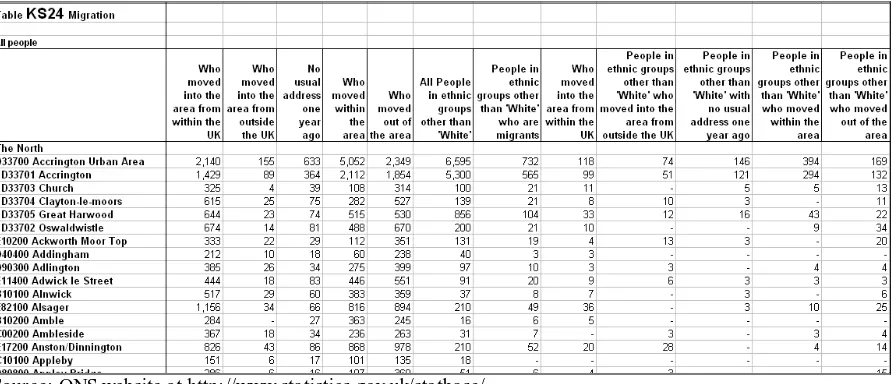
KS24 provides counts of migrants in various categories including those moving into
an ‘area’ from elsewhere in the UK (in-migrants) and from outside the UK
(immigrants), those moving within the area and those moving out of the area
(out-migrants) during the previous 12 months. There is also a category for those recorded
with no usual address one year ago, some of whom may be in-migrants or immigrants.
Table 2.1 presents detail from Table KS24 at district level, showing this classification
and its extension to include those ‘People in ethnic groups other than White’ who
[image:16.595.94.542.292.484.2]move.
Table 2.1. Detail from KS Table 24 at district level
Source: ONS website at http://www.statistics.gov.uk/statbase/
Table ST008, in comparison, contains a spatial breakdown that is similar to that used
in KS24 except that ‘areas’ are distinguished from ‘associated areas’ within the UK.
Counts of migrant flows from individual areas to the aggregate spatial units generated
from the following categories:
Lived at same address
Lived elsewhere one year ago within same area
No usual address one year ago
Inflow
- Lived outside the area but within ‘associated area’ one year ago
- Lived outside the ‘associated area’ but within the UK one year ago
- Lived outside UK one year ago
7
- Moved out of the area but within the ‘associated area’
- Moved outside the ‘associated area’ but within the UK.
Similar categories are used for ST009, ST010 and TT033. The term ‘area’ refers to
the particular area level being shown in the table. So, in the case of an ST or CAS
table for a ward, this will mean the term ‘area’ translates to the name of the ward. In
England and Wales, the ‘associated area’ refers to LAD for tables at ward (electoral
division in Wales); parish (community in Wales) or OA level. For all other
geographical areas the ‘associated area’ is England and Wales. Data can be extracted
online by registered academic users from these tables using the CASWEB service at
http://census.ac.uk/casweb/, although KS Table 24 is not contained within CASWEB
and must be accessed directly from the ONS web site at http://www.statistics.gov.uk.
Data derived from the 2001 Key Statistics and Standard Tables have been used in
analyses of patterns of internal migration by Champion (2005) and of international
migration by Horsfield (2005).
There are no tables that provide interaction data on commuting equivalent to those
above relating to migration other than TT011 which provides flows from each area
(OA) to aggregate areas based on the distance traveled to work (<2km, 2-5km,
5-10km, 10-20km, 20-30km, 30-40km, 40-60km, and 60+km).
It is clear from the preceding discussion that the interaction data contained in the main
census tables only provide a detailed geographical breakdown of either the origin
units or the destination units but not both. In order to obtain flows between local
authorities, wards or output areas, it is necessary to use the Origin-Destination
Statistics.
2.2 Origin-Destination Statistics
As in 1991, two major migration and commuting interaction data sets are available
from the 2001 Census: the Special Migration Statistics (SMS) and the Special
Workplace Statistics (SWS). However, in Scotland, the SWS in 2001 were replaced
with a new set of Special Travel Statistics (STS) that include journeys to place of
study as well as place of work. These data sets are also known collectively as the 2001
8
academic community and data suppliers registered with the Census Registration
Service via WICID (http://cider.census.ac.uk). The 2001 data sets have been reviewed
by Rees et al. (2002) and Cole et al. (2002). More recently, Stillwell et al. (2005)
have explained the structure of the 2001 interaction data sets, documenting the
differences in the data sets between 2001 and 1991 and the problems associated with
making comparisons between 1991 and 2001. Stillwell and Duke-Williams (2007)
have also examined the impact of the small cell adjustment methods (SCAM) used to
adjust flows in 2001 to ensure confidentiality and reduce the risk of disclosure.
A summary of the tables and counts from the 2001 and 1991 Censuses (Table 2.2)
shows a similar number of tables but considerably more counts in 2001 than in 1991.
Data are available in 2001 for three sets of interaction zones: level 1 involves 426
‘districts’ that include local authorities in Great Britain and parliamentary
constituencies in Northern Ireland; level 2 includes 10,608 ‘interaction wards’; and
level 3 contains 223,060 OAs throughout the UK. The STS for Scotland in 2001
contain counts for children aged under 16 and require additional categories in certain
tables. The 1991 SWS data identified in Table 2.2 are the 10% sample of journey
from home to work flows produced only at ward level and referred to as SWS Set C
(Cole et al., 2002).
Table 2.2. Tables and counts in the 2001 and 1991 interaction data sets held in WICID
The data in each of these tables are available from WICID, together with data sets of
flows adjusted for suppression in 1991, inflated for under-enumeration in 1991, or
estimated from 1981 and 1991 data to be consistent with 2001 boundaries. The
modelling methodology that underpins the latter estimation is explained in detail in
Data sets Level 1
(District)
Level 2 (Ward)
Level 3 (OA)
2001 SMS 10 tables (996 counts) 5 tables (96 counts) 1 table (12 counts)
2001 SWS 7 tables (936 counts) 6 tables (354 counts) 1 table (36 counts)
2001 STS 7 tables (1,176 counts) 6 tables (478 counts) 1 table (50 counts)
1991 SMS 11 tables (94 counts) 2 tables (12 counts) Not available
9
Boyle and Feng (2003). One new dimension of measurement in 2001 is the
introduction of moving groups, as well as migrants and migrant households. Moving
groups refer to one or more people moving from the same previous address, for which
there is a moving group reference person (MGRP). A detailed report on migration and
socioeconomic change in Britain’s larger cities, based on data from 2001 SMS Table
MG109 on moving group migration by National Statistics Socioeconomic
Classification (NS-SEC), is available in Champion et al. (2007).
An ONS consultation document looking forward to the 2011 Census of Population
and Housing (ONS, 2005a) indicates that migration and commuting questions similar
to those asked in 1991 will be asked again in 2011 and it is likely that separate
Origin-Destination Statistics will be produced once again. In order to maximise the
success of the 2011 Census, the ONS carried out a test of the procedures to be used in
England and Wales on 13 May 2007 on 100,000 households in five local authorities
(Bath and North East Somerset, Camden, Carmarthenshire, Liverpool and
Stoke-on-Trent). An equivalent test was carried out simultaneously in parts of Northern Ireland
by NISRA whilst a test was carried out by GRO(Scotland) in May 2006. There are a
number of questions on the ONS test questionnaire from which it will be possible to
extract new interaction data. The first of these relates to visitors and simply asks for
usual address, thus providing some indication of where visitors come from by age and
sex. Secondly, there is the question about country of birth that allows a measure of
lifetime migration to be derived but, in addition, there is a question for those born
abroad about when they most recently arrived to live in England and Wales. In
theory, this should enable the creation of matrices of those born overseas by origin
and destination and year of entry. The familiar question relating to place of usual
residence one year ago is asked, but there are also questions asking about other
addresses at which an individual stays for part of the week or year. The second
address is asked for together with information about the reason for staying at the
second address. Reasons are categorised as ‘to stay with another parent/guardian’; ‘to stay when I work away from home’; ‘to stay when not at university/boarding school’; ‘my holiday/second home’; ‘to stay when I’m on duty (armed forces)’; and ‘other’.
There is also a question about how long the individual stays at the second address:
10
questions have the potential to generate a considerable amount of interaction data
relating to temporary mobility.
A major issue relating to 2011 interaction data is what form of adjustment will be
used to the data to preserve confidentiality. It is encouraging to see that the Registrars
General of Scotland, England and Wales and Northern Ireland have agreed to aim for
a common Statistical Disclosure Control (SDC) methodology for 2011 Census
outputs (Office for National Statistics, General Register Office for Scotland, Northern
Ireland Statistics and Research Agency, 2006) based on the principle of protecting
confidentiality set out in the National Statistics Code of Practice. It is considered that
‘attribute disclosure’ (i.e. learning something about an individual) as opposed to
‘identification’ of an individual is the key disclosure risk, because identification reveals no new information to the user. “In order to meet the agreed interpretation of
the Code of Practice, it has thus been agreed that small counts (0s, 1s, and 2s) could
be included in publicly disseminated Census tables provided that a) uncertainty as to
whether the small cell is a true value has been systematically created; and b) creating
that uncertainty does not significantly damage the data” (Office for National
Statistics, General Register Office for Scotland, Northern Ireland Statistics and
Research Agency, 2006, p.1). The exact threshold of uncertainty required has not
been decided. Different levels of disclosure control are applied to outputs from the
Census according to the mode of access. As we have seen from analysis of the 2001
data (Stillwell and Duke-Williams, 2007), Origin-Destination tables at low
geographical levels are amongst those tables likely to be seriously compromised by
SDC and it is interesting to note the view of the Census agencies that these tables
could be released under access arrangements (e.g. licence or safe setting) where
restrictions on access to the data allow less stringent levels of SDC to apply. The
recommended SDC methods for all types of 2011 Census outputs will be published in
Autumn 2008 for consultation and finalised in Spring 2009.
2.3 Commissioned Tables
Customised output from the 2001 Census may be commissioned from ONS Customer
Services when particular cross-tabulations are not available from the standard tables,
11
table has been delivered and paid for by a customer, it is listed on the ONS website
(http://www.statistics.gov.uk/census2001/downloads/com_tab_finder.xls) and is
available to all users free of charge on request from the Census Customer Services.
All commissioned tables for 2001 data are subject to checks to ensure confidentiality.
There is a function on the commissioned tables spreadsheet that allows you to identify
tables of interest by entering the topics of interest. By way of example, Table 2.3 is
the list of commissioned tables produced when ‘origin’ and ‘destination’ appear in the
table titles.
A key question is whether it is useful to incorporate some or all of these tables into
WICID. Given that many of the tables contain data relating to particular parts of the
country (e.g. London, Berkshire, Avon), it seems appropriate to consider including
only those commissioned data sets that have national coverage and which cannot be
built from existing data held in WICID. Examples might include migration flows
between LADs disaggregated by ethnic group and age and sex or international
immigrant flows by ward by country of origin.
Table 2.3: Commissioned tables with ‘origin’ and ‘destination’ in the table title
Source: http://www.statistics.gov.uk/census2001/downloads/com_tab_finder.xls
One specific set of interaction data that ONS have considered producing at a national
level are origin-destination statistics for super output areas (SOAs), both at middle
and lower order levels. However, Keith Spicer, an ONS statistician, has indicated that
12
wards and the SOA hierarchy. ONS have looked that this problem specifically for
Wales and found that there were many instances where it would be possible to
difference and effectively generate OA to area x counts or area x to OA counts and
even OA to OA counts with considerable detail on individual Census respondents.
The position is similar in England and hence it is not possible to supply any of the
origin-destination tables at SOA level where they have previously been released for
wards. Whilst it is possible for CIDER to produce SOA-SOA interactions flows by
aggregation of OA-OA matrices using look-up tables, these will inherit the errors
associated with the application of SCAM at the OA level.
2.4 Samples of Anonymised Records
The Samples of Anonymised Records (SARs) were introduced as a new innovation in
the UK as one of the outputs of the 1991 Census, and offer a considerable degree of
flexibility for multivariate analysis of individuals (Dale, 1998). The SARs comprise a
set of records relating to individuals and (where appropriate) households, with
personal data such as names and addresses removed. Some fields in the records retain
the full original coding, whereas others are recoded in order to prevent disclosure of
information for identifiable individuals. There are a variety of spatial variables in the
SARs, including residential location at the time of the Census, location of address one
year ago for migrants, and country of birth. Some locational variables are simple
aggregates of more detailed base values, for example ‘county’ in the 1991 Individual
SAR, which is aggregated from the more detailed SAR area variable.
In order to generate 'interaction data', any two spatial references can be
cross-tabulated, with possible disaggregation by any other chosen variable(s). In keeping
with the focus of this audit, the commentary on the SARs will concentrate mainly on
migration and commuting aspects of the data, with additional reference to other
potential interaction matrices.
2.4.1 1991 SARs
A total of four SAR files were generated from the 1991 Census; two relating to Great
Britain, and two relating to Northern Ireland. It is possible to coalesce these into a
single UK pair of files by limiting the variables to those that are consistent between
13
individuals in the Census), and a Household SAR, a 1% sample of households. The
Household SAR contains a household record for each sampled household, followed
by a set of individual records for each individual within the sampled household. The
Individual SAR includes limited household level information for each sampled
individual, but does not include detailed information about other persons in the
sampled person's household.
In the case of Great Britain, the SAR records were extracted from the 10% set of
Census records for which all entries on the original Census form had been coded. The
Household SAR was extracted first and the relevant records removed; the records for
the Individual SAR were extracted from the remaining set. Thus, there was no
overlap between the individuals or households contained within either SAR. The
Northern Ireland (NI) SAR files were produced in a similar manner, however there
had been 100% coding of all forms in Northern Ireland, and thus the SARs were
drawn from the entire population. In both cases, the sample excludes fully imputed
households, and more obviously, households missed by the Census.
Separate geographies were used for the primary reporting areas (i.e. the location at the
time of the Census) of the Individual and Household SARs. The individual SAR was
based on LADs, and includes all districts with a population of at least 120,000
persons. LADs with a smaller population than this were amalgamated with
neighbouring LADs. These rules resulted in 278 areas being recognised in Great
Britain, and 10 areas in Northern Ireland. For the household SAR (and for some
broad coded variables in the Individual SAR), the geography consists of 12 zones
based on the statistical Standard Regions of Britain, with the South East being
subdivided into Inner London, Outer London and Rest of South East. Northern
Ireland was recognised as an additional region where appropriate.
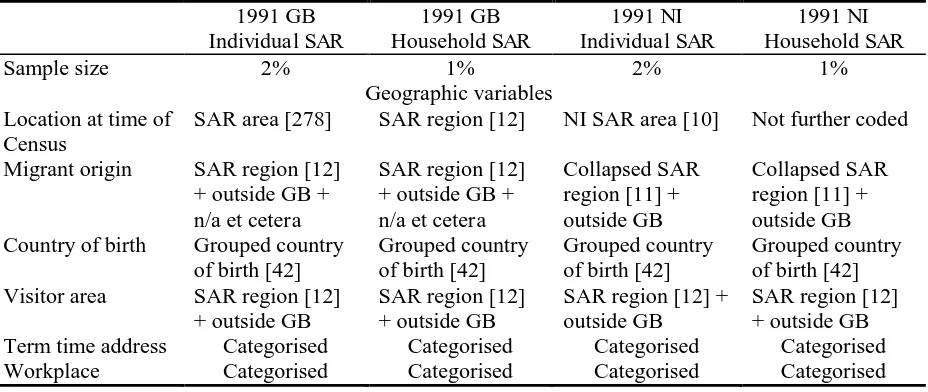
Table 2.4 below summarises the type of geography and number of areas (in square
brackets) for available spatial variables in the SAR data sets. The term ‘Categorised’
in Table 2.4 is used to refer to a potential spatial variable (i.e. a variable for which a
detailed spatial reference was collected on the original Census form) that is not
14
location was collected using the postcode of the place of employment, allowing
detailed data sets such as the Special Workplace Statistics to be generated. However,
in order to reduce the risk of disclosure, this detail is not included in the SAR.
Instead, workplace information is presented as a categorical variable, with classes
including ‘At home/No Fixed Place’, ‘In SAR area’, ‘Outside SAR area, inside GB’,
et cetera. Similarly, term-time address for students has categories such as ‘This
[image:24.595.68.532.272.468.2]address’ and ‘Elsewhere in same region’.
Table 2.4: Type of geography and numbers of areas for spatial variables in the 1991 SAR data sets
1991 GB Individual SAR 1991 GB Household SAR 1991 NI Individual SAR 1991 NI Household SAR
Sample size 2% 1% 2% 1%
Geographic variables Location at time of
Census
SAR area [278] SAR region [12] NI SAR area [10] Not further coded
Migrant origin SAR region [12]
+ outside GB + n/a et cetera
SAR region [12] + outside GB + n/a et cetera
Collapsed SAR region [11] + outside GB
Collapsed SAR region [11] + outside GB
Country of birth Grouped country
of birth [42]
Grouped country of birth [42]
Grouped country of birth [42]
Grouped country of birth [42]
Visitor area SAR region [12]
+ outside GB
SAR region [12] + outside GB
SAR region [12] + outside GB
SAR region [12] + outside GB
Term time address Categorised Categorised Categorised Categorised
Workplace Categorised Categorised Categorised Categorised
Whilst the SAR area geography of the Individual SAR is reasonably detailed, there is
little spatial detail available in other variables. Migrant origin is limited to the
standard region based geography, and workplace location is only available as a
broadly coded categorical variable, or as a broadly coded ‘distance to workplace’
observation. This limits the potential for use of the SAR as interaction data.
Nevertheless, the multivariate flexibility of the SAR means that there is considerable
scope for analysis of the characteristics of migrants and commuters at an aggregate
level. It is possible to generate cross-tabular frequency counts of total migrants by
SAR area destination or total commuters travelling into a SAR area workplace
location that are based on any other Census variables, thus including ones that are not
15
Because of their large sample size and the ability to cross-tabulate variables not
available from the main census tables, the 1991 SARs have been used to identify the
characteristics of migrants. One example of this is the migration of the elderly to join
existing households by Al-Hamad et al. (1997). The 1991 SARs have also been used
to assess the impacts of tenure on long-distance migration compared with
short-distance migration by Boyle (1995), suggesting that long-short-distance migrants are less
likely to move into council housing than other tenures. Unfortunately, the potential for
use of SAR data as interaction data is particularly limited in the Northern Ireland SAR
the migrant origin variable includes an ‘outside GB’ origin class, but there is no
distinction between migrants from Northern Ireland and those from outside the UK.
2.4.2 2001 SARs
The range of SAR files produced was expanded with the 2001 Census, with five files
being produced. The 2001 SAR outputs comprise: the Individual SAR (Licensed), the
Individual Controlled Access Microdata Sample (Individual CAMS), the Special
License Household SAR, the Household Controlled Access Microdata Sample
(Household CAMS) and the Small Area Microdata (SAM). These files have been
generated on a UK basis, with the exception of the Special License Household SAR,
which was produced for England and Wales only. The Household CAMS includes
data for the whole of the UK, in contrast to the Licensed Household SAR. As with the
1991 SARs, there is no overlap between any of the 2001 SAR files.
The two CAMS files offer more detailed versions of the respective licensed files, and
they are made available under more restrictive conditions. These files are only made
available by application and in a safe setting; that is, researchers have to travel to a
secure location (currently, ONS offices at Titchfield, London, Newport and
Southport), and use the data on secure machines in those locations.
As with the 1991 SAR files, there are several potential locational variables which
could be used to generate interaction data. For the Individual CAMS, a much more
detailed residential geography is available than was the case with the 1991 SARs. As
before, it is based on the LAD but with much lower thresholds used for
amalgamation. There are only three cases in which LADs with small populations have
16
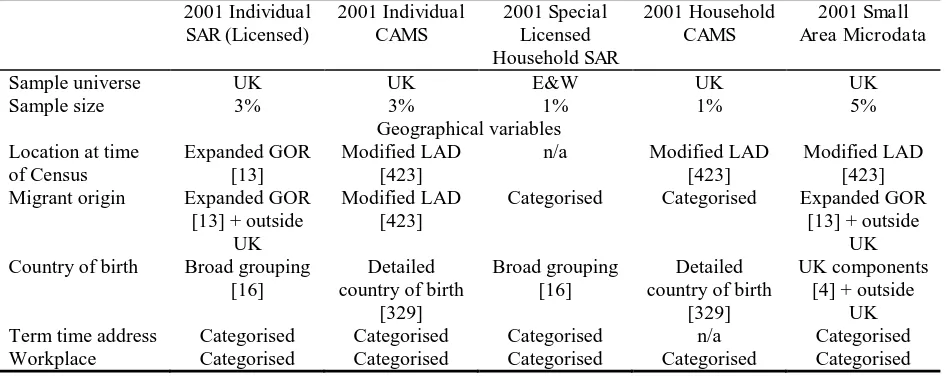
that of the 1991 SARs, being based on an expanded Government Office Region
(GOR) geography. The formal GOR geography refers only to England, and contains
10 regions. The expanded GOR geography used in the 2001 SAR improves on this by
adding Wales, Scotland and Northern Ireland as additional regions, and by splitting
London into two regions, Inner and Outer London. This geography is extended where
appropriate for some variables; for example to include ‘Outside UK’ et cetera for
migrant origins. A summary of the resolution used to report various spatial variables
[image:26.595.63.536.294.482.2]is shown in Table 2.5.
Table 2.5: Type of geography and numbers of areas for spatial variables in the 2001 SAR and CAMS data sets
2001 Individual SAR (Licensed) 2001 Individual CAMS 2001 Special Licensed Household SAR 2001 Household CAMS 2001 Small Area Microdata Sample universe Sample size UK 3% UK 3% E&W 1% UK 1% UK 5% Geographical variables
Location at time of Census
Expanded GOR [13]
Modified LAD [423]
n/a Modified LAD
[423]
Modified LAD [423]
Migrant origin Expanded GOR
[13] + outside UK
Modified LAD [423]
Categorised Categorised Expanded GOR
[13] + outside UK
Country of birth Broad grouping
[16]
Detailed country of birth
[329]
Broad grouping [16]
Detailed country of birth
[329]
UK components [4] + outside
UK
Term time address Categorised Categorised Categorised n/a Categorised
Workplace Categorised Categorised Categorised Categorised Categorised
Whilst the sample size for the Individual SAR has increased from 2% in 1991 to 3%
in 2001, the value for use as interaction data is diminished, due to the reduction in
resolution of the primary geography from 278 regions (in GB) to 13 regions in 2001.
This is disappointing, although the potential for use in aggregate analysis of
characteristics of migrants or commuters remains significant.
The Licensed Household SAR has the same sample size as used for the 1991
Household SAR, but has little or no potential for use as interaction data, due to the
removal of the primary geography (i.e. area of residence at the time of the Census) in
order to reduce the risk of disclosure. At the same time, other spatial variables
including migrant origin have been included only as a categorical variable indicating
17
The two CAMS files have more potential for use in interaction data analysis. The
Individual CAMS has a LAD based geography for both migrant origins and
destinations, thus offering similar spatial detail to 2001 SMS Level 1. The data can be
disaggregated by any chosen variable, although the sample size, coupled with the
generally low incidence of one-year migrants in all Census data (around 12% of
individuals were identified as migrants) will tend to restrict the ability to carry out
multivariate analysis. The household CAMS file has a detailed primary geography,
but only a categorical version of migrant origin. Both CAMS files feature very
detailed versions of the country of birth variable, allowing spatially detailed analysis
of life-time mobility.
The 2001 outputs also saw a new flavour of microdata: the Small Area Microdata
(SAM). This is an individual sample (with the same sample size as the 2001
Individual SAR) which sacrifices attribute detail in order to permit greater spatial
detail. At the same time, the sample size is increased to 5%. For migration analysis,
the SAM has the advantage of a detailed destination geography, although the origins
remain as the expanded GOR geography. Thus, for the study of in-migrants,
considerable detail can be discerned. Crucially, this can be done with multiple
variables; the researcher is not limited to the tables produced as part of the SMS.
However as with all other 2001 SARs and the 1991 SARs workplace address is
provided solely as a ‘movetype’ classification, meaning that the data are not suitable
for use as interaction data.
2.4.3 Summary
The 1991 SARs data, and the licensed versions of the 2001 SARs data are of limited
use for spatially detailed analysis of the data as interaction data. However, they retain
the general advantage of microdata as an opportunity for flexible multivariate
analysis, and thus have potential use for the aggregate study of characteristics of those
involved in spatial interactions (i.e. migrants and commuters). In general, the SARs
are more useful for interaction data use with respect to migrants than to commuters, as
there is no spatial coding of workplace location. The focus on local aspects of
commuting (e.g. whether or not the individual works and lives in the same district)
18
characteristics of long-distance commuters. There are other examples of spatial data
collected in the Census but not included in the SAR. For migrants from overseas, the
country of origin was collected, but this is not used in the SAR data.
The 2001 SAM improves on the spatial resolution used in the licensed versions of the
2001 SAR data. This increases the potential for use as interaction data, although the
coding of migrant origin remains coarse, and there is no spatial disaggregation of
workplace location. The 2001 CAMS files also offer improvements over their
licensed counterparts. In particular, the 2001 Individual CAMS offers considerable
scope for interaction based analysis of migrants. Both origin and destination are coded
at LAD level (with the exception of a very small number of amalgamations), and
country of birth is also available with a detailed coding. The file is available on a UK
basis, and has an increased sample size compared to that of the 1991 Individual SAR.
The main drawback (aside from the access arrangements) is that the sample size is
still too small to allow analysis of migrants using more than a few variables.
2.5 Longitudinal Studies
2.5.1 What are they?
Longitudinal studies are data sources that contain multiple observations of a
population of interest over a period of time. This includes both surveys which are
repeated at intervals for a known set of respondents, and more general instruments
from which a sample is extracted, and externally linked to records for the same
persons from earlier collection rounds. Examples of the former type of longitudinal
study include the UK Cohort Studies, in which a selected sample are surveyed in
multiple sweeps over the course of their life. Examples of the latter type include the
census based Longitudinal Study, which is derived from samples extracted from each
decennial census. Data of these kind provide a valuable resource for many researchers
in a variety of fields. This review concentrates on their potential for use specifically
as a form of interaction data.
2.5.2 Longitudinal Studies in the UK
There are three major longitudinal studies in the UK that are based on census data,
19
registration data. These are: the ONS Longitudinal Study of England and Wales the
Scottish Longitudinal Study, and the Northern Ireland Longitudinal Study. These
differ in a variety of ways including the length of the time period covered, the
sampling fraction used, and the types of other data linked into the study.
The ONS Longitudinal Study of England and Wales (originally known as the OPCS
Longitudinal Study) is the longest established of the three studies. It contains linked
data from 1971, 1981, 1991 and 2001 Censuses. The sample is selected on the basis of
four (undisclosed) birth dates, giving a sample fraction of around 1%. Persons born
on one of these days are extracted from each Census and attempts are made to link
them to established records from earlier Censuses or to administrative records. In
addition to the core sample members, records are also extracted and added to the LS
for other persons in the sample member's household, although these additional
persons are not (unless they also happen to be a sample member) tracked in later
censuses, unless they are still living in a sample member’s household. This study is
generally referred to as ‘the LS’ (that is, the short acronym is used to refer to the LS
of England and Wales, rather than one of the other two). It also contains linked vital
events data and cancer registrations. Access to the LS is facilitated by the Centre for
Longitudinal Study Information and User Support (CeLSIUS)
(http://www.celsius.lshtm.ac.uk/).
The linked LS has enabled researchers to examine changing patterns of settlement and
local geography as well as factors affecting long-term migration. The link between
inter-regional migration and social mobility has been explored by Fielding (1992) to
identify the South East region as an ‘escalator’. The relationships between
counterurbanisation and social mobility have been investigated by Fielding (1998)
and various studies have tracked the spatial distribution of the population in different
parts of the country (Williams, 2000; Davies et al., 2006), migration relating to health
and deprivation (Norman et al., 2005) and the geographical and social dynamics of
ethnic groups (Platt et al., 2005).
The Scottish Longitudinal Study (SLS) has been established by the Longitudinal
Studies Centre – Scotland (LSCS) (http://www.lscs.ac.uk/sls/), currently based in the
20
(GROS) in Edinburgh. The SLS is similar in general terms to the England and Wales
LS, although there are some significant differences. It is a continuous study,
incorporating data from the 1991 and 2001 censuses. It is a 5.5% sample, based on 20
birth dates, rather than a 1% sample, based on four birth dates, as in England and
Wales. The SLS will provide linked information for approximately 274,000
individuals in Scotland. For each individual, the SLS has all the variables that can be
extracted from the complete 1991 and 2001 census forms. Census data includes a
range of information including occupation, economic activity, housing, ethnicity, age,
sex, marital status, health, education and religion as well as place of usual residence
12 months before the census and details relating to the journey to work or study.
Data are also collected for the sample members on vital events. Events currently being
collected include births, stillbirths and infant mortality occurring to sample members
(where the mother and/or the father is an SLS member), widow(er)hoods (where the
SLS member is the surviving spouse), deaths, re-entries after earlier emigrations, and
marriages (where the bride and/or groom is the sample member). In Scotland, health
data are highly confidential and sensitive, so linkage to cancer and hospital
admissions data are not permitted. However, a method of flagging the NHS
Information Statistics Directorate (ISD) data sets with encrypted SLS identifiers has
been devised which will allow the linkage of particular variables for SLS members as
required and Scottish cancer registration data will be linked into the SLS data as
requested for specific approved research studies. In addition, however, it is possible in
Scotland to make the same linkage into hospital admissions information.
The SLS has been designed to be compatible with the England and Wales LS so that
an integrated British LS is a realistic possibility in the future (four of the 20 birth days
match those used in the England and Wales LS). It should be possible for researchers
to select similar datasets from the LS and SLS to allow comparisons to be made
throughout Britain, although care will need to be taken about how migrants between
England and Wales and Scotland are handled.
The Northern Ireland Longitudinal Study (NILS) is the most recently started study,
21
supported by ESRC Census Programme units, the NILS is supported directly by the
Northern Ireland Statistics and Research Agency (NISRA)
(http://www.nisra.gov.uk/nils/). NILS members are selected on a total of 104 birth
dates, giving a much larger sample size than the other two studies of around 28%. The
linked administrative data include birth and death registrations, health service related
migration data, and information about members' households from the Valuations and
Land Agency.
Finally, a UK Household Longitudinal Study (UKLHS) has been funded by the ESRC
and the Office for Science and Innovation (OSI) Large Scale Facilities Programme
and is due to start its first wave of data collection in 2008. The UKLHS will consist of
three components: (i) a wholly new sample of households; (ii) an ethnic minority
boost sample, and (iii) a sample (up to 100%) drawn from the existing BHPS. It will
yield a sample of at least 40,000 households, making it the largest type of study of its
kind in the world. The BHPS will be integrated into the UKLHS at wave 2
(2009-2010) and the Longitudinal Study of Ethnic Minorities (LSEM) will also be
incorporated into the UKHLS.
2.5.3 Cohort Studies in the UK
There are four significant birth cohort studies in the UK as follows:
the MRC National Survey of Health and Development (NSHD) (the British
1946 birth cohort study);
the National Child Development Study (NCDS) (the 1958 birth cohort study,
originally known as the Perinatal Mortality Survey);
the 1970 British Cohort Study (BCS1970); and
the Millennium Cohort Study (cohort born in 2000/2001).
The NSHD is currently maintained in the Department of Epidemiology and Public
Health at University College London, the later three studies are maintained by the
Centre for Longitudinal Studies at the Institute of Education. Data for the latter three
studies ares available via the Economic and Social Data Service (ESDS)
22
Whereas the longitudinal studies are based around linked census data, which contain –
in general – the same questions each time; the birth cohort surveys use different
questionnaires in each sweep. These tend to contain core questions that are asked at
each sweep, plus additional questions that reflect changing interests and research
priorities. Clearly, the questions that are asked to (the parents of) young children in
the earliest waves of any birth cohort study will be very different to those asked as the
survey members grow to adulthood and subsequently into retirement. Whilst adult
members of the earlier cohort studies have been asked numerous questions in each
wave about employment and occupation related issues, it would appear from
examination of the available data that specific questions about the location of
members' workplaces have not been regularly asked. Thus, the potential for use as
journey-to-work interaction data is very limited. In contrast, the very nature of the
studies, which track individuals over time, means that a near complete record of
residential history is maintained, giving rise to very rich migration based interaction
data. However, as discussed below, the potential for such use in practice is limited.
Other significant cohort studies, not based directly on birth cohorts include the British
Household Panel Survey (BHPS); the English Longitudinal Study of Ageing (ELSA);
and the Longitudinal Study of Young People in England (LSYPE).
The BHPS is a sample of all adult members of households in the UK. In the first
survey in 1991, just over 5,000 households were selected. Membership of the survey
is a characteristic of individuals in households, and thus when survey members move
into a new household, all adult members of the new household are added to the
sample; the survey now covers some 10,000 households. Surveys are conducted
annually, with core questions including those relating to household composition,
residential mobility, education, health and occupation. In addition, a varying set of
additional questions are asked, based on emerging policy and research priorities.
Access to the BHPS is supported by ESDS and the ESRC United Kingdom
Longitudinal Studies Centre (http://www.iser.essex.ac.uk/ulsc/bhps/).
23
England (HSE). The initial sample (surveyed in 2002) was of around 12,000 persons
aged 50 or over, together with their partners. Being based on the HSE, the survey
contains health data (including basic physiological measurements and blood samples
analyses) as well as the basic demographic data common to the other surveys
discussed in this section. There have been two additional surveys since the first one.
The LSYPE is the newest of these cohort studies. Sample members are young people
who were in Year 9 (or equivalent) in schools in England in February 2004 (born
between 1 September 1989 and 31 August 1990) and their parents or carers.
Interviews are conducted annually. The initial sample featured young people and
adults in over 15,000 households. The data have been linked to a number of
administrative data sets including the Pupil Level Annual Schools Census (PLASC),
although these linked versions are not available for direct use. The questions asked
include a full history of schools attended, potentially allowing interaction data of the
journey-to-school type to be derived.
2.5.4 Potential for use as interaction data
Both the cohort studies and the longitudinal studies have considerable potential scope
for research into spatial mobility. As indicated above, the LS has been used already to
study migration. Indeed, given that migration is an event that takes place (for most
people) on a relatively infrequent basis, these types of study are far better at capturing
an effective picture of mobility during the lifecourse than a series of discrete
snapshots (i.e. the censuses considered in isolation). However, this high potential is
also paradoxically something of a constraint on the data sources. The amount of data
held means that these sources have the potential to be highly disclosive of the sample
members. For this reason, access to the data is generally strongly controlled. Where
relatively free access is allowed (data from the many of the cohort studies can be
downloaded by academics having agreed to usage conditions), the level of detail that
is used for ‘spatial’ fields tends to be very limited. Where any information is given
about place of residence, it tends to be no more detailed that Government Office
region. Furthermore, little or no data is released about the previous residential
address, except whether or not it was in the UK. In contrast, data are included in a
24
The longitudinal studies, being census based contain – potentially – the full census
data on previous residences and on workplace location. However, due to disclosure
control reasons, it is unlikely that data will be released that contains a detailed spatial
coding. Access to the LS data sets is mediated through experts who advise on requests
and who are also responsible for vetting output. For any output to be released it must