Thesis by
Cahit Can Aydıner
In Partial Fulfillment of the Requirements
for the Degree of
Doctor of Philosophy
California Institute of Technology
Pasadena, California
2004
c
2004
Cahit Can Aydıner
Acknowledgements
The last five years at this leading science institute have challenged me in many different
ways, from the intense load of heavily theoretical classes to experiments that seemed like
they will never work. I could survive through all with dearly bought gifts of adapted (‘built’)
character and developed intellect. This could not be possible without the support of many
people, and I’ll try to express my gratitude to them, although it will be impossible to name
all of them here.
I would like to thank my advisor, Prof. ¨Ust¨unda˘g, for giving me the opportunity to work
on this project. I appreciate his advice and guidance especially during the period that I was
trying to become some sort of an experimentalist. Also, he put conscious effort to make
his group members meet facets of academic life outside Caltech. So, I’d like to thank him
for my national laboratory and conference experiences that broadened my scientific vision
and allowed me to meet many good researchers/people. I also owe my appreciation to Prof.
Hall for his advice in the always-difficult first year at Caltech. I would like to thank Prof.
Knauss, Prof. Ravichandran and Prof. Johnson for graciously agreeing to be members of
my thesis committee.
I’m grateful to everyone from whom I received various forms of help in this scientific
investigation. In this respect, special thanks are to Dr. Michal B. Prime of Los Alamos
and experience on the residual stress measurement technique used in this study. At the very
first time I tried this method, I felt quite surprised when I saw the experiment was working,
rather than joyful (which caught up later), probably due to the long period of frustration
with other methods during which my subconscious was convinced that experiments, quite
simply, do not really do so. Every experimentalist, although what he has to do is to develop
a solid, hard-to-discourage character, needs a moment of success once in a while. I’d like
to thank Dr. Prime for my first such moment. Also, I’d like to gratefully acknowledge
Dr. Atakan Peker of Liquidmetal Technologies who helped me many times with sample
production.
To name all the friends that helped me through these years (and it is in help category
even when your friend shares your moment at Red Door Cafe to relax your research-loaded
nerves) is impossible and will always result in an incomplete list. Hence, to represent my
thanks to them all, I choose my oldest friends (room mates) here: Burak Erdo˘gan and
Arkadas. ¨Ozakın. Also, the support of these extremely bright individuals in my first year
struggle with Caltech classes is sincerely appreciated. They really made me think again
when I thought I was an analytical thinker.
And on a larger timescale, I’d like to thank my mother, T¨urkan Aydıner, who cared so
deeply for my education at every stage of my life. Without her guidance, which always felt
like coming from an encouraging friend, I could never be as successful. I’d like to thank my
father, G¨okhan Aydıner, for setting an incredible example of work ethic. I become more
Abstract
Bulk metallic glasses are recent advanced materials which generate residual stresses due to
rapid cooling from their surfaces during processing. These stresses arise from the thermal
gradients that form within the sample at and above the glass transition region. A typical
processing of BMGs involves feeding the alloy melt into a mold followed by severe quenching.
The formation and nature of these stresses are analogous to the residual stresses due to the
thermal tempering of silicate glasses. This analytical-experimental study investigates the
thermal tempering phenomenon in BMGs for the first time.
One of the best glass forming metallic alloys, Zr41.2T i13.8Cu12.5N i10Be22.5 (Vitreloy
1TM), is employed in this study. First, the best technique for the high-resolution
mea-surement of residual stresses in BMGs is determined to be the crack compliance method.
Second, the formation of the stresses is modeled with three different levels of viscoelastic
phenomenology, namely, an instant freezing model, a viscoelastic model and a structural
model. The first is a simplistic analytical model to estimate residual stresses whereas the
structural model accounts for the temperature history dependence of the glassy structure.
The constitutive laws for the viscoelastic and structural models are incorporated into the
finite element method (ABAQUSTM software package) allowing the application of these
models to complex geometries. To increase the accuracy of the analysis, the ‘correct’
models. Therefore, the heat transfer problem during the casting process of the BMG is
analyzed in detail. Accuracy also requires a detailed knowledge of the thermal parameters
of the material as a function of temperature; thus, some attention is also devoted to their
measurement.
At the end, calculated and measured stresses are compared and good agreement is
achieved. BMGs are demonstrated to be capable of generating very high (around 400 MPa)
compression on their surfaces. The study also yielded valuable physical insight into the
thermal tempering process itself. It is seen that this process exhibits significant discrepancies
in BMGs compared to its analogy in silicate glasses. For instance, the transient tensile
stresses that develop in the latter are shown to be lacking in the BMGs. Another discrepancy
between the two materials is that the density of BMGs is uniform across the sample cross
section in contrast to that found in silicate glasses. Overall, this investigation developed
sufficient understanding of the thermal tempering phenomenon in BMGs to establish it as
Contents
Acknowledgements iii
Abstract v
Table of Contents x
List of Figures xix
List of Tables xx
1 Introduction 1
1.1 Motivation . . . 1
1.2 Formation of Thermal Tempering Stresses . . . 4
1.3 Structure of the Problem and Organization of the Thesis . . . 8
2 Background 12 2.1 Linear Viscoelasticity Preliminaries . . . 13
2.2 Basic Linear Thermoviscoelasticity . . . 17
2.3 Thermoviscoelastic Theory of Silicate Glass Tempering . . . 20
2.4 Temperature History Dependence of Structure . . . 23
2.5 Structural Theory of Tempering . . . 30
2.7 The Matsuoka Model for the Nonequilibrium State . . . 33
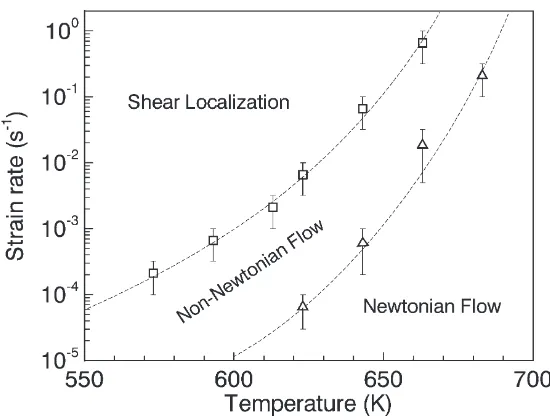
2.8 Shear Thinning of Vitreloy 1 . . . 34
3 Modeling and Measurement of Residual Stresses in a Bulk Metallic Glass Plate 37 3.1 Introduction . . . 37
3.2 Specimen Preparation . . . 38
3.3 Modeling of Thermal Tempering . . . 39
3.3.1 Instant Freezing Model . . . 39
3.3.2 Viscoelastic Model . . . 45
3.3.2.1 Introduction . . . 45
3.3.2.2 Viscoelastic Model for Bulk Metallic Glass . . . 46
3.3.2.3 Implementation of the Viscoelastic Model . . . 50
3.3.3 ‘Perfect’ Contact Analysis of the Copper Mold Casting . . . 51
3.4 Residual Stress Measurement Using the Crack Compliance Method . . . 54
3.5 Experimental Results . . . 59
3.6 Discussion . . . 63
3.7 Conclusion . . . 65
4 Residual Stresses in a Bulk Metallic Glass Cylinder Induced by Thermal Tempering 67 4.1 Introduction . . . 67
4.2 Experimental Procedure . . . 68
4.2.1 Sample Preparation . . . 68
4.2.3 Residual Stress Measurement via the Crack Compliance Method . . 75
4.3 Results and Analysis . . . 77
4.3.1 Residual Stresses due to Thermal Tempering . . . 77
4.3.2 Viscoelastic Model of Thermal Tempering . . . 80
4.4 Conclusions . . . 85
5 Physical Aging of Vitreloy 1 and the Structural Model of Thermal Tem-pering 87 5.1 Introduction . . . 87
5.2 Matsuoka Model . . . 89
5.3 Volumetric Physical Aging Experiments for Vitreloy 1 . . . 92
5.3.1 Introduction . . . 92
5.3.2 Specimen Preparation . . . 94
5.3.3 Experimental Results and Discussion . . . 97
5.4 Stress Analysis . . . 100
5.4.1 Introduction . . . 100
5.4.2 Finite Element Implementation with ABAQUSTM Software . . . 101
5.4.3 Results . . . 101
6 Conclusions and Future Work 104 A Material properties of Zr41.2T i13.8Cu12.5N i10Be22.5 109 A.1 Thermal Properties . . . 109
A.1.1 Specific Heat (Cp) . . . 111
A.1.2 Density (ρ) . . . 112
A.2 Mechanical Properties . . . 118
B Residual Stresses in a Bulk Metallic Glass-Stainless Steel Composite 120 B.1 Introduction . . . 120
B.2 Experimental . . . 121
B.3 Modeling . . . 123
B.4 Results . . . 125
C ABAQUS Subroutines for Structural Model 130
List of Figures
1.1 Typical residual stress state in an infinite glass plate subjected to thermal
tempering. Stresses are equibiaxial varying only in the out-of-plane direction
(x). This stress profile is roughly parabolic with surface compression balanced
by tension in the interior. . . 2
1.2 Temperature profiles (top) and stress states (bottom) in the three stages of
thermal tempering: (i) The temperatures are sufficiently above glass transition
Tg and stresses are zero although thermal gradients exist. (ii) Solidification
stage; part of the cross section became capable of holding stresses and
relax-ation times decrease from the (cold) surface to the (hot) mid-plane. The shown
stress state is for still-growing thermal gradients that results in tension at the
surface. At this particular instant, a region about the mid-plane is still ‘liquid’
and does not hold stress. (iii) Temperature equalization stage; begins with the
solidification of entire cross section at time ts. In this stage, the temperature
profile T(x, ts) decays to uniform Ta. The shown stresses are temperature
equalization stresses, namely, the thermoelastic stresses generated during this
1.3 Structure of the thermal tempering problem: The heat transfer problem is
uncoupled from the mechanical problem due to the dominance of forced cooling
over heat generation by viscous mechanisms. Hence, it is solved first with
the inputs of the boundary condition (e.g., that imposed by the heat transfer
coefficient,h), the initial conditions (e.g., initial temperature,Ti), and material
parameters in the heat equation. The obtained temperature solution T(x, t) is
then fed to the mechanical problem which is solved with a constitutive model
(instant freezing, thermoviscoelastic, etc.), the material properties required by
the chosen model and the mechanical boundary conditions. The stress history
(σ(x, t)), and in particular, residual stresses are solved for comparison with the experimental data. . . 8
2.1 (a) Step disturbance in shear strain at t = 0. (b) Shear relaxation modulus
G(t): stress response normalized by the magnitude of the step in strain. (c) Continuous relaxation spectrum Γ(τ), line spectrum; the set of all (gi, τi). . . 16
2.2 (a) Demonstration of thermorheological simplicity (time-temperature
super-position) for shear relaxation modulusGT(t) whereT is the constant temper-ature of the measurement (here T1 > T2 > T3 ). (b) Representation of GT(t)
with the reference (master) curve Gr measured at temperature Tr where ξ is the reduced time. . . 18
2.4 (a) Specific volume (v) vs. temperature (T) curves traced by a glassy material
for cooling rates T.1 and
.
T2,
.
T2 >
.
T1. The crystal curve (dashed) is also
provided for reference. The glass transition region is indicated for theT.1 case
between supercooled liquid and glassy regions. (b) Zoom of the glass transition
region for the T.1 case. . . 25
2.5 (a) Upward and downward temperature jump experiments to a target
tem-perature T on the v−T plot; instantaneous response with the glassy slope and following time-dependent relaxation to the equilibrium volume for
down-ward (path 1) and upward (path2) jumps. (b) Structural relaxation function
MVT,∆T(t) for downward(1) and upward(2) jumps. . . 27 2.6 Effect of strain rate on the uniaxial stress-strain behavior of Vit.1 at
temper-ature T = 643 K. The stress-strain curves have been shifted to the right to
avoid overlapping curves of similar shapes and sizes (reproduced from Lu et
al. [54]). . . 35
2.7 The boundaries between the three distinct modes of deformation for Vit.1.
Two boundaries are shown, one for transition from homogeneous
deforma-tion to inhomogeneous deformadeforma-tion and the other from Newtonian to
non-Newtonian flow (reproduced from Lu et al. [54]). . . 36
3.1 A typical residual stress profile across the thickness of a large plate due to
thermal tempering: surface compression (σs) is balanced with mid-plane
ten-sion (σm). The in-plane stresses are equibiaxial and function of the thickness
coordinate (Z) only. . . 40
3.2 Effect of the Biot number on the absolute values of surface compression and
3.3 Residual stress profiles across the half-thickness of a Vit.1 plate as a function
of the Biot number, Bi= h L/k. According to the model predictions, about
35% of plate thickness will be in compression. . . 44
3.4 Temperature profiles at selected mid-plane temperatures (350, 400, 450, 500◦C)
for the temperature evolution during the quench of a Vit.1 plate. Calculations
are carried out (i) with the actual temperature-dependent thermal parameters
(Appendix A) including thermal conductivity, k(T) (straight lines) (ii) with
the simplification that k = k(Tg) = 9.98 W/(m·K) (dashed lines). (Process parameters for these runs are Ti = 900◦C, Ta = 25◦C, h = 4800 W/(m2·K),
L= 4.125 mm, yielding ˜Bi'2.) . . . 45 3.5 Absolute values of surface and mid-plane stresses predicted by both instant
freezing (IFM) and viscoelastic-VFT models of thermal tempering of an 8.25 mm
thick Vit.1 plate as a function of (convection) heat transfer coefficient. The
VFT data are shown for two different calculations using βs = 0.5 and 1 in
equation (3.6). . . 49
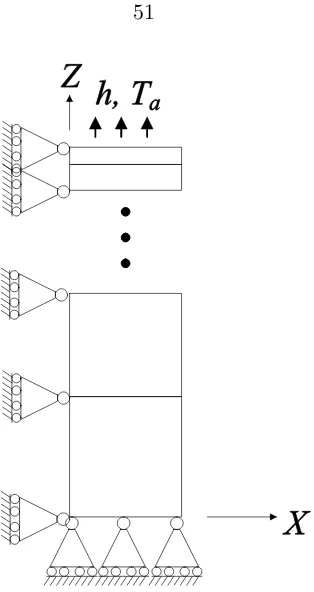
3.6 Schematic of the finite element model used in viscoelastic model calculations.
An infinite plate is represented via symmetric elements (in X and Y) while
the plate half-thickness extends alongZ. The elements (or nodes) on the right
hand side are required to move uniformly along the X direction. . . 51
3.7 (a) Temperature profiles at selected times in the cross section of the cast Vit.1
(initially at 900◦C) and the copper mold (initially at 25◦C) that are put in
instantaneous contact and do not separate (‘perfect’ contact) throughout the
process. (b) The residual stresses induced in Vit.1 by this temperature solution. 52
3.9 Locations of samples in the plate before cutting. Plate dimensions are 150 mm
by 100 mm by 8.25 mm. Wire diameters used in cutting each sample are
indicated in inches. The flow direction of the molten BMG during casting is
also shown. The samples are 12.7 mm by 25.4 mm. The ones designated by
X were used to determine in-plane stresses along the X direction (σX), while
those named Y1, etc., were used to measure σY. . . 58
3.10 Back strain vs. normalized depth data for samples (a) in the Y direction,
and (b) in the X direction, in comparison to the annealed sample A1. See
Figure 3.9 for original specimen locations on the plate. . . 60
3.11 (a) Calculated stress profile vs. normalized depth reduced from the back gauge
strain data only. (b) The stress profile obtained from both top and back gauges. 62
4.1 Geometry of the BMG alloy cast in a stainless steel (SS) tube. The actual
sample location used in crack compliance measurements is shown between
dashed lines. All dimensions are in mm. . . 69
4.2 Center temperature of the stainless steel rod used in heat transfer analysis as
a function of quenching time. (a) Experimental data in comparison to
simu-lations forh= 6,000 to 20,000 W/(m2·K) in increments of 2000 W/(m2·K). (b) The fit of theh= 10,500 W/(m2·K) simulation to the experimental data, which yields the best fit after the time offset optimization as detailed in the
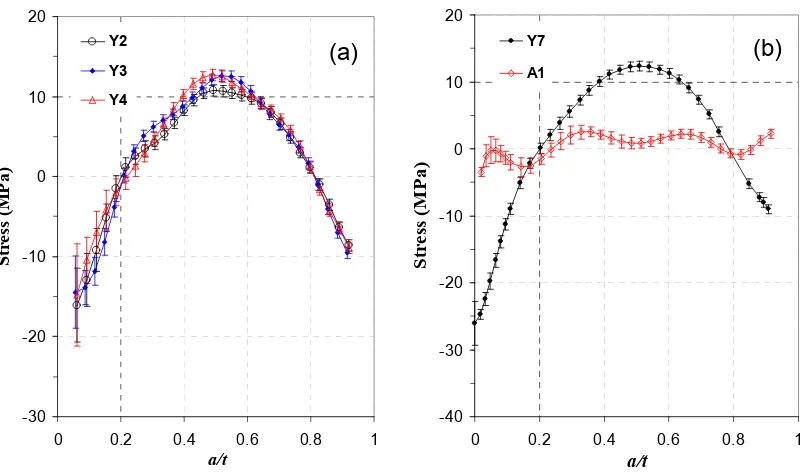
4.3 Geometry of the stress measurement and analysis. (a) The nomenclature of
the crack compliance method applied to a long cylinder. Strain gauges are
placed on the circumference of plane M at the mid-length of the rod where the plane strain condition is satisfied. (b) The two-dimensional finite element
mesh on plane M for a certain slot depth, a. The nodes that are on the top and back strain gauge locations are defined as node sets. The initial (c) and
deformed (d) configurations of the back gauge node set are magnified. The
initial gauge length is given by l0 = su1+su2+su3 and the deformed gauge
length is l=sd1+sd2+sd3. . . 78
4.4 Measured hoop stress in the BMG cylinder as a function of normalized cut
depth (x/D). Data obtained from (i) top gauge only, (ii) bottom gauge only,
and (iii) both gauges combined are shown. All three analyses yield nearly
iden-tical results. The error bars represent the fitting errors in the crack compliance
analysis. . . 79
4.5 Absolute values of calculated surface compression and mid-plane tension in
BMG (after the removal of the steel tube) plotted against the heat transfer
coefficient, h, for all three cases of stainless steel during quenching: elastic,
elastic-perfectly plastic and mechanically inert insulation. The experimental
heat transfer coefficient value (= 10,500 W/(m2·K)) is noted. . . . 83
5.1 (a)Prediction of the formulation based on the Matsuoka model when the
ma-terial is cooled from 800 to 500 K at the rates of 1, 10, 100, and 1000 K/s in
terms of (a) specific volume normalized by its equilibrium value at 800 K, and
5.2 A photograph of a sample positioned in the TMA sample chamber. The probe
is connected to a 0.1 micrometer sensitive LVDT. The furnace slides over the
sample tube and the chamber is flushed by Helium. The instrument
couple facilitates temperature control whereas an additional (sample)
thermo-couple probe touches the sample for a direct measurement. . . 93
5.3 (a) Cross section of the designed SS mold that has three rectangular chambers.
The middle chamber is filled with Vit.1 melt whereas the chambers on both
sides remain empty. The thermocouple (TC) probe that is fed through the
vacuum resides approximately in the corner of the cast BMG section. The
thickness, width and length (dimensions in x, y, z directions, respectively) of
this section are 12.7, 19, 127 mm, respectively. The slab that has been cut
out for TMA measurements is shown with bold lines. (b) The 2-D geometry
of the finite element heat transfer analysis of the quench. The convective heat
transfer occurs from the free surfaces, shown in the figure with arrows and
the heat transfer coefficient, h. The temperature history of the TC probe is
obtained from FE analysis as the average response of the elements that reside
in the cross section of the TC (TC probe elements). Similarly, the thermal
history of the slab is averaged from the slab elements. . . 95
5.4 (a) Temperature vs. time data from the thermocouple. (b) Back-calculated
5.5 (a) The entire temperature history (temperature T vs. time t) of the
sam-ple that is composed of three stages: (1) the cooling during the casting, (2)
50 K/min ramp in the TMA, and (3) isothermal hold in the TMA (for this
example) at 567 K. (b) Output of the Matsuoka model for this temperature
history in terms of normalized sample length (l/l(0)) plotted vs. temperature.
The three stages of temperature history are indicated on the figure with arrows. 98
5.6 Length of the physically aged sample (l) normalized by its length at the
be-ginning of the isothermal hold l(0) plotted vs. time (t) at hold temperatures
of 531, 548, 567, 589 K. Both the experimental data (noisy curves) and the
calculations with the Matsuoka model (smooth curves) are presented with the
same color for each temperature. . . 99
5.7 (a) Cooling rate and (b) temperature plotted vs. time at the mid-plane and
surface points of a Vit.1 plate cooled with ˜Bi = 2. The arrows in the first
figure indicate the approximate moments when temperature drops to the glass
transition range. . . 102
5.8 Transient stresses calculated by the structural model at selected times in the
solidification stage. . . 103
A.1 (a)Thermal diffusivity, κ, data from experiments with the flash method, (b)
Thermal conductivity, k, that is calculated as k=κ ρ Cp, the solid line is the
fit detailed in the text. For both plots filled markers are for amorphous data
points whereas empty markers of the same kind imply that the sample has
B.1 Model specimen made of a type-314 stainless steel tube (19.0 mm outer diam.,
15.6 mm inner diam.) and a middle pin (3.2 mm diam.) with a Vit.1 BMG
cast in between. The specimen height is about 50 mm. . . 122
B.2 Schematic of the 2XD neutron diffractometer at the Missouri University
Re-search Reactor Center. The sampling (or gauge) volume is defined by slits in
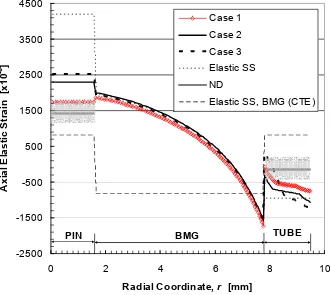
the incident and diffracted beams to be about 1×1×8 mm3. . . 123 B.3 Axial elastic strains measured by neutron diffraction (ND) and calculated
for different constitutive behaviors of stainless steel (SS) and BMG: Case 1:
(σY)SS = 205 MPa, BMG viscoelastic; Case 2: (σY)SS = 310 MPa, BMG
viscoelastic; Case 3: (σY)SS = 358 MPa at room temperature and drops at
higher temperatures (Table B.1), BMG viscoelastic; ‘Elastic SS’: SS linear
elastic, BMG viscoelastic; ‘Elastic SS, BMG (CTE)’: both phases are linear
elastic, no thermal gradients allowed (CTE mismatch is the only residual stress
source). The shaded areas represent the error bars for the ND data (330µ). 126
B.4 Axial stresses predicted by the FE model for various constitutive behaviors of
List of Tables
3.1 Processing parameters and thermophysical properties of Vit.1 reproduced from
Appendix A. . . 42
3.2 Thermophysical properties of pure copper [41]. . . 54
4.1 Thermophysical properties of stainless steel (AISI 304L) employed in the present
study. . . 75
A.1 Specific heat of Zr41.2T i13.8Cu12.5N i10Be22.5 in the glassy region. . . 111
A.2 Specific heat of Zr41.2T i13.8Cu12.5N i10Be22.5 in the supercooled liquid and
liquid regions. . . 112
A.3 Density of Zr41.2T i13.8Cu12.5N i10Be22.5 as a function of temperature. . . 113
A.4 Thermal conductivity of Zr41.2T i13.8Cu12.5N i10Be22.5 as a function of
tem-perature. . . 118
A.5 Mechanical properties for Zr41.2T i13.8Cu12.5N i10Be22.5. . . 119
B.1 Temperature-dependent plastic behavior of AISI 314 stainless steel for three
cases considered. σY: Yield strength, σT,T ensile: true stress at the ultimate
tensile strength, andT,p: the corresponding plastic component of true strain.
The reference for Case 1 and Case 2 is Metals Handbook [4] whereas the data
Chapter 1
Introduction
1.1
Motivation
Although metallic glasses have been made since 1960s, specimen dimensions were previously
limited to tens ofµm due to the very fast cooling rates (about 106 to 1012 K/s) needed in
order to prevent crystallization. Recently, multicomponent alloys have been developed with
exceptional glass formation ability that allow the processing of bulk specimens (Peker [67]).
These alloys form glass at critical cooling rates low enough to allow the casting of specimens
up to 5 cm in diameter. The ability to prepare large specimens has permitted the bulk
char-acterization of these materials using moretraditional techniques. The unique properties of bulk metallic glasses (BMGs) place them among significant engineering materials: very high
strength (1.9 GPa), good fracture toughness (20–55 MPa·m1/2), a high specific strength, excellent wear and corrosion resistance, and a high elastic strain limit (up to 2 %) (see, e.g.,
Gilbert et al. [35] and Bruck et al. [17]).
One important question that arises with bulk production is the nature and magnitude
of processing induced residual stresses, since, as with all materials, these stresses can
af-fect the mechanical behavior of BMGs significantly. Typical processing of BMGs includes
x
y
z
+
-
s
ys
z+
-Figure 1.1: Typical residual stress state in an infinite glass plate subjected to thermal tempering. Stresses are equibiaxial varying only in the out-of-plane direction (x). This stress profile is roughly parabolic with surface compression balanced by tension in the interior.
undergoes glass transition and remains amorphous. Observing the fairly low thermal
con-ductivity of these alloys (∼10 W/(m·K) at glass transition), rapid cooling from the surface would form significant thermal gradients in these ‘thick’ samples, i.e., a surface point will
cool considerably faster than a point at the core. Thermal gradients that form above and
during the glass transition were observed to generate residual stresses in the more
tradi-tional amorphous materials (see, e.g., Gardon [34] for silicate glasses and Struik [82] for
polymers). These residual stresses had a typical compression on the surface balanced by
tension in the interior, and they were the subject of an intense research activity, in
particu-lar, for silicate glasses. The motivation there was that the bending strength of silicate glass
plates could be significantly improved with the residual stresses of this nature (as much as
three times their regular strength). Therefore, inducing residual stresses by heating above
glass transition and subsequent rapid quenching has become an industrial process. The
pro-cess/phenomenon is known as ‘thermal tempering’ (Gardon [34]) and the typical residual
The hypothesis of the present study is that residual stresses with the same mechanism
could also be formed in metallic glass samples. Therefore, the name ‘thermal tempering’ is
inherited. The study involves the following topics and challenges:
1. Investigation of relevant material properties and constitutive behavior
Thermal tempering is a thermomechanical problem that is extremely material data
intensive. Furthermore, the temperature span of the process in BMGs (up to 1000 K),
and therefore the temperature span over which material data are required, is several
times that of the silicate glasses. Also, investigation of these properties between glass
transition and liquidus temperature is inhibited by phase separation and
crystalliza-tion in BMGs.
2. Controlling and monitoring of the processing conditions
BMGs need to be cast from their melt under a controlled atmosphere (inert gas flush
or vacuum), since oxygen is utterly detrimental to glass formation. This requirement
and the high temperature of the melt (∼900◦C) pose a difficult problem to monitor the process.
3. Modeling of residual stresses with the input of items 1 and 2
This involves determination of models that comprise sufficient physics to predict the
residual stresses successfully.
4. Measurement of residual stresses
BMGs, as opaque and amorphous materials, preclude the use of typical non-destructive
methods of photoelasticity or X-ray diffraction. Also, the problem requires not an
high-resolution measurement of the residual stress profile through the thickness for
mean-ingful comparison with model results. This know-how did not exist in the literature,
hence, adapting a ‘powerful’ residual stress measurement method to these materials
is an important goal of this study.
1.2
Formation of Thermal Tempering Stresses
In silicate glass tempering, the thermal tempering process involves (i) cooling a glass plate
above its glass transition temperature (Tg) by ∼ 50−100 K where it is still viscous enough to retain its shape and then (ii) rapidly cooling it from both sides, typically by air quenching.
During this process, first, temperature gradients form in the sample that is initially at a
uniform temperature,Ti, i.e., surface cools faster than the mid-plane. Then, these gradients
grow and reach a maximum, realized by the maximum differential between the mid-plane
and surface temperatures. After this point, the gradients decay and the sample temperature
eventually settles to the ambient temperature,Ta .
In an always-elastic plate, stress generation in a time incrementdtdue to anx-symmetric
temperature increment dT(x, t) across the thickness is given by the simple thermoelastic
formula (e.g., Timoshenko and Goodier [85], p. 433)
dσ= E α
1−ν(dT(x, t)−dT¯(t)) (1.1)
where E is the Young’s modulus, ν is the Poisson’s ratio, α is the coefficient of thermal
expansion, dT¯ is the temperature increment averaged over x. Integrating this equation,
it is easy to see that no residual stresses are generated due to cooling from the uniform
of temperature gradients are nullified by the equal-in-magnitude but opposite stresses that
form as the gradients decay.
On the other hand, stress evolution in thermal tempering is different due to three stages
of material behavior demonstrated in Figure 1.2. In this figure, the temperature profile
is pictured at the top in reference to Ti, Tg and Ta, whereas corresponding stress state is
shown at the bottom.
In the first stage, the temperatures in the entire cross section are sufficiently above glass
transition such that stresses formed by imposed thermal gradients are instantly relaxed.
Let us call this material behavior ‘liquid’ for which typical stress relaxation time is much
smaller than the process time scale. Hence, thermal gradients are formed but no stress is
generated (Figure 1.2(i)).
When the surface temperature cools down to the temperature at which relaxation time
becomes comparable to the process time scale, ‘solidification stage’ commences and the
surface of the material becomes capable of holding stresses. This material behavior is called
‘viscoelastic’ and involves simultaneous relaxation of the generated stresses. Eventually, the
material will cool to a temperature at which relaxation time becomes large compared to
the process time scale, and thus, the material becomes ‘elastic’. As neighboring layers cool,
an increasingly bigger fraction of the cross section becomes viscoelastic, and subsequently,
elastic. Finally, the center of the material will freeze at time ts which is the end of the
‘solidification’ stage. The temperature and stress profile at an instant in the solidification
stage are demonstrated in Figure 1.2(ii). Note on this figure that stresses do not exist in
the still fluid region about the core. The sense of stresses generated (via equation (1.1))
naturally depends on whether temperature gradients are still growing or started to decay
(i)
(ii)
(iii)
σ
+
− Ta
Tg
Ti
T(x, ts) H
HH
Figure 1.2: Temperature profiles (top) and stress states (bottom) in the three stages of thermal tempering: (i) The temperatures are sufficiently above glass transition Tg and stresses are zero although thermal gradients exist. (ii) Solidification stage; part of the cross section became capable of holding stresses and relaxation times decrease from the (cold) surface to the (hot) mid-plane. The shown stress state is for still-growing thermal gradients that results in tension at the surface. At this particular instant, a region about the mid-plane is still ‘liquid’ and does not hold stress. (iii) Temperature equalization stage; begins with the solidification of entire cross section at timets. In this stage, the temperature profile
T(x, ts) decays to uniform Ta. The shown stresses are temperature equalization stresses, namely, the thermoelastic stresses generated during this decay.
is the case leading to tensile stresses at the surface. This was the case demonstrated in
Figure 1.2(ii). The stresses generated are prone to viscous relaxation until ts and the
(‘survived’) stresses at this point, σ(x, ts), are called the ‘solidification stresses.’
In the third stage of thermal tempering that starts at time ts, the material becomes
practically an elastic plate, imposed with the temperature profile at that instant. The
stresses that will be generated upon decay of this temperature profile are called ‘temperature
equalization stresses,’ and determined via equation (1.1) as
σ(x,∞)−σ(x, ts) =−
Eα
Temperature equalization stresses are compressive on the surface and tensile in the core
and they are demonstrated in Figure 1.2(iii). The final residual stresses (σ(x,∞)) are obviously the superposition of solidification and temperature equalization stresses, and due
to relaxation in the first and second stages, the former is smaller in magnitude1. As a result,
residual compression is obtained on the surface balanced by mid-plane tension.
Gardon [34] reviewed the thermal tempering of silicate glasses and terms such as
tem-perature equalization and solidification stresses are taken from this work. Unlike the trivial
temperature equalization stresses, the analysis of solidification stresses and the stress
evo-lution in the glass transition region is a complicated problem and necessitate various levels
of viscoelastic phenomenology. Gardon classifies the varius models developed for silicate
glasses as instant-freezing theories (e.g., Aggarwala and Saibel [3]), the viscoelastic theory
(Lee et al. [50]) and the structural theory (Narayanaswamy [63, 64]). The first is a
sim-plistic approach to estimate residual stresses, the second is the linear thermoviscoelastic
treatment with time-temperature-superposition principle and the last one is nonlinear
vis-coelastic accounting for the temperature history dependence of the glass structure. The
latter theory is accepted to be thedefinitive theory of thermal tempering in silicate glasses since it achieved reasonable agreement with experiments for both the evolution and
mag-nitude of temper stresses. In silicate glasses, photoelasticity could be used to monitor both
the evolution and final value of temper stresses whereas for BMGs no known method will
avail to monitor the stress evolutionin situ. 1
Heat Transfer Problem
-Material property
6
(k,ρ,Cp) Initial condition
(Ti)
@ @
@ R
Boundary condition (h)
Temperature soln.
T(x, t) Mechanical Problem
Material property (α,E,ν,η, . . .)
6
Boundary condition (ˆti, ˆui) Constitutive Model
@ @
@@R
-σStress(x, t)
Figure 1.3: Structure of the thermal tempering problem: The heat transfer problem is uncoupled from the mechanical problem due to the dominance of forced cooling over heat generation by viscous mechanisms. Hence, it is solved first with the inputs of the boundary condition (e.g., that imposed by the heat transfer coefficient, h), the initial conditions (e.g., initial temperature,Ti), and material parameters in the heat equation. The obtained temperature solution T(x, t) is then fed to the mechanical problem which is solved with a constitutive model (instant freezing, thermoviscoelastic, etc.), the material properties required by the chosen model and the mechanical boundary conditions. The stress history (σ(x, t)), and in particular, residual stresses are solved for comparison with the experimental data.
1.3
Structure of the Problem and Organization of the Thesis
Figure 1.3 is a block diagram to demonstrate the physics of this thermomechanical problem.
The heat produced through inelastic dissipation mechanisms is negligible in comparison to
the heat drawn by forced cooling, therefore the thermal problem is uncoupled from the
mechanical problem. In this way, the heat transfer problem is solved first to obtain the
temperature field, T(x, t), and then this temperature field is imposed on the succeeding mechanical analysis.
Since the main cause of stress generation is the thermal gradient within the sample,
the accurate prediction of stresses relies firstly on the accurate solution of the heat transfer
problem. The constituents of this problem are the boundary conditions (e.g., that imposed
of the material such as thermal conductivity k(T), specific heat Cp(T) and density ρ(T),
which are the material parameters in the heat diffusion equation
∇ ·(k(T)∇T) =ρ(T)Cp(T)
∂T
∂t (1.3)
As mentioned earlier, the temperature range during the casting of theZr41.2T i13.8Cu12.5N i10Be22.5
alloy used in this study is broad (typically from ∼ 1200 to 300 K) and k and Cp exhibit pronounced temperature dependence in this range. Due to the important role of the
tem-perature dependence of these parameters in the problem, a detailed chapter is given in
Appendix A that describes material properties and the study to measure them.
As seen on the block diagram, the evaluatedT(x, t) is then fed to the mechanical problem
which also employs material data. The mechanical problem is solved with a constitutive
model and the material properties needed become a larger set as the sophistication of the
constitutive models increases. Note also that the boundary conditions during the processing
of BMGs are more complicated than the traction-free surfaces of silicate glass tempering
due to the interaction of BMGs with the mold. Finally residual stress prediction is made
and compared with the experimental data. Chapter 2 gives a broad background of the
mechanical constitutive models, namely, linear viscoelasticity concepts, the phenomenology
of silicate glass tempering models and certain characteristic metallic glass features.
A series of studies have been performed for the first time (Aydıner et al. [11], Aydıner et
al. [12], Aydıner and ¨Ust¨undag [9] and Aydıner et al. [10]) to evaluate the thermal tempering
of BMGs. While these articles were prepared, the available material data, in particular the
high temperature values of the thermal parameters, progressively increased in time. In this
in Appendix A. For this reason, some slight discrepancies will be found when the results in
these articles are compared with those in this thesis.
Chapter 3 describes an analytical-experimental study of a copper-mold-cast BMG plate,
the same geometry employed for silicate glasses. On the experimental side, it is
demon-strated for the first time that the crack compliance method is a highly effective technique
to measure residual stresses in BMGs and is particularly suited to thermal tempering
stud-ies due to its ability to resolve through-thickness stress profiles. On the modeling end, a
viscoelastic model for BMG is formulated for the first time making use of the equilibrium
viscosity data as a function of temperature. Analysis is also carried out with a simple
in-stant freezing model. It is concluded that copper mold casting, due to separation of the
cast BMG from the mold, does not allow well defined analysis of the heat transfer
prob-lem. This precludes any detailed comparison of the stress results from the models and the
measurements.
To remedy this problem, Chapter 4 presents an analytical-experimental study for which
an alternative casting process is employed to determine and enhance heat transfer. Here, the
BMG is melt in a stainless steel tube and the cooling is implemented by water quenching.
This method presents a geometry change from a plate to a long cylinder. Agreement
between the measured stresses (using the crack compliance method) and the model results
is achieved within the accuracy of the thermal problem.
A related study is summarized in Appendix B, where a cylindrical stainless steel-BMG
composite produced with a similar process is considered. In this case, the residual strains
in the stainles stainless phase are measured with neutron diffraction and then related to
thermal tempering.
glass tempering) for the Zr41.2T i13.8Cu12.5N i10Be22.5 alloy. In order to investigate the
required material function, volumetric physical aging (structural relaxation) experiments
are performed and presented.
Finally, Chapter 6 summarizes the main conclusions of the study and lists possible future
Chapter 2
Background
This chapter presents a broad background of the thermal tempering phenomenon by drawing
upon literature from multiple fields. First, there are the thermal tempering theories for
silicate glasses for which the process has proved useful for their mechanical performance,
in particular, in glass plates. Roughly over a period of forty years, theories of thermal
tempering evolved by gradually accounting for more complicated physics of the material
behavior: from the theories with a simple instant freezing assumption (e.g. Aggarwala and
Saibel [3]) to a theory that accounted for the temperature history (cooling rate) dependence
of the viscoelastic behavior (Narayanaswamy [64]). This latter theory has been accepted as
thedefinitivetheory of thermal tempering in silicate glasses since it yielded good qualitative and reasonable quantitative agreement with experiments not only for residual stresses but
also for stress evolution during quenching that could be measured in situ by photoelasticity.
Hence, the silicate glass thermal tempering literature provides an obvious starting point
considering behavioral similarities of silicate and metallic glasses. However, although it
seems to comprise the essential physics of silicate glass tempering, the phenomenology of
even the Narayanaswamy theory is arguable in terms of completeness. A broader framework
is, therefore, considered here which will have elements from the polymer literature which
understanding of the metallic glass rheology.
On the other hand, the rheological literature of metallic glasses should be elaborated
considering the material’s unique features dissimilar to other amorphous materials. Metallic
glass literature is indeed noticeably different in character. The lower glass formation ability
of metallic glasses allows limited time to conduct viscoelastic experiments often with little
confidence that the material has perfectly maintained its amorphous structure. Hence,
viscoelastic behavior cannot be investigated to the same degree as in silicate glasses or
polymers. For example, rheology of metallic glasses is often considered only in terms of
averageviscosity. Furthermore, the material has a pronounced nonlinear viscoelastic regime unlike silicate glasses. This is characterized by softening of the material due to deformation
itself and considerable work has been focused on this shear thinning phenomenon, also in relation to formation of shear instabilities calledshear bands.
In order to span this broad field in a sufficiently concise manner, concepts are introduced
only to the extent they are needed in later discussions. The reader is referred to the
numerous excellent sources cited throughout the text for additional details.
2.1
Linear Viscoelasticity Preliminaries
There are many good texts (e.g., by Ferry [33], Lakes [49], Christensen [25]) that cover the
standard material of linear viscoelasticity. The concise coverage here will be confined to
the integral formulation and will exclude the dynamic response. Assuming small
deforma-tions under isothermal and isobaric (more generally structure-preserving) condideforma-tions, linear
viscoelastic constitutive behavior that relates stress and strain tensors in time is given by
σij(t) =
Z t
−∞
Cijkl(t−t0)
∂εkl(t0)
∂t0 dt
or
εij(t) =
Z t
−∞
Jijkl(t−t0)
∂σkl(t0)
∂t0 dt
0 (2.2)
where Cijkl is the tensorial relaxation function and Jijkl is the tensorial creep function.
Thus, local stress history is related to the local strain history via the Boltzmann
super-position which assumes linearity, translation-invariance and non-retroactivity (Gurtin and
Sternberg [36]). To construct the boundary value problem for a bodyB, the remaining field
equations are
εij = 1 2
∂ui(x, t)
∂xj t
+ ∂uj(x, t)
∂xi t (2.3)
∂σij(x, t)
∂xj t
+fi = 0 (2.4)
namely, compatibility (2.3) and equilibrium (2.4) that preserve their form in linear elasticity
and hold at all times. Using the equilibrium equation instead of the equation of motion—
ignoring inertia term—assumes that the body is in quasi-static equilibrium at all times. If
the body is initially undisturbed initial conditions are given by
ui=εij =σij = 0 f or − ∞< t <0 (2.5)
The boundary conditions on the surface of B, denoted by ∂B, take their usual form of
either prescribed traction over∂Btwith an outward-pointing normal vectornor prescribed displacement over ∂Bu,∂Bu+∂Bt=∂B. Thus
σij(x, t)nj(x) = ˆti(x, t) over ∂Bt
ui(x, t) = ˆui(x, t) over ∂Bu
More complicated boundary conditions can be conceived where a traction boundary, in time,
turns into a displacement boundary or vice versa, yet such considerations are out of scope
in this study where even the time dependence in (2.6) can be dropped for the considered
problems.
When the constitutive equations are reduced to isotropic1, linearly viscoelastic materials,
it is logical to express material response through its shear and dilatation components. Hence,
deviatoric stresssij =σij−13σkkδij is related to the deviatoric straineij =εij−13εkkδij via
sij(t) =
Z t
−∞
G(t−t0)∂eij(t 0)
∂t0 dt
0 (2.7)
whereG(t) is the shear relaxation modulus and, similarly, dilatational stressσkk is related to dilatational strain εkk by
σkk(t) =
Z t
−∞
K(t−t0)∂εkk(t 0)
∂t0 dt
0 (2.8)
whereK(t) is the bulk relaxation modulus. Alternatively, creep formulation is given by
eij(t) =
Z t
−∞
J1(t−t0)
∂sij(t0)
∂t0 dt
0 , ε
kk(t) =
Z t
−∞
J2(t−t0)
∂σkk(t0)
∂t0 dt
0 (2.9)
where J1 and J2 are the shear and bulk creep compliances, respectively. Explicitly, shear (bulk) relaxation modulus is defined by the time-dependent response of the material point
to a step disturbance in shear (dilatational) strain normalized by the amplitude of the
step. Shear relaxation modulus is demonstrated in parts (a) and (b) of Figure 2.1. Creep
compliance definitions are obtained by swapping the terms stress and strain in the
previ-1
ous expression. For brevity, the discussion will be limited to the shear (bulk) relaxation
formulation from this point onwards. On a phenomenological basis, relaxation moduli are
τ τi
gi
t
Γ(τ)
G0
G∞
G(t) (= σ12ε(t)
o )
εo
ε12(t)
t
(a)
(b)
(c)
Figure 2.1: (a) Step disturbance in shear strain at t = 0. (b) Shear relaxation modulus
G(t): stress response normalized by the magnitude of the step in strain. (c) Continuous relaxation spectrum Γ(τ), line spectrum; the set of all (gi, τi).
expressed as a superposition of exponential decay functions
G(t) =G∞+ (G0−G∞)P i
giexp
−t
τs i
K(t) =K∞+ (K0−K∞)P i
kiexp
− t τd i (2.10)
where G∞(K∞) is the infinite time (equilibrium) modulus, G0(K0) is the instantaneous
(elastic) modulus, gi(ki) is the weight and τis(τid) the time constant of the ith relaxation
process and the weights satisfy P
i
gi = 1 (P i
ki = 1). The set of all (τis, gi) ((τid, ki))
constitutes the line spectrum of the shear (bulk) relaxation modulus. Relaxation via a
relaxation modulus the following expression is written
G(t) =G∞+ (G0−G∞)
Z ∞
0
Γ(τ) exp
−t
τ
dτ (2.11)
where Γ(τ) is the continuous spectra of relaxation times satisfyingR0∞Γ(τ)dτ = 1. A
sym-bolic plot of discrete and continuous spectrum of the shear relaxation modulus of
Fig-ure 2.1(b) is given in FigFig-ure 2.1(c). Numerical algorithms can be utilized to extract both
types of spectra from relaxation modulus data2 (e.g., see Tschoegl [87]). A simple
alterna-tive expression that can represent multiple-relaxation-time moduli (often reasonably well)
is the stretched exponential function. This form is given by
G(t) =G∞+ (G0−G∞) exp
−t
τs βs
K(t) =K∞+ (K0−K∞) exp
−τt
d βd
(2.12)
where τs(τd) is a mean relaxation time and βs(βd) is the stretching exponent that varies between 0 and 1. βs(βd) = 1 is obviously the Debye relaxation and the spectrum becomes
broader as the value of the stretching exponent gets smaller.
2.2
Basic Linear Thermoviscoelasticity
The theory here refers to the framework introduced by Morland and Lee [60], which is
restricted to a set of materials that are thermorheologically simple3. For these materials, characteristic viscoelastic functions measured at different temperatures (such as relaxation
2Yet, such depth is not meaningful (it may even be deceptive) when the material of concern does not preserve its structure, i.e., the relaxation time(s) change within the time span of the experiment.
and creep moduli) exhibit only a pure shift—no change in shape—when they are plotted
versus logarithm of time. Of course, being a purely phenomenological definition, such
trans-lational invariance is sought only within the accuracy of careful experiments. Figure 2.2(a)
exhibits this phenomenon for the shear relaxation modulus, where G(t) measured at tem-peratureT is denoted byGT. As shown in Figure 2.2(b), a reference temperatureT
r with
logt
logξ a(T)
GT(t)
GT(t)
GT Gr
GT1 GT2 GT3
logt
(a)
(b)
Figure 2.2: (a) Demonstration of thermorheological simplicity (time-temperature super-position) for shear relaxation modulus GT(t) where T is the constant temperature of the measurement (hereT1> T2 > T3 ). (b) Representation ofGT(t) with the reference (master)
curve Gr measured at temperatureTr whereξ is the reduced time.
corresponding relaxation modulus Gr(≡ GTr) can be chosen such that GT can be
repre-sented byGrand the shift functiona(T) that bears the separation between the two curves, defined as
a(T) = τ s i(T)
τs i(Tr)
,∀i (2.13)
Setting the notationF(t) = ˜F(ln(t)) for a function:
˜
GT(lnt) = ˜Gr(lnt−lna(T)) = ˜Gr(ln t
It follows that
GT(t) =Gr(ξ) , ξ = t
a(T) (2.15)
Hence GT can be represented by the master curve,Gr, only by allowing the time for the latter to proceed at a different pace. This latter time, denoted in (2.15) by the letter ξ, is
called the reduced time, whose pace with respect to real time t is determined by the shift functiona(T). When the material experiences a temperature field that is, most generally,
not uniform in time and space, the above definition of reduced time is generalized to
ξ(T(x, t)) =
Z t
0
1
a(T(x, t0))dt 0
(2.16)
With this definition, the Boltzmann superposition form of the constitutive law is preserved
and the reader is referred to Morland and Lee [60] for the proof. Once more exemplifying
for shear relaxation:
sij(x, t) =
Z t
−∞
Gr(ξ(x, t)−ξ(x, t0))∂eij(x, t 0)
∂t0 dt
0 (2.17)
or in an easily derived alternative form
sij(x, ξ) =
Z ξ
−∞
Gr(ξ−ξ0)∂eij(x, ξ 0)
∂ξ0 dξ
0 (2.18)
Hence, compared to the isothermal constitutive equations, all that is needed is to replace
time by reduced time and the characteristic function with the master curve. The remaining
field equations are again compatibility (2.3) and equilibrium (2.4) and it is emphasized
that they hold in real timet. Unfortunately, when the temperature field varies with spatial
time ξ. An important consequence is that theCorrespondence Principle (see, e.g., Gurtin and Sternberg [36]) is no longer useful. This principle, given non-time-varying boundary
conditions, allows obtaining the solution for a linear viscoelasticity boundary value problem
from the problem’s solution in linear elasticity, i.e., the solution of the problem with the
linear elastic constitutive law. It can be seen through the examination of the field equations
that the farthest point the Correspondence Principle would be valid is a temperature field
that varies in time but homogeneous in space. For example, sufficiently slow cooling of
a hot thermorheologically simple viscoelastic body may be approximated like this (see,
e.g., Scherer and Rekhson [76]). Since the thermal tempering problem is certainly not in
this class, further elaboration on this solution method is not necessary. Actually,
semi-analytical solutions to thermoviscoelastic problems with non-uniform temperature fields
are limited (e.g., Muki and Sternberg [62]) only to a few cases with simple geometries and
often under simplifying assumptions such as elastic (instantaneous) bulk response. The
thermoviscoelastic tempering solution for a uniformly cooled infinite plate by Lee at al. [50]
is in this group detailed in the next section.
2.3
Thermoviscoelastic Theory of Silicate Glass Tempering
The solution by Lee et al. [50] is for the simple boundary value problem where an infinite
(length and widththickness) glass plate above its glass transition, yet viscous enough to retain its shape is cooled homogeneously from both sides via air convection. The framework
introduced above has been used to obtain semi-analytical results by assuming that the
dilatational response is linear elastic (instantaneous). Thermal strain,εθ(x, t) =α(T(x, t)−
the same way it is done in thermoelasticity (e.g., Boley and Weiner [15]). Hence
σkk=K0(εkk(x, t)−3εθ(x, t)) (2.19)
whereK0 = 3K, and K is the elastic bulk modulus.
This equation, along with equations (2.16), (2.17) and an appropriate shift functiona(T)
define the constitutive behavior. The solution of this particular boundary value problem
is not reproduced here since it is one of the problems that are considered for the thermal
tempering of bulk metallic glasses in this thesis. The Finite Element Method (FEM) is
generically employed throughout this study to solve the boundary value problems specifying
constitutive laws also since problems other than the infinite plate case are too complicated
for semi-analytic solutions and require numerical solutions4.
The instant freezing theory (e.g., Aggarwala and Saibel [3]) can be deduced from the
viscoelastic theory by assigning an instant freezing temperature such that the material
becomes a non-viscous fluid above it and an elastic solid below it. Therefore, glass transition
is artificially shrank to a point. Under certain operating conditions, it is shown to yield
good accuracy for the final residual stresses, though obviously, it does not comprise the
physics to predict the correct evolution of stresses.
Now, let us worry about the validity of the assumed elastic bulk behavior. For silicate
glasses, the partial justification behind this and another commonly used assumption for
simplifying viscoelastic problems, K(t) G(t),∀t, is demonstrated in Figure 2.3 that has been adapted from Rekhson and Rekhson [72]. First, the bulk relaxation is seen to
be more sluggish than the shear relaxation, and second, the equilibrium modulus K∞ is
nonzero, unlike isochoric shear relaxation which is generally observed to continue until
complete relaxation, i.e., G∞'0 andG0 = 2µ. Rekhson and Rekhson reported τid/τis= 6 and K0/K∞ = 3. Then, they calculated the uniaxial relaxation modulus E(t) and biaxial
K(t),
G(t)
t(s)
Figure 2.3: Bulk relaxation modulus K(t) (curve 1) in comparison to shear relaxation modulusG(t) (curve 2) for silicate glass at 473◦C (adapted from Rekhson and Rekhson [72]).
relaxation modulus M(t) whose elastic counterparts are E and 1E−ν, respectively, for the two cases simplified with the aforementioned assumptions and the exact case for which
K(t)5 shown in Figure 2.3 is used. They observed that neither of the two assumptions yield particularly closer results to the exact solution and both seem reasonable for the problems
of uniaxial and biaxial loading. The biaxial relaxation modulus is the viscoelastic function
that relates in-plane stress to in-plane strain for the one-dimensional (i.e., fields (stress,
temperature, etc.) vary only in the thickness direction) infinite plate problem. So, this
study of Rekhson and Rekhson specifically targets the plate tempering problem with the
treatment for biaxial modulus.
To draw conclusions for the present study, if metallic glass demonstrates similar
teristics, the elastic bulk response appears to be a good assumption. Unfortunately, there
is lack of data from metallic glasses on this issue. For this reason, the present study limits
itself to an elastic bulk deformation. In addition, the relatively low pressures employed in
BMG casting may be expected to limit the inadequacy of ignoring bulk relaxation.
There is another significant shortcoming of the thermoviscoelastic theory that will be
discussed starting in the next section, which led to the structural theory of tempering (Narayanaswamy [64]): The thermoviscoelastic theory makes use of the relaxation data
for stabilized glass, which was shown to be indeed thermorheologically simple (see, e.g.,
Kurkjian [48]). Stabilized glass is a term in silicate glass terminology for liquid at metastable
equilibrium. However, rapidly-cooled glass deviates from metastable equilibrium and mere
temperature dependence does not describe the behavior well. Rather, it is required to
account for the dependence of structure ontemperature history.
2.4
Temperature History Dependence of Structure
The general term structure is used in the title since the complete set of thermodynamic and kinetic properties of a glassy material, such as enthalpy, entropy, volume and viscosity
are influenced by the imposed temperature history around glass transition. However, in
the context of the thermal stress problem, attention is essentially constrained to specific
volume, v, and viscosity (more specifically relaxation times). An important parameter for
the following discussion is the linear coefficient of thermal expansion (CTE), which for
isotropic expansion, is given by
α= 1 3v
∂v ∂T
P
' 1
3v(0)
∂v ∂T
P
where v(0) is the specific volume at the beginning (t = 0) of the process and the second
part is valid for small volumetric changes6. Also, in terms of isotropic thermal strain ε
θ,
CTE definition becomes
α=
∂εθ
∂T
P
(2.21)
Now, let us formally phrase the question that we currently seek an answer for: “Consider
a traction-free particle of glassy material under atmospheric pressure. Given, temperature
history, ∞T
t=0, imposed on it, what is the specific volume response of the particle in time,
v(t)?”
The question has a nontrivial answer about the glass transition region, due to the kinetic
nature of the glass transition phenomenon. This is demonstrated in the example shown in
Figure 2.4(a) that considers the volumetric response to cooling from above melting
tem-perature to room temtem-perature with two different rates denoted by T.1 and
.
T2, such that
.
T2 >
.
T1. As the cooling rate is increased, the material has less time for structural
ar-rangements that result in volume compaction and the glass transition is shifted to higher
temperatures. Also, the curve of the case where crystallization occurs at melting
temper-ature Tm is plotted for reference. For a rapidly cooled glass forming material that evades
crystallization at and under Tm, the region between Tm and glass transition is called the
supercooled liquid region7. In the supercooled liquid region, the material is in metastable equilibrium; metastable, since real thermodynamic equilibrium is achieved with crystalliza-tion that is averted in laboratory time scales by sluggish kinetics. The CTE here is denoted
by αl, where subscript ‘l’ is for ‘liquid’. On the other hand, the low temperature region
to the left of glass transition region in Figure 2.4 is called the glassy region and the CTE 6For clarity, the factor 3 will be omitted in the volume expansion expressions in this chapter that follow. In these expressions,αshould be understood as the volumetric CTE that is three times the linear CTE.
v v . T1 . T2 T T
Tg( .
T1) Tm TTgTf Ti
v
v∞
vi
1
1
αlv(0)
αgv(0)
αlv(0)
αgv(0)
1 1 Glass trans. reg. for . T1 glassy line metas. equi. line
(a)
(b)
Figure 2.4: (a) Specific volume (v) vs. temperature (T) curves traced by a glassy material for cooling rates
.
T1 and
.
T2,
.
T2 >
.
T1. The crystal curve (dashed) is also provided for
reference. The glass transition region is indicated for the .
T1 case between supercooled
liquid and glassy regions. (b) Zoom of the glass transition region for the T.1 case.
here is denoted byαg. Typically, the value of αl is 1.5 to 3 times that of αg. For the sake
of discussion, let us assume that both αl and αg are constant values ignoring their weak
variation in supercooled liquid and glassy regions, respectively.
As shown Figure 2.4(a), the glass transition region is where the CTE decays from αl
to αg while its span and nature depend on the cooling history. Figure 2.4(b) is a zoom
of the glass transition region for the T.1 cooling rate. In this plot, let us call the line
that passes through (but not limited to) the points in the supercooled liquid region, the
metastable equilibrium line. Likewise, the line that passes through the points in the glassy region will be the glassy line. Accordingly, the glass transition temperature,Tg, is defined as the temperature at the intersection of these two lines. This definition is somewhat more
rigorous than the engineering definition as the temperature that corresponds to a fixed value
deviation from metastable equilibrium. Verbally, Tf corresponds to a point (T, v) at the
intersection of the line that is extrapolated from (T, v) with the glassy slope αgv(0) and
the metastable equilibrium line. It should now be apparent that Tf equals to the actual
temperature T in the supercooled liquid region, then starts to lag behind it in the glass
transition region and finally settles to the constant value ofTg at the onset of glassy region.
The volumetric departure from metastable equilibrium at point (T, v), denoted by ∆v, can
easily be expressed in terms ofTf as
∆v=v−v∞(T) =αsv(0)(Tf −T) (2.22)
where αs =αl−αg is called the structural CTE and v∞(T) is the metastable equilibrium volume at temperatureT. More explicitly, it is the specific volume the material would tend
to ast→ ∞in an isothermal hold at temperatureT. Now, as a step to formulate an answer to our main question, consider some simple temperature step experiments. In these, the
glassy material is allowed to achieve metastable equilibrium, and then its temperature is
altered abruptly by ∆T.
The experiment for upward and downward jumps of ∆T to a common target temperature
T is shown in Figure 2.5(a). An important assumption on material behavior is that the
material gives an instantaneous response to the temperature jump with the glassy CTE,
hence volume contracts for the downward jump (expands for the upward jump) byαgv(0)∆T
instantly. This is due to the fact that glassy expansion represents stretching of interatomic
bonds, much like the one in a perfect crystalline lattice with no viscous mechanisms. The
time dependence is in the remainder of the isothermal contraction (expansion) ofαsv(0)∆T
αgv(0)
αlv(0)
αgv(0)
1
1 1
1
1 2
2
v(0)
v∞(T) v
T
T-∆T T+∆T T −1 t
0 1
MVT,∆T(t)
metastable equilibrium
line
(a)
(b)
Figure 2.5: (a) Upward and downward temperature jump experiments to a target tempera-ture T on thev−T plot; instantaneous response with the glassy slope and following time-dependent relaxation to the equilibrium volume for downward (path 1) and upward (path
2) jumps. (b) Structural relaxation function MVT,∆T(t) for downward(1) and upward(2) jumps.
function of Figure 2.5(b) is given by
MVT,∆T(t) = v(t)−v∞(T)
v(0)−v∞(T)
= Tf(t)−T
∆T (2.23)
where T is the temperature of the isothermal hold and ∆T is the jump to it. The sign of
∆T is positive for an upward jump and vice versa. To demonstrate the ∆T dependence,
the asymmetry of the structural relaxation functionsMVT,∆T(t) andMVT,−∆T(t), is pictured
in Figure 2.5(b). The reason for this asymmetry is the dependence of the relaxation times
on the dependent variablev itself. This, by definition makes the process nonlinear. In the
upward jump experiment, the material obviously starts from a more compact structure in
comparison to the downward jump experiment. In fact, the specific volume in the former
process is always less thanv∞(T) whereas the opposite is true for the latter. This means, the
relaxation times are always bigger in the upward jump experiment making it more sluggish.
as the structure becomes more compact and therefore it is called autoretarded. Obviously, the opposite is true for the upward jump experiment and it is calledautocatalytic.
To eliminate the dependence on ∆T, Narayanaswamy [63] has written the function in
the limit sense
MTV(t) = lim
∆T→0M
T,∆T
V (t) (2.24)
which is called the structural relaxation modulus. Now, analogous to the time-temperature
superposition, a reference temperature,Tr is chosen and the structural relaxation modulus
for the equilibrium liquid at this temperature is taken to be the master curve, denoted by
Mr
V. Through the reduced time concept, anyM T,∆T
V can be represented as
MVT,∆T(t) =MrV(ξ) (2.25)
provided that the shift function depends not only on temperature but structure (specific
volume) to account for the aforementioned nonlinearity. Expressing in terms of fictive
temperature to reproduce Narayanaswamy’s theory, the shift function is given by
ξ(T, Tf) =
Z t
0
1
a(T(t0), Tf(t0))
dt0 (2.26)
This generalization of the time-temperature superposition is called the
time-temperature-structure superposition8. Narayanaswamy [63] proposed the following form
a(T, Tf) = exp
Q R
x T +
1−x Tf − 1 Tr (2.27) 8