Interactions
Thesis by
Fred Chae-Reem Yang
In Partial Fulfillment of the Requirements for the Degree of
Doctor of Philosophy
CALIFORNIA INSTITUTE OF TECHNOLOGY Pasadena, California
2019
© 2019
Fred Chae-Reem Yang ORCID: 0000-0002-5615-5170
ACKNOWLEDGEMENTS
My time at Caltech has been a difficult yet satisfying period of professional and personal growth. I would not have been able to make it past the obstacles and emerge a better person without the positive support I had received from many people over the course of my graduate studies.
First, I would like to express my gratitude to my advisor, Professor Brent Fultz, for giving me the opportunity to work with him over the past few years. He had allowed me to explore topics and projects that I found interesting while grounding me in reality when needed, sometimes seeing the big picture when I would be missing the forest for the trees. I appreciated his guidance and accessibility as he helped me develop into an independent scientist.
I would like to thank the members of my thesis committee, Professors Austin Minnich, Keith Schwab, and Marco Bernardi, for their guidance and support. I look forward to thoughtful discussions yet to come.
I would like to thank the former and current members of the Fultz group. I have had the great pleasure of collaborating with Jorge Muñoz. His mentorship helped me navigate the start of my graduate studies, and I appreciated his many research insights and his career advice. I owe my heartfelt thanks to Matthew Lucas for his help and insight with the FeTi project and for his expertise that allowed the Pd3Fe beamtime experiment to come into fruition. Olle Hellman allowed me to make the jump into computational materials science, helping me tackle research problems I would not have been able to explore otherwise. I appreciated his patience as he answered my many questions. I have learned a lot about neutron scattering and running experiments from Hillary Smith, and it was always an immense pleasure to work with her. I want to give her my heartfelt thanks for always providing assistance with my experiments without any sense of hesitation.
This research would not have been possible without the generous support from the Capital-DOE Alliance Center (CDAC) and the dedication of Dr. Russell Hemley and Dr. Steve Gramsch. I would also like to thank the staff scientists I worked with, including Yuming Xiao and Paul Chow at Argonne National Laboratory; Doug Abernathy and Matt Stone at Oak Ridge National Laboratory; and Nick Butch, Terry Udovic, and Juscelino Leao at the NIST Center for Neutron Research.
I want to thank many people outside of the group. This would include everyone I had met in my class and the APhMS programs (special thanks to Stephen for our collaborations on our problem sets and for his research insights), the Steuben house, people I had met from our graduate student orientation, the Global Throopers softball team, and several Caltech staff who have always gone the extra mile to provide assistance and make sure I was welcome at Caltech.
I want to thank a few of my off-campus friends who have kept in touch with me after Berkeley. Dara helped me stay sane throughout the past few years and provided crucial career advice. Jeremy also kept me sane, provided alternate perspectives that I needed, and helped me explore LA and its culture when I would have otherwise been stuck in Pasadena.
ABSTRACT
Computational materials discovery and design has emerged in order to meet the surge in demand for new materials for applications ranging from clean alternative energy to human welfare. This acceleration of materials discovery is exhilarating, but the applications of new advanced materials can be limited by their thermo-dynamic stability. Accurate calculations of the Gibbs free energy, a measure of thermodynamic stability, require a deep understanding of atomic vibrations, a main source of entropy in materials. This deep understanding of atomic vibrations re-quires us to treat phonons (quantized lattice vibrations) beyond the harmonic model by considering their interactions with various excitations. In this thesis, I present the effects of high temperature interactions of phonons with electrons and magnetic excitations on the thermodynamics of FeTi, vanadium, and Pd3Fe.
A combination of ab initio calculations, inelastic neutron scattering (INS), and nuclear resonant inelastic x-ray scattering (NRIXS) showed an anomalous thermal softening of the M5− phonon mode in B2-ordered FeTi and a thermal stiffening of the longitudinal acoustic N phonon mode in body-centered-cubic vanadium. Computational investigations involving electronic band unfolding were performed to identify the nesting features on Fermi surfaces crucial to high temperature electron-phonon interactions in FeTi and vanadium. These investigations showed that the Fermi surface of FeTi undergoes a novel thermally driven electronic topological transition (ETT), in which new features of the Fermi surface arise at elevated temperatures. This ETT was also observed in vanadium, but the effects were overtaken by the thermal smearing of the Fermi surface that decreased the rate of electron-phonon scattering.
PUBLISHED CONTENT AND CONTRIBUTIONS
[1] F. C. Yang, J. A. Muñoz, O. Hellman, L. Mauger, M. S. Lucas, S. J. Tracy, M. B. Stone, D. L. Abernathy, Y. Xiao, and B. Fultz. “Thermally Driven Electronic Topological Transition in FeTi”. Physical Review Letters117, 076402 (2016). DOI: 10.1103/PhysRevLett.117.076402.
F.C.Y analyzed the data, performed the computational analysis, and conducted the writing of the manuscript.
[2] H. L. Smith, C. W. Li, A. Hoff, G. R. Garrett, D. S. Kim, F. C. Yang, M. S. Lucas, T. Swan-Wood, J. Y. Y. Lin, M. B. Stone, D. L. Abernathy, M. D. Demetriou, and B. Fultz. “Separating the configurational and vibrational entropy contributions in metallic glasses”. Nature Physics 13, 900 (2017). DOI: 10.1038/nphys4142.
F.C.Y participated in the experiment and commented on the manuscript.
[3] F. C. Yang, O. Hellman, M. S. Lucas, H. L. Smith, C. N. Saunders, Y. Xiao, P. Chow, and B. Fultz. “Temperature dependence of phonons in Pd3Fe through the Curie temperature”. Physical Review B98, 024301 (2018). DOI: 10.1103/PhysRevB.98.024301.
F.C.Y conceptualized the project, prepared the sample and conducted the exper-iment, reduced and analyzed the data, performed all calculations, and conducted the writing of the manuscript.
[4] H. L. Smith, Y. Shen, D. S. Kim, F. C. Yang, C. P. Adams, C. W. Li, D. L. Abernathy, M. B. Stone, and B. Fultz. “Temperature dependence of phonons in FeGe2”. Physical Review Materials2, 103602 (2018). DOI: 10.1103/Phys-RevMaterials.2.103602.
F.C.Y performed one of the measurements, reduced the data, and commented on the manuscript.
[5] F. C. Yang, O. Hellman, and B. Fultz. “Thermal Evolution of Electron-Phonon Interactions in Vanadium”. In Preparation.
TABLE OF CONTENTS
Acknowledgements . . . iv
Abstract . . . vi
Published Content and Contributions . . . vii
Table of Contents . . . viii
List of Illustrations . . . ix
List of Tables . . . xvi
Chapter I: Introduction . . . 1
1.1 Overview . . . 1
1.2 Harmonic Lattice Dynamics . . . 2
1.3 Electron-Phonon Interactions . . . 6
1.4 Magnon-Phonon Interactions . . . 9
Chapter II: Thermally Driven Electronic Topological Transition in FeTi . . . 12
2.1 Main Text . . . 12
2.2 Supporting Information . . . 19
Chapter III: Thermal Evolution of Electron-Phonon Interactions in Vanadium 27 3.1 Introduction . . . 27
3.2 Computation . . . 28
3.3 Results . . . 33
3.4 Discussion . . . 38
3.5 Conclusions . . . 46
Chapter IV: Temperature Dependence of Phonons in Pd3Fe Through the Curie Temperature . . . 47
4.1 Introduction . . . 47
4.2 Methods . . . 48
4.3 Results . . . 53
4.4 Discussion . . . 62
4.5 Conclusions . . . 65
4.6 Supporting Information . . . 67
Chapter V: Concluding Remarks and Future Directions . . . 75
5.1 Electron-Phonon Interactions . . . 75
5.2 Magnon-Phonon Interactions . . . 77
Appendix A: Harmonic Model . . . 80
A.1 Einstein and Debye Models . . . 80
A.2 Born von Kármán Model . . . 80
LIST OF ILLUSTRATIONS
Number Page
1.1 (Left) The harmonicSh, quasiharmonicSqh, and measured vibrational entropy Svib of α-iron compared with the total entropy from the SGTE database [6]. Vibrational entropies calculated and measured by Mauger et al. [7]. (Right) The harmonic, quasiharmonic, and measured vibrational entropy of vanadium [10] compared with the total entropy from the SGTE database [6] and laser-flash calorimetry measurements by Takahashiet al. [9]. . . 4 1.2 The effects of temperature (from bottom to top) on phonons (left)
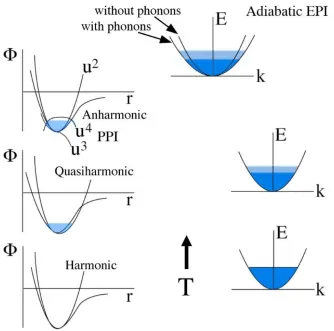
and electrons (right), and the effects of the adiabatic electron-phonon interaction (EPI) when phonons alter the electronic band structure in the presence of electron excitations. Also shown are illustrations of the quasiharmonic approximation and phonon-phonon interactions (PPI). Increasing width of light shading indicates increasing thermal energy spreads. From Ref. [4]. . . 5 1.3 (Left) Phonon densities of states (DOS) of vanadium from 10 to
1273 K, as measured by Delaireet al. [10]. (Right) Electronic DOS (eDOS) of vanadium at 0 and 1000 K. The 0 K eDOS was calculated with a static density functional theory (DFT) calculation. The 1000 K eDOS was calculated from a convolution of the 0 K eDOS with a Lorentzian with a full-width-at-half-maximum (FWHM) of 380 meV [10]. . . 8 1.4 Trends in the temperature dependence of phonon energiesω on
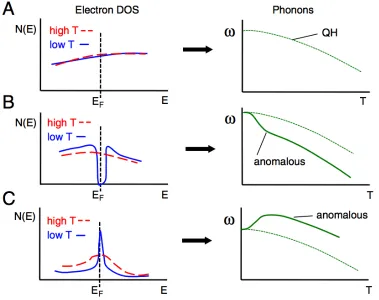
1.5 (Left) The nonharmonic vibrational entropy∆Snhfrom phonon DOS spectra measured by Maugeret al. compared to the magnetization of bcc Fe [29] and the magnetic vibrational entropy Smag, obtained by subtractingSvibandSel [32] from the SGTE total entropy [6]. From Ref. [7]. (Right) Average Fe phonon energies of cementite from NRIXS measurements (points). The dashed lines are quasiharmonic energies from experiment (“QH γT Model”) and computation (“QH
DFT”). From Ref. [31]. . . 10 2.1 Calculated FeTi phonon dispersions at temperatures from 300 to
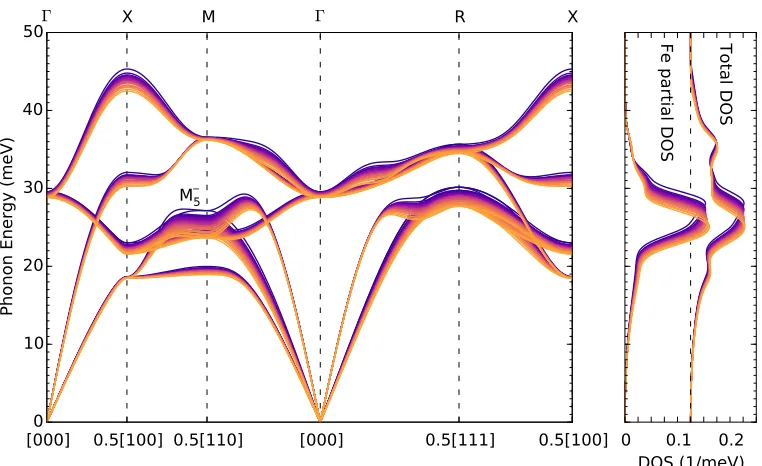
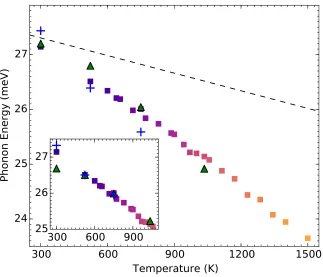
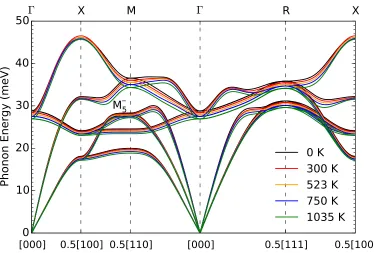
1500 K. Also shown are phonon DOS curves for the motions of all atoms (total) and iron atoms (Fe partial). . . 13 2.2 Temperature dependence of the M5− phonon energy calculated from
TDEP (squares). The colors of the squares are identical to those shown in Fig. 2.1. The green and blue markers are mean phonon energies obtained from Lorentizan fits to the Fe NRIXS DOS and the INS DOS, respectively. The dashed line is the thermal softening of the M5− phonon from quasiharmonicity alone. The inset shows the agreement in the slopes of the experimental and computational phonon energies without quasiharmonic contributions. For conve-nience in showing the slopes, the NRIXS data were offset by −0.76 meV and the INS by−0.35 meV. . . 14 2.3 Experimental FeTi phonon DOS curves. The neutron-weighted DOS
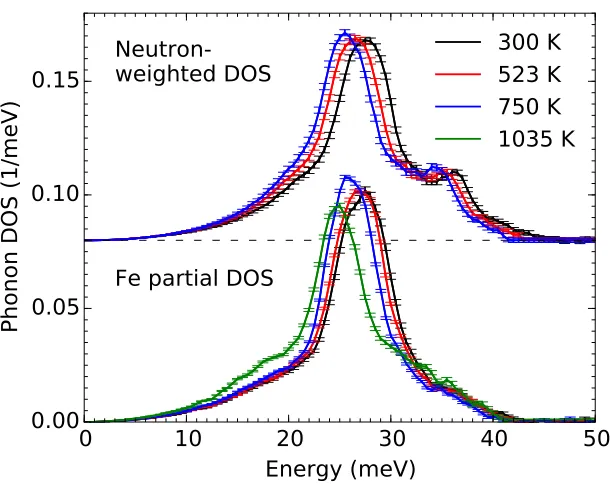
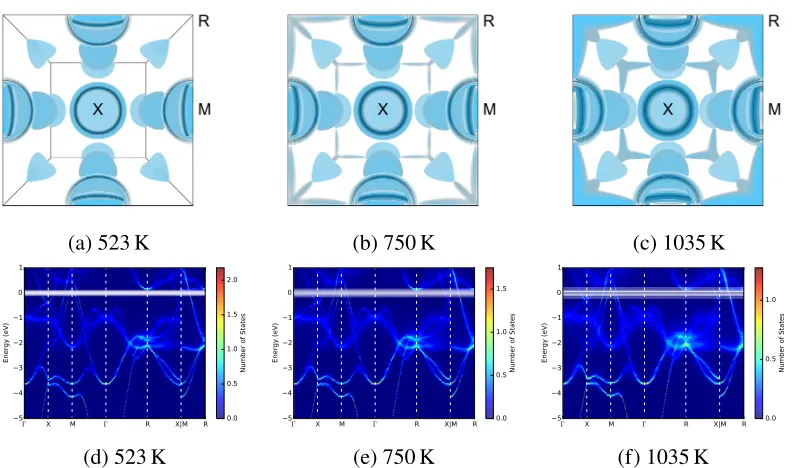
curves were obtained from INS measurements and the Fe partial DOS curves from NRIXS measurements. Error bars are from counting statistics. . . 15 2.4 (a)-(c) Approximated finite-temperature Fermi surfaces in the
2.5 Histogram of spanning vectors that couple the new states at one of the R symmetry points with the rest of the Fermi surface along the[ξξ0] and 12ξ0 directions at 1035 K, displayed together with the changes in energies of the TA and LA branches from 300 K to 1035 K along the same directions. . . 17 2.6 A view of the displacement pattern of the M5− phonon, in which Fe
(orange) and Ti (blue) atoms move along the 1¯10 directions. The dashed lines are the 1nn Fe–Ti interactions, and the solid lines are the 2nn Fe–Fe interactions. . . 18 2.7 Neutron scattering function S(Q,E)spectrum of FeTi at 300 K. . . . 20 2.8 Phonon DOS curves for FeTi at elevated temperatures. The
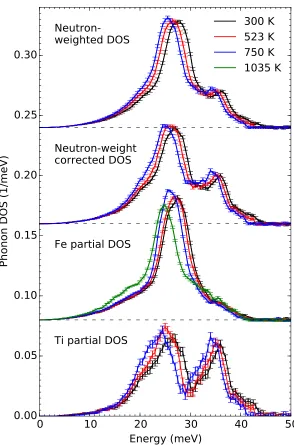
neutron-weighted DOS curves were obtained from INS measurements and the Fe partial DOS curves from NRIXS measurements. The two data sets were combined to obtain neutron-weight-corrected DOS curves and Ti partial DOS curves. Error bars from counting statistics. . . 21 2.9 FeTi phonon dispersions calculated in the quasiharmonic model. . . . 23 2.10 Calculated 0 K electron-phonon linewidths displayed over the 0 K
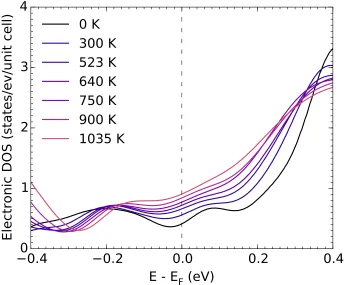
FeTi phonon dispersion. . . 24 2.11 Electronic DOS for FeTi from 0 to 1035 K. Obtained from AIMD
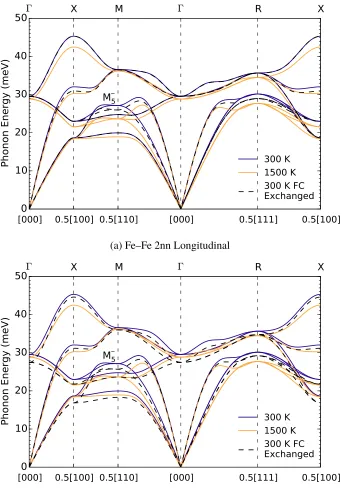
and static DFT calculations. . . 24 2.12 FeTi phonon dispersions calculated after individually exchanging
the (a) Fe–Fe 2nn longitudinal and (b) Fe–Ti 1nn transverse force constants at 300 K with those at 1500 K. . . 26 3.1 (a) The phonon DOS curves of vanadium calculated with the s-TDEP
method at temperatures from 0 (dark purple) to 1650 K (orange). (b) Average phonon energies of vanadium calculated with the s-TDEP method (identical colors to those shown in (a)), shown together with average phonon energies from inelastic neutron scattering measure-ments (Refs. [10, 84, 98]). The dashed red curve corresponds to quasiharmonic (QH) behavior as calculated from first-principles. . . . 34 3.2 The 300 K spectral function calculated with s-TDEP along the
3.3 Phonon dispersion curves of vanadium calculated with the s-TDEP method at temperatures from 0 (dark purple) to 1650 K (orange). Vector coordinates are written in simple cubic lattice coordinates. . . 35 3.4 Unfolded electronic bands at 1100 K, compared with 0 K electronic
bands in dark red. The Fermi level is represented as a spread in energies. 36 3.5 The{100}cross sections of the Fermi surface of vanadium at (a) 0 K
and (b) 1100 K (cross section indices are expressed in simple cubic coordinates). . . 38 3.6 (Top) 0 K electron-phonon coupling strengths of phonon modes
cal-culated with Quantum ESPRESSO displayed over the 0 K vanadium phonon dispersion calculated with s-TDEP. (Bottom) Autocorrelation of the Fermi surface at 0 and 1100 K. . . 39 3.7 {100} cross sections of the Fermi surface nesting strengths of
vana-dium for the transverse phonon mode at q = [0.24,0,0] at (a) 0 K and (b) 1100 K, the longitudinal N phonon mode at (c) 0 K and (d) 1100 K, and the H phonon mode at (e) 0 K and (f) 1100 K. Sample [0.24,0,0]and[0.5,0.5,0]spanning vectors are shown in (a) and (c). 42 3.8 The electrical resistivities of bcc transition metals relative to their
300 K values. The plotted data are from measurements on high-purity samples. . . 44 4.1 (a) Schematic of supercells with Fe atoms (dark blue) stochastically
displaced from their ideal positions (light blue) in the 0 K ferromag-netic calculations, where the magferromag-netic moments (red arrows) are aligned in the same direction. (b) Supercells with randomly oriented magnetic moments and stochastically displaced Fe atoms in the 800 K paramagnetic calculations. Each set of randomly oriented magnetic moments is a magnetic special quasirandom structure (SQS). Pd atoms are not shown for this illustration. . . 52 4.2 The57Fe nuclear forward scattering spectra fromL12-ordered Pd3Fe
4.3 The magnetization curve of Pd3Fe obtained from an empirical fit of a magnetic shape function [172] to hyperfine magnetic fields obtained from the NFS spectra in this study (green) and Mössbauer data from a study by Longworth [154] (orange). The shaded region indicates the temperature range where Pd3Fe exhibits ferromagnetic order. . . . 55 4.4 The normalized57Fe pDOS extracted from NRIXS measurements at
various temperatures. The spectra from measurements above 298 K are offset and compared with the 298 K pDOS (black curve). Error bars are from counting statistics. . . 56 4.5 Average energies of the Fe pDOS from NRIXS measurements (blue
points) plotted with the average Fe phonon energies from the Grüneisen parameter model (green line) and the QH DFT model (red line). . . . 57 4.6 Total, Pd partial, and Fe partial phonon DOS curves of Pd3Fe
calcu-lated with the s-TDEP method from 0 to 800 K. . . 58 4.7 (a) NRIXS57Fe pDOS curves compared at 298 and 786 K. (b) s-TDEP
Fe pDOS curves compared at 300 and 800 K. Phonon difference spectra are shown for both NRIXS and s-TDEP. . . 59 4.8 (a) The Fe partial vibrational entropy from the NRIXS measurements
compared with the entropy from the Grüneisen parameter model (QH
γT) and the QH DFT model. (b) The s-TDEP Fe partial vibrational entropy calculated for Pd3Fe with changing magnetic order (blue), ferromagnetic order (green), and the absence of phonon-phonon in-teractions (orange). The red line is the entropy from the QH DFT model. The insets in (a) and (b) show the nonharmonic contributions to the vibrational entropy. . . 60 4.9 Calculated phonon dispersions for the ferromagnetic and
4.10 Pd3Fe spectral functions (logarithmic intensity scale) calculated with s-TDEP along the high-symmetry directions at 0, 300, and 800 K. Measurements of the 80 K phonon dispersion by inelastic neutron scattering [176] are shown on top of the 0 K spectral function. . . 64 4.11 Pd3Fe phonon lineshapes at the X high symmetry point at 800 K. The
orange and green peaks are the optical modes that shift with changing magnetic order. The black dashed peak is the lineshape of the optical mode after the Pd−Pd 1NN cubic force constant is set to zero. . . 64 4.12 X-ray diffraction patterns of Pd573 Fe (“Ordered-II”) collected on a
Cu Kα laboratory diffractometer. Measurements were performed on the sample after the heat treatment (“Pre-NRIXS”) and after the NRIXS measurements (“Post-NRIXS”). The labeled peaks include both fundamental and superlattice peaks. The intensity is displayed in a logarithmic scale. . . 67 4.13 (Top) Room temperature Mössbauer spectrum of the annealed Pd573 Fe
foil sample before the NRIXS experiment (Ordered-II). (Bottom) Pd573 Fe Mössbauer spectra for the “Ordered-I” state, “Ordered-II” state, and after the NRIXS experiment. . . 69 4.14 Two-dimensional synchrotron diffraction patterns of Pd3Fe recorded
on a CCD detector plate at (a) 298 K and (b) 786 K. (c) One-dimensional synchrotron x-ray diffraction patterns of Pd573 Fe from 298 to 786 K. The black dashed lines are the locations of the 298 K diffraction peaks. The dips in intensity for 627 and 786 K are where extraneous diffraction peaks from the aluminum foil were masked. . . 70 4.15 (Left) Raw NRIXS scattering spectra showing 57Fe vibrational
ex-citations in Pd573 Fe as a function of scattering energy. Spectra are collected over a range of temperatures. (Right) The elastic line of the raw scattering spectrum of57Fe at room temperature, used as the instrument resolution function for the NRIXS measurements. . . 72 4.16 The multi-phonon components of the NRIXS spectra of Pd573 Fe at
(left) 298 K and (right) 786 K. . . 72 4.17 Lamb-Mössbauer factors obtained from NRIXS (blue squares) and
4.18 The room temperature57Fe pDOS of the Pd573 Fe sample measured in this study (purple) compared with prior measurements of the room temperature57Fe pDOS of ordered Pd573 Fe (black) and the disordered fcc alloy Pd0.7557Fe0.25 (red). . . 74 5.1 The frequency shifts and linewidth of the Eg 187 cm−1 Raman line
LIST OF TABLES
Number Page
3.1 Electron-phonon interaction parameters and superconducting transi-tion temperatures of nonmagnetic bcc transitransi-tion metals. . . 44 4.1 Hyperfine fieldsHand change in the hyperfine field∆Hin the Pd573 Fe
sample at different stages of this study, shown together with measure-ments performed by Longworth [154]. For the Pd573 Fe sample, the hyperfine field for “Ordered-II” is treated as a reference for∆H. For the measurements performed by Longworth, the hyperfine field for the ordered sample is treated as a reference for∆H. . . 68 4.2 The Fe partial vibrational heat capacity calculated from the
integra-tion of the57Fe phonon DOS. . . 72 4.3 The vibrational kinetic energy calculated from the integration of the
57Fe phonon DOS. . . 73
C h a p t e r 1
INTRODUCTION
“A theory is the more impressive the greater the simplicity of its premises, the more different kinds of things it relates, and the more extended its area of applicability. Therefore the deep impression that classical thermodynamics made upon me. It is the only physical theory of universal content which I am convinced will never be overthrown, within the framework of applicability of its basic concepts.”
— Albert Einstein
1.1 Overview
The traditional development of materials for industrial applications typically takes decades, from initial discovery to market. The demand for new advanced materials that address pertinent challenges including clean energy, national security, and human welfare has only grown stronger over time. In response, recent research efforts and initiatives including the Materials Genome Initiative have aimed to accelerate the process of discovering, manufacturing, and mass producing new materials [1].
High performance computing (HPC) has become a major part of this push towards accelerated materials discovery. Computational materials discovery would allow us to predict candidate materials given desired macroscopic properties, minimizing the time and cost of experimental discovery. Recent developments to computa-tional materials discovery have been made through high-throughput computing, in which large volumes of ab initio calculations are combined with data mining of large databases using supercomputer architectures [2]. With the explosion of new materials discoveries from these new methods, we are living in exciting times.
of materials:
G =U+PV−T S. (1.1)
The stable phase is the one that minimizes the free energy given conditions includ-ing temperature, pressure, mechanical stress, and magnetism [3]. Calculatinclud-ing and understanding the free energy of a phase and of competing phases provides essen-tial information on material stability under different operational temperatures, an important consideration concerning the processing and performance of the material in technological service.
The entropic contribution to the free energy of solids, −T S, changes rapidly with temperature. The entropyS enumerates the way heat is stored in a material within the many degrees of freedom of the material. For ordered crystalline solids, the vibrations of atoms make up the largest entropic contribution. With increasing temperature, we see increased populations ofphonons, quanta of lattice vibrations, and greater vibrational excursions of atoms. Thevibrational entropy Svibincreases with temperature because the material explores a larger volume in the phase space of position and momentum [4]. Understanding the vibrational entropy and the lattice dynamics of a material is crucial for accurately calculating the temperature-dependent behavior of its free energy.
1.2 Harmonic Lattice Dynamics
We can begin our discussion of lattice vibrations by building off of the harmonic model, in which lattice vibrations are calculated from a Taylor expansion of the potential energy of the crystal up to the second order of atomic displacement. In this model, normal modes do not transfer energy to other normal modes, such that phonons with energies εi may be considered as independent harmonic oscillators
that persist forever. This treatment allows us to write the partition function of a harmonic solid with N atoms and 3N independent oscillators as the product of individual oscillator partition functions:
ZN =
3N
Ö
i
Zi =
3N
Ö
i
e−βεi/2
where β ≡ (kBT)−1. From this partition function, we can calculate the vibrational entropy by differentiating the phonon free energyFvib= −kBTlnZN:
Svib= −
∂
Fvib
∂T
V
= kB 3N
Õ
i
−ln1−e−βεi + βεi
eβεi −1
. (1.3)
From the vibrational entropy, we can calculate thermodynamic quantities such as the heat capacity from lattice vibrations:
CV(T)=T
∂
S
∂T
V
= kB 3N
Õ
i
(βεi)2
eβεi
(eβεi −1)2. (1.4)
The mean occupation of these bosonic oscillators can be described with the Planck distribution
nT(εi)=
1
eβεi −1, (1.5)
with which we can rewrite Eq. 1.3 as
Svib = kB 3N
Õ
i
[(nT(εi)+1)ln(nT(εi)+1) −nT(εi)ln(nT(εi))]. (1.6)
We often work with a phonon density of states (DOS)g(ε), a distribution of phonon modes with respect to energy. Measurements or calculations of phonon frequencies allow us to calculate the vibrational entropy and thermodynamic quantities:
Svib =3N kB
∫
g(ε)[(nT(ε)+1)ln(nT(ε)+1) −nT(ε)ln(nT(ε))]dε. (1.7)
In this harmonic approximation of the vibrational entropy, the only temperature dependence is from the Planck distributionnT(ε). Phonon frequencies and the DOS
can be calculated following the Einstein, Debye, or Born von Kármán model [5], as discussed in Appendix A.
The harmonic model often explains physical phenomena at low temperatures. Fig. 1.1 shows that the harmonic vibrational entropyShofα-iron deviates from both the
total entropy [6] and vibrational entropy measured with inelastic x-ray scattering [7] at high temperatures. We can rectify some shortcomings of the harmonic model with the quasiharmonic (QH) model, which introduces effects of thermal expansion. Phonons are still treated as independent harmonic oscillators, but the frequencies are scaled by the change in volume with increasing temperature:
∆ω
ω =−γ
∆V
0 200 400 600 800 1000 1200 1400 1600 Temperature (K)
0 2 4 6 8 10
En
tro
py
(kB
/a
to
m
)
SGTE
Takahashi, et al. Svib (INS)
Svib (QH)
Svib (Harmonic)
Figure 1.1: (Left) The harmonicSh, quasiharmonic Sqh, and measured vibrational entropySvibofα-iron compared with the total entropy from the SGTE database [6]. Vibrational entropies calculated and measured by Mauger et al. [7]. (Right) The harmonic, quasiharmonic, and measured vibrational entropy of vanadium [10] com-pared with the total entropy from the SGTE database [6] and laser-flash calorimetry measurements by Takahashiet al. [9].
where the proportionality constant γ is the Grüneisen parameter [8]. Using the expression for the vibrational entropy (Eq. 1.6), its temperature dependence is introduced from both the Planck distributionnT(ε)and how the phonon DOSgT(ε)
is scaled with Eq. 1.8. Fig. 1.1 shows that the QH model improves on the harmonic model, but still falls short of the measured vibrational entropy. Fig. 1.1 also shows us how the vibrational entropy from the QH model deviates from the total entropy of vanadium [6, 9] and fails to model the vibrational entropy of vanadium measured with inelastic neutron scattering [10]. We note for Fig. 1.1 that the difference between the total and vibrational entropies ofα-Fe is the sum of the electronic and magnetic entropies, and the difference between the total and vibrational entropies of vanadium is the electronic entropy.
Figure 1.2: The effects of temperature (from bottom to top) on phonons (left) and electrons (right), and the effects of the adiabatic electron-phonon interaction (EPI) when phonons alter the electronic band structure in the presence of elec-tron excitations. Also shown are illustrations of the quasiharmonic approximation and phonon-phonon interactions (PPI). Increasing width of light shading indicates increasing thermal energy spreads. From Ref. [4].
seemingly minor numerical corrections, however, can correct for when the QH model incorrectly predicts phase instabilities [7, 11–14].
We are interested in expanding our understanding of these phonon interactions, particularly at high temperatures. While we study the effects of phonon-phonon interactions in this thesis, the effect of anharmonicity on thermodynamic proper-ties is not the focal point. The remainder of this introductory chapter provides overviews of the electron-phonon and magnon-phonon interactions, which follows the organization of this thesis.
1.3 Electron-Phonon Interactions
When a phonon is excited, atoms are moved from their equilibrium positions. The effective electrostatic potential acting on an electron is changed by this atomic displacement. As a result, this electron is likely to be scattered. This scattering process can alter the electronic screening of the atom if the phonon wavelength is comparable to the electron screening length [15].
This interaction at low temperatures has been mathematically modeled through perturbation theory. As detailed by Ziman [15] and Grimvall [16], an important component of perturbation theory is the electron-phonon matrix element:
gmnν (k,q)=
s
~
2ωqν Õ
κα
eqκαν
√
mκ
hmk+q|∂qκαV|nki, (1.9)
wheremκis the nuclear mass of atomκ,eqνis the phonon displacement eigenvector,
and∂qκαV is the variation of the electronic potential with respect to displacement of
atom κin the Cartesian directionα. This matrix element describes the interaction of the phonon mode with wavevectorqand polarizationνwith the electronic states |nkiand|mk+qi.
The matrix element gmnν (k,q)is included in electron-phonon scattering rates. The
scattering rate of phonons by electron-phonon interactions derived from either the phonon self-energy [16] or Fermi’s golden rule [17, 18] is
1
τqν =
2π ~ Õ mn ∫ dk ΩBZ
gmnν (k,q)
2
(fnk− fmk+q)
×δ(εm(k+q) −εn(k) −~ωqν),
(1.10)
where fnk is the Fermi-Dirac distribution for electrons andεn(k) is the electronic
energy.
wavevectorskandk0if their wavevectors follow the condition
q= k0−k−g, (1.11)
where g is an arbitrary reciprocal lattice vector. A nonzerog describes electron-phonon Umklapp processes, which is relevant only if the electronic structure is treated with the reduced zone scheme [15].
Another takeaway from Eq. 1.10 is that the energy is conserved in the electron-phonon interaction:
ε(k0)= ε(k) ±~ωqν, (1.12) where we account for both phonon absorption and creation.
The difference (fnk − fmk+q) in Eq. 1.10 describes how an electron is scattered
from an occupied state into an unoccupied state. If we also take into consideration how phonon energies are small in scale in comparison to electron energies, we see that electron-phonon interactions involve states near the Fermi surface, a map of
k-points in the Brillouin zone (reciprocal space primitive cell) where the electronic energy equals the Fermi energy: ε≡ E−EF =0.
An electron-phonon interaction involving a phonon mode qν is particularly strong if there is a high density of electronic state pairs |nki and |mk+qi on the Fermi surface. In other words, an electron-phonon interaction involving a phonon modeqν
is strong if there are nesting features, or parallel sheets separated by one wavevector
q, on the Fermi surface. This causes an electronic screening that reduces the energy of the phonon mode qν, causing a Kohn anomaly [19]. These strong interactions can contribute to a high superconducting transition temperatureTc [20, 21] and a
high average electron-phonon coupling constantλ:
λ= N(EF) |g
ν
mn(k,q)|2 FS
mω2 , (1.13)
whereN(EF)is the electronic density of states at the Fermi energy,hh· · · iiFS is the
average over all possible combinations of electronic states on the Fermi surface, and
ω2
is the second moment of the Éliashberg coupling function [16].
0 10 20 30 40 Energy (meV)
0.00 0.02 0.04 0.06 0.08
DOS (1/meV)
10 K 300 K 773 K 1023 K 1273 K
0.5 0.0 0.5
Energy E - EF (eV)
0 1 2 3
eDOS (states/eV) 0 K1000 K(Delaire)
Figure 1.3: (Left) Phonon densities of states (DOS) of vanadium from 10 to 1273 K, as measured by Delaireet al. [10]. (Right) Electronic DOS (eDOS) of vanadium at 0 and 1000 K. The 0 K eDOS was calculated with a static density functional theory (DFT) calculation. The 1000 K eDOS was calculated from a convolution of the 0 K eDOS with a Lorentzian with a full-width-at-half-maximum (FWHM) of 380 meV [10].
thermodynamic importance of the adiabatic EPI at high temperatures had been a controversial topic [22–24].
Studies by Delaireet al. showed that the adiabatic EPI has significant effects on the high temperature thermodynamics of the A15 V3Si and V3Ge compounds and bcc vanadium. First-principles calculations for these materials showed that a thermal broadening smears the electronic DOS, reducing the number of electronic states at the Fermi level. A thermal phonon stiffening (increase in energy) opposed the expected softening (decrease in energy) from thermal expansion due to the decrease in the number of electrons available for screening, as illustrated in Fig. 1.3. The suppressed vibrational entropy and heat capacity were attributed to this interplay between electrons and phonons, which was observed at temperatures above 1000 K [10, 25].
The opposite effect was observed in a study by Delaireet al. on FeSi. The electronic DOS at the Fermi level was observed to increase with temperature as the narrow band-gap was filled in the semiconductor-to-metal transition. The anomalous ther-mal phonon softening was due to the increased electronic screening efficiency [26]. Fig. 1.4 summarizes the observed temperature-dependent interplay of electrons and phonons.
Figure 1.4: Trends in the temperature dependence of phonon energiesωon adiabatic electron-phonon interactions for different electronic densities of states N(E), as summarized by Delaire,et al. [26]. The dotted line represents quasiharmonic (QH) behavior.
by the phonon DOS and electronic DOS. We study theB2-ordered compound FeTi in Chapter 2 and revisit bcc vanadium in Chapter 3.
1.4 Magnon-Phonon Interactions
As the temperature increases through a magnetic transition temperature, the vibra-tions of atoms away from their equilibrium posivibra-tions can modify the interacvibra-tions of magnetic moments. The resulting changes in magnetic interactions between atoms can in turn alter their vibrations against each other. Magnon-phonon interactions, the exchange of energy between quanta of magnetic excitations and phonons, can be modeled with a coupling HamiltonianHmp[27]:
Hmp=Õ
k,q
φν
k,qb
†
k−qbk
a†qν−a−qν
, (1.14)
wherea†qνanda−qν are phonon creation and annihilation operators,b†k−q andbkare
Figure 1.5: (Left) The nonharmonic vibrational entropy ∆Snh from phonon DOS spectra measured by Maugeret al. compared to the magnetization of bcc Fe [29] and the magnetic vibrational entropySmag, obtained by subtractingSvibandSel[32] from the SGTE total entropy [6]. From Ref. [7]. (Right) Average Fe phonon energies of cementite from NRIXS measurements (points). The dashed lines are quasiharmonic energies from experiment (“QHγT Model”) and computation (“QH
DFT”). From Ref. [31].
Magnon-phonon interactions can have an impact on bulk properties of materials, such as the negligible thermal expansion in Invar materials [28].
The investigation of magnon-phonon interactions at elevated temperatures in this thesis was motivated by recent studies of vibrational thermodynamics impacted by thermal magnetic disorder. Maugeret al. have observed through nuclear resonant inelastic x-ray scattering (NRIXS) measurements an anomalous thermal softening of phonons in bccα-iron stronger than predicted by the QH model [7]. The strong deviation from the QH model tracked the rapid decrease in the magnetization of
α-Fe [29] and the rise in magnetic entropy, as seen in the left panel of Fig. 1.5. The second-nearest-neighbor (2NN) longitudinal force constants associated with an abnormal 2NN exchange interaction [30] were observed to soften by 40 to 60% from 30 K to the Curie temperature. The sharp increase in the vibrational entropy from the magnon-phonon interaction was reported to help extend the stability of the bcc phase of iron well past its Curie temperature.
Temperature-dependent magnon-phonon interactions have also been observed in computational studies. Körmannet al. analyzed the impact of magnetic short-range order on the lattice vibrations above the Curie temperature of α-Fe by combining the NRIXS data provided by Maugeret al. with a computational framework [33]. A more recent example is the study by Stockemet al. that replicated the abnormal temperature dependence of the thermal conductivity above the magnetic transition temperature by dynamic coupling of spin fluctuations and lattice vibrations [34].
C h a p t e r 2
THERMALLY DRIVEN ELECTRONIC TOPOLOGICAL
TRANSITION IN FETI
2.1 Main Text
An electronic topological transition (ETT), first identified by Lifshitz [35], occurs when changes to a metal cause new features to appear in the topology of the Fermi surface [36]. Structural, mechanical, and electronic properties are usually altered by an ETT, which can be induced by alloying [37–39] or pressure [40–42]. Recently a novel temperature-induced ETT has been reported to alter magnetoresistivity [43]. In this present work, we show through first-principles calculations and ancillary experiments how a thermally-driven ETT drives anomalous changes in phonon dynamics.
FeTi is a thermodynamically stable [44–46] nonmagnetic [47] intermetallic com-pound with a bcc-basedB2 structure and a melting point of approximately 1600 K. FeTi is of interest for its hydrogen absorption capabilities [48–50] and for its mechan-ical properties [51, 52]. It has been the subject of a large number of experimental and theoretical studies including inelastic neutron scattering [53, 54] and first-principles calculations [55–57]. The calculations show that FeTi has a Fermi level that lies in a pseudogap in its electronic density of states (DOS) [58–60], so thermal smearing could increase the effective density of electrons at the Fermi level.
First-principles calculations on FeTi were performed with projector augmented wave potentials [61, 62] and the generalized gradient approximation [63] of density functional theory (DFT) [64] using the VASP package [65, 66]. The electronic DOS curves at various temperatures were obtained through static calculations and constant volume ab-initio molecular dynamics (AIMD) calculations on 128-atom supercells. Convergence with respect to kinetic energy cutoffs and sampling of k
points in the Brillouin zone was checked in all cases. The calculations show that the pseudogap is present at the Fermi level in the 0 K electronic DOS, and is filled as the number of electronic states at the Fermi level increases by 218% from 0 K to 1035 K, as shown in the Supporting Information.
[000] 0.5[100] 0.5[110]
0
[000]
0.5[111]
0.5[100]
10
20
30
40
50
Phonon Energy (meV)
Γ
X
M
ΓR
X
M
50
0.1 0.2
DOS (1/meV)
[image:29.612.117.498.72.305.2]Fe partial DOS
Total DOS
Figure 2.1: Calculated FeTi phonon dispersions at temperatures from 300 to 1500 K. Also shown are phonon DOS curves for the motions of all atoms (total) and iron atoms (Fe partial).
effective potential (TDEP) method [11, 67]. The quadratic and cubic force constants were calculated from the model Hamiltonian fit to the potential energy surface at the most probable positions of atoms in an AIMD simulation:
H =U0+
Õ
i
p2i
2mi +
1 2!
Õ
i jαβ
Φi jαβuiαuβj + 1
3!
Õ
i j kαβγ
Φi j kαβγuαiuβjuγk, (2.1)
where pi is the momentum of atom i, Φi j and Φi j k are quadratic and cubic force
constants, anduαi is the Cartesian componentαof the displacement of atomi. The effects of the quartic force constants are included by renormalizing the quadratic force constants [68, 69]. The cubic force constants account for cubic anharmonicity associated with phonon-phonon interactions [70]. The thermal phonon-phonon interaction shifts∆(T)of a phonon modeqν calculated from the third-order force constants were negligible compared to the calculated phonon thermal softening from the quadratic force constants.
300
600
900
1200
1500
Temperature (K)
24
25
26
27
Phonon Energy (meV)
300 600 900
25
[image:30.612.146.469.73.350.2]26
27
Figure 2.2: Temperature dependence of the M5− phonon energy calculated from TDEP (squares). The colors of the squares are identical to those shown in Fig. 2.1. The green and blue markers are mean phonon energies obtained from Lorentizan fits to the Fe NRIXS DOS and the INS DOS, respectively. The dashed line is the thermal softening of theM5−phonon from quasiharmonicity alone. The inset shows the agreement in the slopes of the experimental and computational phonon energies without quasiharmonic contributions. For convenience in showing the slopes, the NRIXS data were offset by−0.76 meV and the INS by−0.35 meV.
shows the thermal effects from pure anharmonicity and from the adiabatic EPI. These are significantly larger than the thermal softenings from quasiharmonicity reported in the Supporting Information.
0
10
20
30
40
50
Energy (meV)
0.00
0.05
0.10
0.15
Phonon DOS (1/meV)
Fe partial DOS
Neutron-weighted DOS
300 K
523 K
[image:31.612.154.459.72.314.2]750 K
1035 K
Figure 2.3: Experimental FeTi phonon DOS curves. The neutron-weighted DOS curves were obtained from INS measurements and the Fe partial DOS curves from NRIXS measurements. Error bars are from counting statistics.
To help understand the EPI in FeTi, density functional perturbation theory [73] implemented with the QuantumESPRESSOpackage [74] was used to calculate 0 K electron-phonon linewidths
Γqν =
2π
~
Õ
mn
∫
dk ΩBZ
gmnν (k,q)
2
(fnk− fmk+q) (2.2)
×δ(εm(k+q) −εn(k) −~ωqν), (2.3)
wheregmnν (k,q)is the matrix element of an EPI involving a phonon and two elec-tronic states |nki and |mk+qi, fkm is the Fermi-Dirac distribution for electrons,
andεn(k)is the eigenenergy of an electron. The Supporting Information shows that
many of the modes that soften with temperature in Fig. 2.1 are those with strong electron-phonon coupling and large Γqν. Interestingly, these calculations showed
that theM5−mode has a negligible electron-phonon linewidth at 0 K, even though it shows the strongest thermal softening in Fig. 2.1.
(a) 523 K (b) 750 K (c) 1035 K
Γ X M Γ R X|M R 5 4 3 2 1 0 1 Energy (eV) 0.0 0.5 1.0 1.5 2.0
Number of States
(d) 523 K
Γ X M Γ R X|M R 5 4 3 2 1 0 1 Energy (eV) 0.0 0.5 1.0 1.5
Number of States
(e) 750 K
Γ X M Γ R X|M R 5 4 3 2 1 0 1 Energy (eV) 0.0 0.5 1.0
Number of States
[image:32.612.109.505.71.305.2](f) 1035 K
Figure 2.4: (a)-(c) Approximated finite-temperature Fermi surfaces in the Brillouin zone. The dark blue surfaces are the unshifted 0 K Fermi surfaces, and the lighter blue surfaces are at energies shifted from the Fermi energy by factors of 1.8kBT. (d)-(f) Finite-temperature band structures from supercell AIMD calculations, produced by BandUP. The Fermi surface and band structure at 523 K resemble those at 0 K without any broadening.
DOS curves from inelastic neutron scattering (INS) and nuclear-resonant inelastic x-ray scattering (NRIXS) shown in Fig. 2.3 emphasize phonon scattering from iron atoms (Ti is a weaker scatterer of neutrons, and Ti cannot contribute to the NRIXS spectrum). When the phonon softening from thermal expansion, obtained from quasiharmonic calculations described in the Supporting Information is removed from the experimental points, the agreement in slopes of the curves in Fig. 2.2 is excellent. The magnitudes of the phonon energies show agreement between com-putation and experiment that is better than expected. For example, the experimental peaks include contributions from phonons around the R point, which lie above 3 meV higher than the M5− mode. (Agreement at lower temperatures is not expected owing to the use of classical statistical mechanics in the AIMD calculations.)
0.5[100]
0.0
0.5[110]
[000]
0.5
1.0
1.5
2.0
Phonon Softening (meV)
TA Branch
LA Branch
X
M
Γ
0
20
40
60
80
Number of Vectors
Figure 2.5: Histogram of spanning vectors that couple the new states at one of the R symmetry points with the rest of the Fermi surface along the [ξξ0] and 12ξ0 directions at 1035 K, displayed together with the changes in energies of the TA and LA branches from 300 K to 1035 K along the same directions.
spread gave a set of Fermi levels that were used to construct the Fermi surfaces of Fig. 2.4 (a)-(c). The BandUP code [75, 76] was used to project the supercell band structures into the range of k-space for a standard B2 unit cell. Through unfolding operations [77], BandUP obtains effective primitive cell representations of the band structures of systems simulated using supercells. Results are shown in Fig. 2.4(d)-(f). (We found no noticeable differences in the band structures when thermal expansion was included, as reported previously in Ref. [57].)
Owing to a decrease in band energy from thermal atom displacements, but more to the thermal smearing of the Fermi level, electronic states at the R point that lie above the Fermi level at 0 K intersect the Fermi level at high temperatures. New topological features appear in the Fermi surface around the R symmetry points and along the M-R symmetry lines of the Brillouin zone, as shown in Figs. 2.4(a)-(c). These new features grow with increasing temperature. This is a thermally-driven electronic topological transition.
In-Figure 2.6: A view of the displacement pattern of the M5− phonon, in which Fe (orange) and Ti (blue) atoms move along the 1¯10 directions. The dashed lines are the 1nn Fe–Ti interactions, and the solid lines are the 2nn Fe–Fe interactions.
formation. The numbers of vectors obtained for 1035 K are displayed in a histogram in Fig. 2.5. This distribution overlaps well with the group of wavevectors over which the transverse acoustic (TA) and longitudinal acoustic (LA) phonon branches soften significantly around the M symmetry point. These new spanning vectors should increase screening of the corresponding phonon modes by conduction electrons, causing the large softening of phonons as seen in Fig. 2.2. The softening graphed in Fig. 2.5 was corrected for the softening expected from phonon-phonon interactions calculated by the TDEP method, as described in the Supporting Information.
It has been known for a number of years that the adiabatic EPI can alter the phonon dynamics, often making an important contribution to the free energy of a metal or alloy. A temperature dependence of the adiabatic EPI occurs when there is a substantial variation in the electronic DOS at the Fermi level, for example. A thermally-driven ETT is expected to cause more rapid and perhaps more abrupt changes with temperature. Such effects are expected in materials with occupied or unoccupied bands that are a fewkBTaway from the Fermi level at low temperatures, so these effects are expected in many systems. Shifts and broadenings of the electronic bands from atomic displacement disorder can enhance or diminish these effects.
2.2 Supporting Information
Experimental
Sample Preparation
The FeTi sample for neutron scattering measurements was synthesized by arc-melting 99.98% pure Ti and 99.97% pure Fe in the equiatomic ratio under an argon atmosphere. There was a negligible mass loss and no visible oxidation after melting. The brittle sample was crushed into a fine powder. Samples for x-ray measurements were synthesized in the same way, but were 96% enriched with57Fe. Conventional characterization was performed with x-ray diffractometry using Cu Kα radiation. All samples were found to have the B2 structure and no traces of other phases. These diffraction measurements included the determination of thermal expansion using a furnace for in situ measurements. The lattice parameters of B2 FeTi were determined to be
2.978 Å at 300 K; 2.984 Å at 523 K; 2.991 Å at 750 K.
The coefficient of linear thermal expansion was 2.9×10⁻⁵/K.
Scattering Measurements
Figure 2.7: Neutron scattering functionS(Q,E)spectrum of FeTi at 300 K.
a grazing angle to the x-ray beam and an avalanche photodiode detector (APD) was set on top of the furnace at a right angle with the beam. The energy was scanned from−90 to +90 meV around 14.413 keV, the resonant energy of 57Fe, in several scans that were combined for final analysis. The energy resolution of all NRIXS measurements was measured to be 2.2 meV (FWHM) at the elastic line. The NRIXS data were reduced using thePHOENIXcode [80].
Inelastic neutron scattering (INS) measurements were performed with the ARCS spectrometer [81] at the Spallation Neutron Source at Oak Ridge National Lab-oratory. The sample was loaded into an Al can which was then mounted in a low-background vacuum furnace for measurements at 300, 523, and 748 K. The nominal incident neutron energy was 80 meV. The energy resolution was 1.7 meV at an energy transfer of 40 meV, increasing to 3.1 meV at the elastic line (FWHM). The empty Al can was measured at all temperatures and subtracted from the mea-sured spectra of the sample. The data reduction was performed using the DANSE software [82], giving the neutron-weighted DOS curvesgNW(ε)shown in Fig.2.8. Our NRIXS and INS spectra had very similar energy resolutions over much of the phonon spectra, and this permitted direct comparisons.
0
10
20
30
40
50
Energy (meV)
0.00
0.05
0.10
0.15
0.20
0.25
0.30
Phonon DOS (1/meV)
Fe partial DOS
Neutron-weighted DOS
Ti partial DOS
Neutron-weight
corrected DOS
[image:37.612.158.452.129.574.2]300 K
523 K
750 K
1035 K
DOS" panel in Fig. 2.8, noting that
gNW(ε) '
σFe
MFe
gFe(ε)+
σTi
MTi
gTi(ε), (2.4)
where the ratios of the neutron cross section to molar mass σd/Md are 0.208 and
0.091 barns/amu for Fe and Ti, respectively. The partial Ti phonon DOSgTi(ε)was also obtained using this approach and is shown in the lower panel of Fig. 2.8.
Computational Details
Density Functional Theory
Density functional theory (DFT) calculations [64] were performed withVASP[65, 66] with projector augmented wave potentials with the Perdew-Burke-Ernzerhof (PBE) exchange-correlation functional [63] and an energy cutoff of 500 eV. The equilibrium volume of the structure was optimized to minimize the total energy. Spin-polarized calculations gave a negligible magnetic moment, in agreement with experimental results in Ref. [47].
The 0 K electronic band structure and Fermi surface were computed on the FeTi two-atom unit cell with a 80×80×80 grid ofk-points, sampled with the Monkhorst-Pack scheme [87]. The dense grid allowed for a greater sampling of phonon wavevectors which may span nesting features of the Fermi surface.
To assess the effect of thermal expansion on the phonons in FeTi, phonon dispersions shown in Fig. 2.9 were calculated under the quasiharmonic approximation using the Parlinski-Li-Kawazoe method [88] implemented in the PHONOPYcode [89]. The calculations were performed on 128-atom 4×4×4 supercells with a 6×6×6k-point mesh and a grid of atom displacements of 0.01 Å for the temperatures 0, 300, 523, 750, and 1035 K. The volumes of the supercells were calculated by minimizing the free energyF(T,V):
F(T,V)= E0(V)
+∫ dεg(ε)hε
2 + kBTln
1−e−ε/kBT i. (2.5)
[000] 0.5[100] 0.5[110]
0
[000]
0.5[111]
0.5[100]
10
20
30
40
50
Phonon Energy (meV)
Γ
X
M
Γ
R
X
M
5 [image:39.612.118.492.76.329.2]0 K
300 K
523 K
750 K
1035 K
Figure 2.9: FeTi phonon dispersions calculated in the quasiharmonic model.
Density Functional Perturbation Theory
Density functional perturbation theory calculations [73] were performed with Quan-tum ESPRESSO [74] with ultrasoft pseudopotentials [90] and the PBE exchange-correlation functional. The electron-phonon interaction matrix elements were first calculated on a 20×20×20kmesh and a 10×10×10qmesh, and later interpolated to a 60×60×60 q mesh through Fourier interpolation implemented in the pack-age. The matrix elements were then used to compute the electron-phonon linewidth plotted in Fig. 2.10. It is seen that EP linewidths of the longitudinal optical modes along theΓ-X, Γ-M, andΓ-R symmetry lines are large compared to the negligible linewidths of many other modes, such as the M5− mode.
Ab-Initio Molecular Dynamics
Ab-initio molecular dynamics (AIMD) calculations were performed using VASP with the potentials given in the DFT section on 128-atom supercells using a 2×2×2
Γ
X
M
Γ
R
X
0
10
20
30
40
50
Phonon Energy (meV)
0.0
0.1
0.2
0.3
0.4
EP
Li
ne
wi
dt
h
Γ
qν(m
eV
[image:40.612.117.494.83.306.2])
Figure 2.10: Calculated 0 K electron-phonon linewidths displayed over the 0 K FeTi phonon dispersion.
0.4
0.2
0.0
0.2
0.4
E - E
F
(eV)
0
1
2
3
4
Electronic DOS (states/ev/unit cell)
0 K
300 K
523 K
640 K
750 K
900 K
1035 K
[image:40.612.134.478.380.665.2]densities of states from 20 saved configurations using a 3× 3×3 k-point mesh. For each temperature, the BandUP code [75, 76] was performed on five of these configurations with 81 k-points along each high symmetry direction. The mean energieseεkm and smearing widths∆εkm of the bands were obtained from BandUP.
Spanning Vectors
The histogram in Fig. 5 of the main text was obtained by counting spanning vectors from one of the new topological features around the R symmetry points to the rest of the Fermi surface. The vectors were counted in the Brillouin zone defined by an 80×80× 80 grid of k-points. For each spanning vector, the conservation of momentum and energy was required:
e
εk+qn−εkm±~ωqν −ciσ ≤ ∆εk+qn, (2.6)
wherek+qnis a state on one of the new topological features around the R symmetry points, km is a state from the rest of the Fermi surface, eεk+qn is the mean energy
of the state k+qn calculated by BandUP, εkm is equal to the Fermi energy, and
~ωqν is the energy of the phonon mode with polarizationν and wavevectorq. The
smearing width∆εk+qndescribes the broadening of the electron pocket induced by
the thermal disorder of the Fe and Ti atoms at higher temperatures.
The ciσ term describes the thermal excitation of electrons, where σ = 1.8kBT is the standard deviation of the Gaussian-like thermal smearing function. Four histograms of spanning vectors were counted, one for each value ofci ∈ {13, 23,1, 43}.
[000] 0.5[100] 0.5[110]
0
[000]
0.5[111]
0.5[100]
10
20
30
40
50
Phonon Energy (meV)
Γ
X
M
Γ
R
X
M
5300 K
1500 K
300 K FC
Exchanged
(a) Fe–Fe 2nn Longitudinal
[000] 0.5[100] 0.5[110]
0
[000]
0.5[111]
0.5[100]
10
20
30
40
50
Phonon Energy (meV)
Γ
X
M
Γ
R
X
M
5300 K
1500 K
300 K FC
Exchanged
[image:42.612.136.481.116.606.2](b) Fe–Ti 1nn Transverse
C h a p t e r 3
THERMAL EVOLUTION OF ELECTRON-PHONON
INTERACTIONS IN VANADIUM
3.1 Introduction
Vanadium is a body-centered cubic (bcc) metal that displays some of the strongest electron-phonon coupling for pure elements [92]. It is a superconductor with a transition temperatureTc = 5.3 K, one of the highest critical temperatures for pure
elements [16]. Experimental and computational studies on the superconductive, electronic, and mechanical properties of vanadium at high pressures have revealed anomalies in the elastic constants and a positive relationship between the supercon-ducting transition temperature with pressure [93–96].
Elemental vanadium also displays anomalous behavior with temperature. The tem-perature dependence of the elastic constant C44 has two points of inflection at approximately 800 K and 1600 K [97]. Inelastic neutron scattering (INS) experi-ments have shown that the increase in the vibrational entropy of vanadium from thermal expansion is cancelled by nonharmonic thermal stiffening [98] attributed to an adiabatic electron-phonon interaction (EPI) broadening of the sharp features in the electronic density of states (DOS). The strength of the EPI was related to the decrease in the electronic DOS at the Fermi level [10].
Electron-phonon interactions at low temperatures have been extensively studied for almost a century. Advances over the past two decades have allowed us to calculate materials properties related to these electron-phonon interactions from first-principles [99]. These state-of-the-art methods for calculating properties from the EPI are based on density functional perturbation theory (DFPT), which does not adequately describe thermal effects observed at finite tempeartures, such as anharmonic lattice dynamics. The adiabatic EPI at high temperatures had been best understood by studying the changes in the average phonon energies and the electronic DOS [10, 25, 26]. We are only now starting to see advances in first-principles computational methods for studying finite temperature electron-phonon interactions [100].
adiabatic EPI was altered dramatically by a thermally-driven electronic topological transition (ETT), a novel Lifshitz transition [35] that had been rarely observed with temperature [43]. We suggested that a thermally-driven ETT may be observed in other materials with occupied or unoccupied electronic bands that are a few kBT from the Fermi level at low temperatures.
Delaire et al. reported that the adiabatic EPI in vanadium saturates at high tem-peratures owing to the complete smearing of a peak in the electronic DOS at the Fermi level. This was in agreement with the subsequent softening of phonons in vanadium past 1000 K. In this present work, we study the nonlinear nature of the phonon frequency shifts from the adiabatic EPI and investigate if this behavior can be attributed to a thermally-driven ETT using an extension of the computational methods employed in Chapter 2.
3.2 Computation
Phonon Calculations
Phonon frequencies at elevated temperatures were calculated with a modified tem-perature dependent effective potential (TDEP) method [11, 102, 103]. In the TDEP procedure, the Born-Oppenheimer surface of a material at a given temperature is sampled withab initiomolecular dynamics (AIMD). The energies, displacements, and forces on thermally displaced atoms are recorded over time. With these energy-force-displacement data sets, force constants are obtained with a least-squares fit of a model Hamiltonian to the potential-energy surface:
H =U0+
Õ
i
p2i
2mi +
1 2!
Õ
i jαβ
Φi jαβuiαuβj + 1
3!
Õ
i j kαβγ
Φi j kαβγuαiuβjuγk, (3.1)
where pi andui are the momentum and displacement of atomi, respectively, and
αβγ are Cartesian components. The temperature-dependentU0 is a fit parameter for the baseline of the potential energy surface [102]. The quadratic force constants
Φi j capture temperature-dependent nonharmonic effects and are used to calculate
phonon frequenciesωshifted by these effects [102]. These quadratic force constants are also renormalized by the quartic term in the potential [68, 69]. The cubic force constantsΦi j kcapture phonon-phonon interactions (PPI) that contribute to the
broadening and additional shifts of phonon modes.
ensemble. For a cell of Na atoms with massmi, a harmonic normal-mode
transfor-mation was used to generate positions{ui} consistent with a canonical ensemble:
ui =
3Na
Õ
s=1
ishAisi
p
−2 lnξ1sin(2πξ2), (3.2)
where ξn are uniformly distributed numbers between 0 and 1 producing the
Box-Muller transform. hAisi is the thermal amplitude of the normal mode s with
eigenvectorisand frequencyωs[104, 105]:
hAisi=
s
~(2ns+1)
2miωs
| {z }
quantum
≈ 1
ωs
s
kBT
mi
| {z }
classical
, (3.3)
wherens = (e~ωs/kBT −1)−1is the thermal occupation of mode s, and~ω kBT denotes the classical limit at high temperatures.
These stochastically generated thermal displacements from Eqs. 3.2 and 3.3 sam-ple the Born-Oppenheimer surface in the stochastically initialized temperature-dependent effective potential (s-TDEP) method [11, 102, 103, 106, 107]. This method approximates the inclusion of zero-point motion not included in AIMD simulations and connects seamlessly to the classical limit at high temperature. The s-TDEP procedure can be used to calculate force constants capturing anomalous high-temperature effects [106–109] to low-temperature quantum effects [110, 111] at a much lower computational cost than what is required by AIMD. The force constants calculated with this method are numerically converged with respect to the number of configurations and supercell size. The convergence of the force constants and the baselineU0 was further ensured by repeating DFT calculations on new snapshots generated from force constants from the previous iteration of s-TDEP. The force constants used to generate the supercells in the first iteration of s-TDEP were generated through a model pair potential as described in Ref. [106]. The weakness of the s-TDEP method is that it relies on Gaussian distributions of coordinates generated by Eq. 3.2.
These force constants were calculated on a grid of six temperatures,{0,300,550,750, 1250,1650} K, and six volumes. The quadratic and cubic interatomic force con-stants for temperatures and volumes between these grid points were obtained by interpolation. Through three iterations of the s-TDEP procedure, we obtained the Helmholtz free energy surfaceF(V,T):
F(V,T)=U0(V,T)+Fvib(V,T). (3.4)
U0(V,T)is the baseline from Eq. 3.1. Fvib(V,T)is from lattice vibrations:
Fvib=
∫ ∞
0
g(ω)
kBTln
1−exp
− ~ω
kBT +
~ω
2
dω, (3.5)
whereg(ω)is the phonon density of states calculated from the phonons in the first Brillouin zone,
g(ω)=Õ
s
δ(ω−ωs). (3.6)
We minimized the free energy to calculate the equilibrium volume at each temper-ature and evaluated the phonon frequencies at these conditions.
We then corrected our phonon frequencies by calculating the linewidthsΓsand shifts
∆s arising from anharmonicity, or phonon-phonon interactions. This required the
many-body perturbation calculation of the real and imaginary parts of the phonon self-energy [70, 113]Σ(Ω)= ∆(Ω)+iΓ(Ω), whereE =~Ωis a probing energy. The
imaginary componentΓ(Ω)is
Γs(Ω)= ~
π
16
Õ
s0s00
|Φss0s00|2{(ns0 +ns00 +1)δ(Ω−ωs0 −ωs00)
+(ns0−ns00) [δ(Ω−ωs0 +ωs00) −δ(Ω+ωs0−ωs00)]}
(3.7)
and the real component is obtained by a Kramers-Kronig transformation
∆(Ω)= 1
π
∫ Γ(ω)
ω−Ωdω. (3.8)
The imaginary component of the self-energy is a sum over all possible three-phonon interactions, whereΦss0s00 is the three-phonon matrix element determined from the cubic force constants Φi j k. Γ(Ω) and ∆(Ω) were calculated with a 28× 28×28
q-grid.
ganh(ω)=
Õ
s
2ωsΓs(ω)
ω2
−ω2
s −2ωs∆s(ω)
2
+4ω2sΓ2s(ω)
. (3.9)
If both∆andΓgo to zero, Eq. 3.9 reduces to Eq. 3.6.
To evaluate the effects of thermal expansion, the phonon energies predicted by the quasiharmonic (QH) approximation were calculated by interpolation of the 0 K quadratic force constants to volumes obtained from the minimization of the free energy. The QH calculations exclude the anharmonic corrections provided by Eqs. 3.7 and 3.8.
Electronic Band Unfolding
The electronic band structure of vanadium at 0 K can be calculated through a DFT calculation on a static lattice using a primitive unit cell (PC). We model finite temperatures with supercell (SC) calculations with thermally displaced atoms. The electronic bands from these calculations are folded into a smaller SC Brillouin zone (SCBZ), giving rise to complicated band structures that cannot be directly compared to 0 K electronic bands in the larger primitive cell Brillouin zone (PCBZ).
We can recover an approximation of these supercell electronic bands in the PCBZ through band unfolding [77] as implemented with the BANDUP software package [75, 76]. Details of the implementation of the band unfolding procedure are available in Refs. [75] and [76]. In brief, BANDUP is used to obtain the spectral function
A(k;ε)from supercell calculations [77, 114]
A(k, ε)=Õ
m
PmK(k)δ(ε−εm(K))
=Õ
m
Õ
n
|hmK|nki|2δ(ε−εm(K)),
(3.10)
where {k} and |nki are electron wavevectors and eigenstates in the PCBZ, and {K}and |mKi are electron wavevectors and eigenstates in the SCBZ. The spectral
weight PmK(k) is the projection of |mKion all of the PC Bloch states |nki at the
PC wavevectork. The only pairs of wavevectors (k,K) that are included in the sum in Eq. 3.10 are those in whichKunfolds ontok:
k=K+G, (3.11)
whereGis a reciprocal lattice vector in the SBCZ.