Low Cost Passive Radar Through Software Defined Radio
A dissertation submitted by
M.J. Ryan
in fulfilment of the requirements of
ENG4111 and ENG4112 Research Project
towards the degree of
Bachelor of Engineering (Honours) (Electrical & Electronic)
Passive radars utilise existing terrestrial radio signals, such as those produced by radio or television stations, to track objects within their range. This project aims to determine the suitability of low cost USB TV tuners as hardware receivers for a Software Defined Radio (SDR) based passive radar receiver. Subsequently determining its effectiveness in producing inverse synthetic aperture radar images using data collected from Digital Television signals. Since the initial identification of passive radar, Militaries the world over have been using it as a part of electronic warfare. The evolution of SDR has enabled greater access to the technologies required to implement passive radar, with the greatest limitation being the cost of the required hardware. The availability of low cost hardware was therefore investigated to determine its suitability and subsequently the availability of passive radar to a wider audience.
ENG4111/2 Research Project
Limitations of Use
The Council of the University of Southern Queensland, its Faculty of Health, Engineering & Sciences, and the staff of the University of Southern Queensland, do not accept any responsibility for the truth, accuracy or completeness of material contained within or associated with this dissertation.
Persons using all or any part of this material do so at their own risk, and not at the risk of the Council of the University of Southern Queensland, its Faculty of Health, Engineering & Sciences or the staff of the University of Southern Queensland.
This dissertation reports an educational exercise and has no purpose or validity beyond this exercise. The sole purpose of the course pair entitled “Research Project” is to contribute to the overall education within the student’s chosen degree program. This document, the associated hardware, software, drawings, and other material set out in the associated appendices should not be used for any other purpose: if they are so used, it is entirely at the risk of the user.
Dean
I certify that the ideas, designs and experimental work, results, analyses and conclusions set out in this dissertation are entirely my own effort, except where otherwise indicated and acknowledged.
I further certify that the work is original and has not been previously submitted for assessment in any other course or institution, except where specifically stated.
M.J. Ryan
I would like to acknowledge the following people:
Dr Andrew Maxwell, for his supervision and guidance;
Liam Price, for his supervision, guidance and for sponsoring this project;
Michael Gall, my friend and colleague, for his encouragement throughout the course, for being my competitor, and for helping me get to the end;
my family, friends, and colleagues, who have reviewed and critiqued my dissertation.
my parents, who have been a constant source of encouragement throughout my studies; and
my wife Amy, who is always there for me, and has supported my studies, lived with my bad moods, and has made me the person that I am today.
Abstract i
Acknowledgments iv
Contents xiii
List of Tables xiv
List of Figures xvi
List of Acronyms xxiv
List of Nomenclature xxv
List of Symbols xxvii
Chapter 1 Introduction 1
1.1 Background . . . 2
1.2 Outline of the Project . . . 3
1.3 Problem Outline . . . 4
1.5 Methodology Summary . . . 5
1.6 Project Contributions . . . 7
1.7 Consequential Effects . . . 7
1.8 Risk Assessment . . . 9
1.9 Project Timeline . . . 11
1.10 Resource Requirements . . . 13
1.11 Dissertation Outline . . . 14
1.11.1 Chapter One – Introduction . . . 14
1.11.2 Chapter Two – Literature Review . . . 14
1.11.3 Chapter Three – Methodology . . . 14
1.11.4 Chapter Four – System Design . . . 15
1.11.5 Chapter Five – Results and Discussion . . . 15
1.11.6 Chapter Six – Further Work . . . 15
1.11.7 Chapter Seven – Conclusions and Recommendations . . . 15
2.2 RADAR . . . 18
2.2.1 RADAR Topologies . . . 20
2.2.1.1 Monostatic RADAR . . . 21
2.2.1.2 Bistatic RADAR . . . 21
2.2.1.3 Multistatic RADAR . . . 22
2.2.2 RADAR Propagation Methods . . . 23
2.2.2.1 Continuous Wave RADAR . . . 23
2.2.2.2 Frequency Modulated Continuous Wave RADAR . . . 26
2.2.2.3 Synthetic Aperture RADAR . . . 27
2.2.2.4 Inverse Synthetic Aperture RADAR . . . 29
2.2.3 Passive Bistatic RADAR . . . 30
2.2.4 The Complex Ambiguity Function . . . 37
2.3 Terrestrial Digital Video Broadcast (DVB-T) . . . 39
2.4 Software Defined Radio . . . 41
2.4.1 Software Defined Radio Software . . . 44
2.4.1.1 SDR# Software . . . 45
2.4.1.2 GQRX . . . 45
2.4.1.4 GNU Radio . . . 46
2.4.2 Software Defined Radio Hardware . . . 46
2.4.2.1 Ettus Research USRP Devices . . . 47
2.4.2.2 Great Scott Gadgets HackRF . . . 49
2.4.2.3 Nuand BladeRF . . . 50
2.4.2.4 RTL-SDR TV Tuners . . . 52
2.4.3 Coherent Clock Hardware . . . 55
2.4.3.1 Passive Clock Sharing . . . 56
2.4.3.2 Texas Instruments CDCLVC1310-EVM Evaluation Board 57 2.4.3.3 Arduino Based Si5351a Voltage Controlled Oscillator . . 58
2.5 Literature Review . . . 59
2.5.1 Frequency Modulated Continuous Wave Passive RADAR . . . 60
2.5.2 Orthogonal Frequency Division Multiplexed Passive RADAR . . . 61
2.5.3 RTL2832U based Passive RADAR . . . 63
2.5.4 Chapter Summary . . . 65
3.2 Hardware . . . 70
3.2.1 Bistatic Passive RADAR Receiver Device Configuration . . . 71
3.2.2 External Timing Signal . . . 71
3.2.3 Reference Receiver . . . 72
3.2.4 Continuous Wave Generator . . . 73
3.3 Software . . . 73
3.4 Testing . . . 74
3.4.1 Internal Timing Clock Examination . . . 74
3.4.2 External Timing Clock Verification . . . 75
3.4.3 RTL-SDR Dongle Testing . . . 75
3.4.4 RTL-SDR Dongle Calibration . . . 76
3.4.5 Passive RADAR Data Collection . . . 77
3.5 Chapter Summary . . . 78
Chapter 4 System Design 79 4.1 Introduction . . . 80
4.2 System Model . . . 80
4.3 System Design Flow Chart . . . 82
4.5 RTL-SDR USB Dongle Modification . . . 88
4.6 Completed Hardware Device . . . 92
4.7 RADAR Data Collection Antennas . . . 93
4.8 RADAR Reference Receiver . . . 96
4.9 Continuous Wave Testing Hardware . . . 100
4.10 RTL-SDR Receiver Calibration . . . 106
4.11 Doppler Signal Software Verification . . . 106
4.12 Coherent RTL-SDR Data Acquisition . . . 107
4.13 Continuous Wave RADAR Test Data Generation . . . 109
4.14 Passive RADAR Data Collection: Location Identification . . . 110
4.15 Passive RADAR Data Collection . . . 111
4.16 Data Windowing MATLAB Program . . . 112
4.17 Chapter Summary . . . 113
Chapter 5 Results and Discussion 114 5.1 Introduction . . . 115
5.2 External Test Equipment . . . 115
5.3 Internal Clock Testing . . . 116
5.5 RTL-SDR Dongle Validation Testing . . . 120
5.6 Radio Receiver Internal Noise Testing . . . 123
5.7 Radio Receiver Band Scan . . . 127
5.8 Continuous Wave RADAR Test Software Evaluation . . . 131
5.9 Continuous Wave RADAR Test Hardware Evaluation . . . 133
5.10 Passive Bistatic RADAR Data Collection - Location Overview . . . 136
5.11 Passive Bistatic RADAR Data Collection - FM Radio Transmitter . . . . 142
5.12 Passive Bistatic RADAR Data Collection - DAB+ Radio Transmitter . . 147
5.13 Passive Bistatic RADAR Data Collection - DVB-T TV Transmitter . . . 149
5.14 Discussion . . . 151
5.15 Chapter Summary . . . 156
Chapter 6 Further Work 157 6.1 Introduction . . . 158
6.2 Identification of Alternative Data Collection Locations . . . 158
6.3 Modification to Achieve Consistent Results from FM and DAB+ . . . 158
6.4 Confirm the Results Achieved With an Alternative Hardware Receiver . . 159
6.5 Implement Software Improvements to Reduce Processing Delay . . . 159
6.7 Add Additional Receivers to Provide Direction Data . . . 160
Chapter 7 Conclusions and Recommendations 161
7.1 Conclusions and Recommendations . . . 162
References 165
Appendix A Project Specification 175
Appendix B Risk Assessment 177
Appendix C Project Timeline 185
Appendix D Project Resources 187
Appendix E Freetronics Arduino Compatible Leostick Device Schematic 191
Appendix F Timing Source Generator Source Code 193
Appendix G Arduino Uno Device Schematic 196
Appendix H Continuous Wave Transmitter Source Code 198
Appendix I Doppler Radar Software Verification Flowgraph 200
Appendix K Complex Ambiguity Function Peak Value Calculation MATLAB
Function 204
Appendix L Complex Ambiguity Function Peak Value Plotting MATLAB
Func-tion 209
Appendix M GNU Radio Complex Binary Data Reading MATLAB Function 214
Appendix N Passive Bistatic Radar Data Windowing MATLAB Program 217
1.1 Resource Allocation: Project Time. . . 12
2.1 Area and Range calculation for the four constantSN Rcases (Willis & Griffiths 2007). 35 2.2 Transmitters of Opportunity Signal Characteristics. . . 37
2.3 USRP N200 Specifications (Ettus Research 2016b). . . 48
2.4 HackRF One Specifications (Great Scott Gadgets 2016). . . 50
2.5 BladeRF Specifications (Nuand 2016). . . 52
2.6 RTL-SDR Tuner Ranges (Osmocom 2016). . . 53
2.7 RTL-SDR Specifications (Osmocom 2016). . . 54
4.1 Si5351 VCO Breakout Board to Freetronics Leostick Interconnections. . . 86
4.2 Passive Bistatic RADAR Receive Antenna Characteristics. . . 95
4.3 433 MHz Transmitter Board to Arduino Uno Interconnections. . . 104
5.1 Data Collection Location DVB-T Frequency Availability Data. . . 138
5.2 Data Collection Location: Visible Transmitter Sites. . . 139
D.2 SDR Verification Testing Resource Costing. . . 190
D.3 WHS Resource Costing. . . 190
2.1 Simplified monostatic RADAR topology (Anker 2016). . . 21
2.2 Simplified bistatic RADAR topology (Anker 2016). . . 22
2.3 Simplified multistatic RADAR topology (Liu, Li & Himed 2014). . . 23
2.4 Continuous Wave RADAR Block Diagram (Whisky 2012). . . 24
2.5 Spotlight SAR Collection Mode (Gutierrez del Arroyo 2012). . . 27
2.6 Comparison between (a) ISAR and (b) SAR techniques (Faulconbridge 2002). . . 29
2.7 Passive Bistatic RADAR Functional Diagram. . . 31
2.8 Two-dimensional bistatic RADAR geometry (Gutierrez del Arroyo 2012). 32 2.9 Three bistatic geometry cases: bistatic (left), psuedomonostatic (centre), andforward scatter (right). (Gutierrez del Arroyo 2012). . . 34
2.10 Normalised bistatic RADAR range and coverage areas. L/Rm = 0 (left), L/Rm = 1 (right) (Gutierrez del Arroyo 2012). . . 36
2.11 Normalised bistatic RADAR range and coverage areas. L/Rm = 2 (left), L/Rm = 3 (right) (Gutierrez del Arroyo 2012). . . 36
2.14 Great Scott Gadgets HackRF (Great Scott Gadgets 2016). . . 49
2.15 Nuand BladeRF (Nuand 2016). . . 51
2.16 Typical RTL2832U Based TV Tuner. . . 54
2.17 RTL-SDR Clock Configuration (Superkuh 2016). . . 55
2.18 Two RTL-SDR Dongles sharing a single clock source (Salsburg 2015). . . 57
2.19 Texas Instruments CDCLVC1310 Evaluation Module (Texas Instruments 2016). 58 2.20 Texas Instruments CDCLVC1310 Evaluation Module (Adafruit 2016). . . 59
2.21 Range Resolution of FM Modulated Audio Signals (Franklin 2010). . . 61
3.1 Proposed Hardware Block Diagram of SDR Passive RADAR Implemen-tation. . . 70
4.1 Low Cost Passive Bistatic RADAR System Requirements. . . 81
4.2 Low Cost Passive Bistatic RADAR System Design Flow Chart. . . 83
4.3 Freetronics Arduino Compatible Leostick (Oxer & Alexander 2011). . . . 84
4.4 Freetronics Leostick Prototyping Board (Oxer & Alexander 2011). . . 85
4.5 Top View of Si5351 VCO Mounted to Freetronics Leostick Prototyping Board. . . 85
4.7 Assembled External Timing Source Generator. . . 87
4.8 Unmodified RTL-SDR USB TV Tuner Dongle. . . 89
4.9 RTL-SDR USB TV Tuner Dongle Stripped of Excess Componentry. . . . 90
4.10 RTL-SDR USB TV Tuner Dongle Showing PCB Modification for Edge-Launch SMA Connector. . . 91
4.11 RTL-SDR USB TV Tuner Dongle Showing All Necessary Modification Completed. . . 92
4.12 RTL-SDR USB TV Tuner Dongle Showing All Necessary Modification Completed. . . 93
4.13 Quarter Wave Dipole Antenna Supplied with RTL-SDR Dongle. . . 94
4.14 Configured 32 Element Log Periodic Receive Antenna. . . 95
4.15 RADAR Reference Data RTL1090 Data Acquisition Receiver. . . 97
4.16 RADAR Reference Data from Virtual Radar Server in Google Chrome. . 98
4.17 1090 MHz Spider Beam Antenna Arrangement. . . 99
4.18 Configured RADAR Reference Receiver Antenna. . . 100
4.19 Freetronics Uno Prototyping Board (Oxer & Alexander 2011). . . 102
4.20 Top View of 433MHz Transmitter Mounted to Freetronics Uno Prototyp-ing Board. . . 102
4.22 433 MHz OOK RF Transmitter Circuit for Arduino Interfaces. . . 104
4.23 Configured Arduino Uno Continuous Wave Testing Hardware Device. . . 105
4.24 Multi-RTL Out of Tree Module Receiver Correlation Process (Krysik 2016).109 5.1 RTL-SDR Internal Clock Stability Test Configuration. . . 116
5.2 RTL-SDR Internal Clock Stability Over One Hour. . . 117
5.3 RTL-SDR Internal Clock Waveform Geometry. . . 117
5.4 Si5351 Breakout Board Clock Stability Over One Hour. . . 119
5.5 Si5351 Breakout Board Clock Waveform Geometry. . . 119
5.6 Modified RTL-SDR Dongle Validation Testing Configuration. . . 121
5.7 Modified RTL-SDR Dongle Number One Validation Test. . . 122
5.8 Modified RTL-SDR Dongle Number Two Validation Test. . . 122
5.9 Modified RTL-SDR Dongle Number Three Validation Test. . . 123
5.10 Modified RTL-SDR Dongle Internal Noise Figure Testing Configuration. . 124
5.11 Modified RTL-SDR Dongle Internal Noise Figure: Dongle One. . . 125
5.12 Modified RTL-SDR Dongle Internal Noise Figure: Dongle Two. . . 125
5.13 Modified RTL-SDR Dongle Internal Noise Figure: Dongle Three. . . 126
5.14 Radio Frequency Spectrum Band II Scan Waterfall Diagram. . . 128
5.16 Radio Frequency Spectrum Band III Scan Waterfall Diagram. . . 129
5.17 Radio Frequency Spectrum Band III Scan Relative Power (dB) Diagram. 129
5.18 Radio Frequency Spectrum Band IV Scan Waterfall Diagram. . . 130
5.19 Radio Frequency Spectrum Band IV Scan Relative Power (dB) Diagram. 130
5.20 Software Implementation Evaluation Autocorrelation Reference Plot. . . . 132
5.21 Software Implementation Evaluation Doppler Shift Plot. . . 132
5.22 Software Implementation Evaluation Reference Display Data. . . 133
5.23 Software Implementation Evaluation Autocorrelation Reference Plot. . . . 135
5.24 Software Implementation Evaluation Doppler Shift Plot. . . 135
5.25 Passive Bistatic RADAR Data Collection Equipment Configuration. . . . 137
5.26 Passive Bistatic RADAR Data Collection Antenna Configuration. . . 137
5.27 Passive Bistatic RADAR Data Collection Geography. . . 140
5.28 Graphical Representation of the Weather Conditions Under Which Data was Acquired. . . 141
5.29 RADAR Reference Receiver Target Identification for FM Radio Data Ac-quisition at 1 Msps, Showing the Target (Red Circle) and Trajectory (Blue Line). . . 143
5.31 Passive Bistatic RADAR Complex Ambiguity Function Target Identifica-tion Result for FM Input at 1 Msps With Target VariaIdentifica-tion. . . 145
5.32 RADAR Reference Receiver Target Identification for FM Radio Data Ac-quisition at 2 Msps, Showing the Target (Red Circle) and Trajectory (Blue Line). . . 146
5.33 Passive Bistatic RADAR Complex Ambiguity Function Target Identifica-tion Result for FM Input at 2 Msps. . . 147
5.34 RADAR Reference Receiver Target Identification for DAB+ Radio Data Acquisition, Showing the Target (Red Circle) and Trajectory (Blue Line). 148
5.35 Passive Bistatic RADAR Complex Ambiguity Function Target Identifica-tion Result for DAB+ Input. . . 149
5.36 RADAR Reference Receiver Target Identification for DVB-T Television Data Acquisition, Showing the Target (Red Circle) and Trajectory (Blue Line). . . 150
ADC Analogue to Digital Converter.
ADS-B Automatic Dependent Surveillance - Broadcast.
ARPANSA Australian Radiation Protection and Nuclear Safety Agency. ASK Amplitude Shift Keying.
BPSK Binary Phase Shift Keying.
COTS Commercial Off The Shelf. CPI Coherent Processing Interval. CW Continuous Wave.
DAB+ Digital Audio Broadcast Plus - Revised format specification. DAC Digital to Analogue Converter.
DSO Digital Storage Oscilloscope. DSP Digital Signal Processing.
DVB-T Digital Video Broadcast - Terrestrial.
EW Electronic Warfare.
FFT Fast Fourier Transform. FM Frequency Modulated.
FMCW Frequency Modulated Continuous Wave.
GPS Global Positioning System.
I In-Phase.
IC Integrated Circuit.
IEEE Institute of Electrical and Electronic Engineers. ISAPBR Inverse Synthetic Aperture Passive Bistatic RADAR. ISAR Inverse Synthetic Aperture RADAR.
ISM Industrial, Scientific and Medical Radio Frequency Band.
MIMO Multiple Input - Multiple Output. MOTS Military Off The Shelf.
MPC Multi-Carrier Phase-Coded.
OFDM Orthogonal Frequency Division Multiplexing. OOK On-Off Keying.
PBR Passive Bistatic RADAR. PC Personal Computer.
PISAR Passive Inverse Synthetic Aperture RADAR. PLL Phase Locked Loop.
Q Quadrature.
QAM Quadrature Amplitude Modulation. QPSK Quadrature Phase Shift Keying.
RADAR RAdio Detection And Ranging. RCS RADAR Cross Sectionm2. RF Radio Frequency.
RoHS Reduction of Hazardous Substances.
SDR Software Defined Radio. SNR Signal to Noise Ratio.
TCXO Temperature Controlled Crystal Oscillator. TV Television.
UMTS Universal Mobile Telecommunications System. USB Universal Serial Bus.
USRP Universal Software Radio Peripheral.
cm2 Centimetre Squared (unit of area). dB Decibels.
GHz Gigahertz. Hz Hertz. kHz Kilohertz. km Kilometre. M Metres.
m/s Metre per Second. mA Milli-Ampere. MB Megabyte.
Mbps Mega Bits per Second. MHz Megahertz.
mm Millimetres.
Msps Million Samples per Second. mW milli-Watt.
(S/N)min SNR Required for Detection.
Bn Noise Bandwidth.
C Speed of Light in a Vacuum.
FR Pattern Propagation Factor (Target to Receiver).
FT Pattern Propagation Factor (Transmitter to Target).
Fn Receiver Noise Figure.
GR Receiver Antenna Gain.
GT Transmitter Antenna Gain.
G Antenna Gain.
K Kelvin.
LR Receiver Losses.
LT Transmitter Losses.
Lsp Signal Processing Losses.
PT Transmitter Average Power.
RM Maximum Range.
RR Target to Receiver Range.
RT Transmitter to Target Range.
R Range.
Smin Minimum Detectable Signal.
Ti Receiver Input Noise Temperature (K).
V Velocity.
∆f Frequency Deviation Present in Modulation Method (Hertz).
λ Wavelength (m).
ρ Power Utilisation Factor.
σB Bistatic RADAR Cross Section m2.
fb Beat Frequency.
fc Centre Frequency.
fm Rate of Modulation in FMCW Signal.
k Boltzman’s Constant (1.38×10⁻²³J ·K−1).
1
Introduction
This chapter provides an overview and background of the dissertation topic, an outline of
the objectives of the dissertation, summarising the methodology used to achieve them, a
summary of the implications resulting from the outcome of the dissertation, and provides
1.1
Background
The concept of RAdio Detection And Ranging (RADAR) was first proposed by Heinrich Hertz in the late 19th century and developed over the following decades, with eight nations independently developing their own variations between 1934 and 1939. This initial RADAR development and implementation was achieved using a classic Monostatic RADAR configuration. In the mid 1930’s the United Kingdom conducted what has become known as the Daventry experiment (Kuschel & O’Hagan n.d.), this experiment proved that a passive or bistatic RADAR was possible, whereby the transmitter and receiver are not co-located.
Following this implementation Passive Bistatic RADAR (PBR) became part of a stan-dard military Electronic Warfare (EW) suite. Military Off The Shelf (MOTS) imple-mentations of PBR are now available from a number of the larger military component manufacturers, these include the Thales Homeland Alerter 100 (Group 2010) and Lock-heed Martin Silent Sentry (Freeman 2007) RADARs.
Whilst Military implementations of PBR have long become a part of a standard EW suite, there are no viable Commercial Off The Shelf (COTS) solutions available to the average user. This hole in the market has been filled by ad-hoc implementations of PBR utilising alternative platforms. The most relevant platform for implementation is Software Defined Radio (SDR), whereby a relatively simplistic hardware receiver is used to provide the In-Phase (I) and Quadrature (Q) signals to a computer for filtering, processing and digestion. Each of the subsequent receiver and demodulation stages undertaken in SDR would have traditionally been implemented through hardware stages and provided to a user interface.
than a MOTS solution, is still priced beyond what could be considered reasonable to the average enthusiast, and hence, not low cost. This changed when Antti Palosaari (Cass 2013) identified that the Realtek RTL2832U chipset based Personal Computer (PC) Television (TV) Tuners were capable of receiving well beyond the range required of a TV tuner and could commonly receive within a range of 24 MHz to 1.7 GHz. Following this discovery, Osmocom, a project group for open source mobile communications with a focus on developing software tools and implementing mobile communications standards, developed an alternative set of drivers which were able to feed the I and Q signals to software developed to decode the radio signals.
This project investigated the suitability of Realtek RTL2832U based USB TV receivers as a hardware interface to a SDR PBR and determined whether inverse synthetic aperture RADAR was plausible with the hardware.
1.2
Outline of the Project
1.3
Problem Outline
This dissertation aims to determine the suitability of a low cost software defined ra-dio receiver based upon the Realtek RTL2832U chipset as an interface for an Inverse Synthetic Aperture Passive Bistatic RADAR (ISAPBR).
Testing and evaluation determined a suitable configuration of the hardware receiver, from which a software interface was then developed. The combined hardware and software platforms were tested in both controlled and uncontrolled environments to determine their overall suitability as a viable solution to the problem.
1.4
Research Objectives
The research objectives of this dissertation are derived from the project specification presented in Appendix A.
• Researching bistatic passive RADAR systems and their implementation through
software defined radio, the use of Digital Video Broadcast - Terrestrial (DVB-T) broadcast signals to produce an Inverse Synthetic Aperture RADAR (ISAR) output, and use of the Realtek RTL2832u TV tuner as an SDR receiver.
• Development of a suitable test hardware circuit to evaluate the suitability of the RTL28322u receiver for ISAR PBR.
• Development and integration of a software solution to interface the receiver
• Testing the circuit and software in a controlled and real world environment, making
use of known reference signals to evaluate the performance of the hardware and software in controlled conditions, then validating the circuit with commercial radio sources. The results from each test was evaluated and critically analysed.
• Evaluate the suitability of the Realtek R2832u as the hardware receiver in a Passive
Inverse Synthetic Aperture RADAR (PISAR).
The dissertation has the capacity for expansion based upon the available time and re-sources to include:
• Identification and implementation of improvements in the circuitry and software to increase the reliability and functionality of the RADAR display.
1.5
Methodology Summary
there-fore it was determined that further research and testing was required to determine its functionality within this space.
Continuous wave, Frequency Modulated Continuous Wave, and Synthetic Aperture RADAR properties were investigated to determine the most useful type of passive bistatic RADAR. It is necessary to understand the different RADAR definitions, their interactions and subsequently their applications in order to determine the usability of each configuration based on the hardware available. For this research, the configuration of interest focussed on RTL2832U based dongles.
The required hardware design modifications of a RTL-SDR dongle were investigated and tested to optimise the hardware operation for the lowest cost. Once the basic opera-tion of the hardware was confirmed, a Passive Bistatic RADAR (PBR) consisting of a transmitter and receiver that arenotco-located, was simulated with a doppler RADAR configuration to ensure the hardware function was suitable. Subsequent testing was then carried out with a frequency modulated continuous wave, and then two Orthogonal Fre-quency Division Multiplexing (OFDM) waves, being that of a Digital Audio Broadcast Plus - Revised format specification (DAB+) radio station, and a Television Broadcast (DVB-T) signal. The results of these tests were evaluated in relation to the:
• suitability of RTL2832U based TV Tuners as PBR receivers;
• suitability of the integrated software platform for producing a RADAR display;
• the functionality of the hardware in a simulated environment;
• the functionality of the hardware using a non-cooperative transmitter; and
1.6
Project Contributions
There are numerous journal articles outlining the use of software defined radio as a method of receiving and producing a passive bistatic RADAR across all RADAR types. Whilst there is anecdotal evidence to support the use of RTL-SDR hardware as a RADAR, there were no published journals located supporting this hypothesis. This research aimed to determine the suitability of RTL-SDR hardware in producing a PBR and the subsequent application as a hardware receiver for an inverse synthetic aperture RADAR.
1.7
Consequential Effects
Historically, access to RADAR has required substantial and expensive hardware, this has meant that access to the technology has only been viable to those with a sufficient budget. The introduction of software defined radio lessened the cost burden, but still placed it substantially out of reach of a self funded researcher or enthusiast. The discovery of the capabilities of RTL-SDR hardware has further opened access to those with a lower budget. The finding of this research aim to identify the suitability of the RTL-SDR platform as a passive bistatic RADAR receiver and ultimately whether RADAR can now be investigated by almost anyone.
Low cost RADAR does, however, have a great number of positive implementations cov-ering a range of military, law enforcement, research, and meteorological uses. Where any existing implementation would require expensive hardware, or a monostatic configura-tion with licensed transmitters, and an ongoing financial outlay, RTL-SDR based passive RADAR implementations of these same systems, making use of existing transmitters of opportunity, are a substantially lower cost to implement and maintain.
Military applications of PBR include detection of low probability of intercept signals, being signals that are not conducive to interpretation by conventional RADAR, at con-ventional RADAR frequencies. Low cost passive bistatic RADAR is also capable of detecting stealth targets. This occurs as the stealth technology implemented is designed to deflect specific frequency ranges, hence, using transmitters of opportunity, operating outside of conventional RADAR frequencies, the stealth targets are no longer invisible to RADAR, and become identifiable and trackable.
Passive RADAR also has implementations in the traffic management of aircraft, motor vehicles and people. It can be used to implement air traffic control, for vehicle monitoring in areas of suitable geography, and for border management. With many roads and airports managed by local government bodies, not larger state or federal bodies, the use of passive RADAR receivers significantly reduces the cost borne by the organisation requiring them. The ability to collect this type of data from low cost RTL-SDR based receivers further reduces the cost to organisations.
Dependent upon the intended target for identification by passive bistatic RADAR, public perception and public safety can create problems for the equipment operator. Due to security fears, a large antenna configuration directed at aircraft would raise concerns and attract attention from law enforcement. As a result of this, any passive bistatic RADAR configuration must consider the receiver location requirements, and more so for those seeking to implement RTL-SDR based passive bistatic RADAR for their own knowledge enrichment.
1.8
Risk Assessment
To ensure that the research and experimentation undertaken within this project were safe and appropriate for all involved, it was necessary to identify and manage any and all hazards. Appendix B identifies all of the hazards associated with this project and outlines their subsequent risk management strategy.
Of the hazards identified in Appendix B, there were four (4) with a high risk after additional controls were implemented. The four high risk activities were identified as Soldering whilst making modifications to electronic hardware, Radio Frequency radiation emitted whilst conducting controlled testing, operation of testing equipment in public spaces, and transporting the hardware to a suitable data collection location in a vehicle. These hazards have been outlined below to ensure the associated risk is understood, and an action plan is in place which must be continuously reviewed.
risks associated with soldering is to work in a well ventilated environment, making use of an extraction fan if necessary. The risk of lead poisoning from solder can be managed by ensuring that after contact with solder, hands are washed before placing them near the face or mouth, and before ingesting any food.
Radio Frequency radiation can cause burns and internal injuries if a person is exposed to a sufficient power level, or for enough time. Australian Radiation Protection and Nuclear Safety Agency (ARPANSA) has identified that for occupational use in the range of 3 kHz to 300 GHz exposure to electromagnetic radiation should not exceed 10 mW/cm2 (Australian Radiation Protection and Nuclear Saftey Agency 2002, Stan-dards Australia 1998). The United States Federal Communications Commission Part 15 defines that unlicensed wireless equipment operating within the Industrial, Scientific and Medical Radio Frequency Band (ISM) band, within which all testing conducted for this project took place, must not exceed a maximum transmitter power of 30 dBm (1 Watt) (Federal Communications Commission n.d.). By ensuring that all tests were com-pleted using equipment licensed in the ISM band and by using a field strength meter to periodically test the output power of a transmitter, the risk of radio frequency radiation can be reduced.
Operation of the testing equipment comprised of three (3) antennas, and a number of laptops for data processing. Undertaking testing of this nature in a public space presented a problem in terms of public perception. Due to heightened security fears and a constant terrorism threat, it was anticipated that any testing whereby antennas were pointed at aircraft for data collection would result unnecessary concern for the public, and the potential of police intervention. This risk was managed by ensuring all testing was to be undertaken on private property, with the express permission of the property owner, or manager.
managed by abiding by all road rules, and ensuring that the driver has undertaken training additional to the standard requirement for a license, such as advanced driver training courses.
1.9
Project Timeline
Project Timeline
Task Start Date Time (Days) End Date
Realtek RTL2832u SDR Receivers 01 Jan 21 29 Jan Passive RADAR in Software Defined Radio 01 Feb 44 31 Mar Digital Video Broadcasts for the
implemen-tation of Passive RADAR
25 Mar 25 29 Apr
Project Specification 01 Mar 12 16 Mar
Project Perparedness 01 Mar 12 16 Mar
Project Resources 01 Mar 12 16 Mar
Preliminary Report 01 Apr 38 25 May
Develop Test Circuit 20 Mar 14 7 Apr
Develop and Integrate Software 07 Apr 47 13 June Verification and Validation of Test Results 13 June 20 11 July Evaluation of Device Suitability 11 July 10 25 July
Dissertation Development 01 Apr 87 01 Aug
Dissertation Review 01 Aug 45 30 Sep
[image:40.612.88.510.81.439.2]Dissertation Completion 30 Sep 6 7 Oct
1.10
Resource Requirements
There are a number of resources required to undertake the project. The resource re-quirements have been categorised and tabulated into the following categories presented in Appendix D:
• Low Cost Passive SDR Hardware Resource Costing (Table D.1);
• SDR Verification Testing Resource Costing (Table D.2);
• WHS Resource Costing (Table D.3); and
• Calibrated Test Equipment (Table D.4).
1.11
Dissertation Outline
An overview of each subsequent chapter of the dissertation is provided below.
1.11.1 Chapter One – Introduction
This chapter provided an overview and background of the dissertation topic, an outline of the objectives of the dissertation, summarising the methodology used to achieve them, a summary of the implications resulting from the outcome of the dissertation, and provided a brief introduction to the subsequent chapters.
1.11.2 Chapter Two – Literature Review
This chapter provides a comprehensive literature review on passive bistatic RADAR systems, the implementation of PBR through software defined radio, the suitability of DVB-T signals to produce the requisite OFDM encoded Radio Frequency (RF) signal in order to generate an ISAR, and Realtek RTL2832U chipset based SDR receivers.
1.11.3 Chapter Three – Methodology
1.11.4 Chapter Four – System Design
This chapter presents the hardware design requirements, components and process re-quired to implement Realtek RTL2832U chipset based devices as PBR receivers in order to achieve the objectives of the project specification.
1.11.5 Chapter Five – Results and Discussion
This chapter presents the results of the hardware analysis in testing the SDR devices under controlled conditions to determine their suitability as a PBR receiver, the results of a controlled RADAR implementation, and the results of field testing, making use of existing terrestrial transmitter sources.
1.11.6 Chapter Six – Further Work
This chapter presents a compendium of research options available to expand the subject research and further develop Realtek RTL2832U chipset based devices as PBR receivers.
1.11.7 Chapter Seven – Conclusions and Recommendations
2
Background Literature
This chapter provides a comprehensive literature review on passive bistatic RADAR
sys-tems, the implementation of Passive Bistatic RADAR (PBR) through software defined
radio, the suitability of Digital Video Broadcast - Terrestrial (DVB-T) signals to produce
the requisite Orthogonal Frequency Division Multiplexing (OFDM) encoded Radio
Fre-quency (RF) signal in order to generate an Inverse Synthetic Aperture RADAR (ISAR),
2.1
Introduction
To undertake any further research on passive bistatic RADAR, its implementation through the use of Digital Television Signals, and the suitability of RTl2832U chipset based devices as a receiver, it is first necessary to undertake a review of existing literature on the topics.
2.2
RADAR
RADAR is characteristically described by the RADAR range equation. The RADAR range equation relates a number of performance aspects of the RADAR system to other components and their characteristics including:
• transmitted power;
• minimum detectable signal strength;
• gain; and
• RADAR Cross Sectionm2 (RCS).
The equation contrasts the different elements that comprise a RADAR and identifies any compromises that may be made in order to design a functional system. The characteristic RADAR range equation was defined by Faulconbridge (2002) as:
RM =
"
PT ×G2×λ2×σ
(4π)3×S
min
#14
(2.1)
where:
PT Transmitter Average Power
G Antenna Gain
λ Wavelength (Metres)
σ Target Cross Section (m2)
Smin Minimum Detectable Signal
further, the minimum detectable signal is calculated as:
where:
k Boltzman’s Constant (1.38×10⁻²³J ·K−1)
Ti Receiver Input Noise Temperature (K)
Bn Noise Bandwidth
Fn Receiver Noise Figure
(S/N)min SNR Required for Detection
Finally, the noise bandwidth is defined as:
Bn=
1
τ (2.3)
where τ is the pulse width of an impulse RADAR. The relationship between the coeffi-cients of the Monostatic RADAR ranging equation and the PBR ranging equation will be explored in subsequent Chapters of the research.
2.2.1 RADAR Topologies
2.2.1.1 Monostatic RADAR
[image:49.612.204.396.291.494.2]The term “Monostatic RADAR” is used to describe the most common type of RADAR in which the transmitter and receiver are co-located, with elements of the transmitter and receiver hardware being shared. A simplified topology of monostatic RADAR is shown in Figure 2.1. Whilst not the subject topology of this dissertation, as the initially developed and most widely utilised topology, many concepts and definitions are derivative of the monostatic RADAR concepts.
Figure 2.1: Simplified monostatic RADAR topology (Anker 2016).
2.2.1.2 Bistatic RADAR
equal to that of the expected target difference, however this does not apply exclusively. There are a number of benefits afforded to a bistatic RADAR configuration that are not available with a monostatic configuration. these include, but are not limited to:
• no requirement for a transmitter;
• a receiver location away from the transmitter;
• no radio signature produced when interrogating targets; and
• the ability to use low cost receivers with existing terrestrial transmitters.
A simplified topology of a bistatic RADAR is shown in Figure 2.2.
Figure 2.2: Simplified bistatic RADAR topology (Anker 2016).
2.2.1.3 Multistatic RADAR
-Multiple Output (MIMO) RADAR which is the use of multiple transmitter and receiver sites. The definition of multistatic RADAR is included for completeness, however this dissertation will not expand to cover the multistatic RADAR. A topology diagram is included in Figure 2.3.
Figure 2.3: Simplified multistatic RADAR topology (Liu et al. 2014).
2.2.2 RADAR Propagation Methods
There are three (3) primary ways in which a radio wave can be transmitted and subse-quently used to produce a RADAR image. These are; Continuous Wave (CW) RADAR, Impulse RADAR, and Frequency Modulated Continuous Wave (FMCW) RADAR.
2.2.2.1 Continuous Wave RADAR
contin-uous wave RADAR by the term contincontin-uous wave RADAR. An unmodulated contincontin-uous wave RADAR is reliant upon a signal of the general form shown in equation 2.4 or the equivalent equations for triangular or square generated waveforms.
y(t) =Asin(2πf t + ϕ) (2.4) where A is the amplitude, f is the angular frequency of the wave and ϕ is the phase. Figure 2.4 shows the basic block layout of a continuous wave RADAR.
Figure 2.4: Continuous Wave RADAR Block Diagram (Whisky 2012).
In its simplest form unmodulated continuous wave RADAR return frequencies are shifted away from the transmitter frequency based on the Doppler effect. An unmodulated con-tinuous wave RADAR is only functional with moving objects and is capable of determin-ing the velocity at which the target is arrivdetermin-ing toward or departdetermin-ing from the RADAR. An unmodulated continuous wave RADAR is not capable of evaluating distance, hence it is primarily used for the evaluation of speed.
the target V such that:
fr =ft
1 +V /C
1−V /C
(2.5)
Therefore the Doppler frequency as defined by Ridenour (1947) is:
fd=fr−ft= 2V
ft
(C−V) (2.6)
An unmodulated continuous wave RADAR is only capable of detecting moving targets. Stationary targets within its line of sight will not cause a Doppler shift. The reflected signal from stationary and slow moving targets is substantially similar to the transmitted signal, in that the Doppler shift is insignificant, and is therefore generally overwhelmed by the transmitted signal and indistinguishable to the receiver.
For passive bistatic RADAR the Doppler equation is defined differently. Brown (2013) showed that the Doppler shift is proportional to the rate of change of bistatic range:
f = 1
C d
dt(RT +RR) (2.7)
where RT andRR can be calculated by:
R= Distance
3×10⁸ (2.8)
2.2.2.2 Frequency Modulated Continuous Wave RADAR
Frequency Modulated Continuous Wave (FMCW) RADAR expands on the initial con-cept of a continuous wave RADAR by allowing target range to be acquired. CW RADAR cannot determine a target’s range as it does not have a timing mark upon which an ac-curate measure of the transmit and receive cycle time can be gauged. Another benefit of an FMCW RADAR is that it is capable of identifying targets that are stationary.
The function of an FMCW RADAR is otherwise similar to that of a standard CW RADAR and in the same way CW RADAR is limited, an FMCW radar is limited in that it can only accurately track a single target at any time. An FMCW RADAR is able to operate from any type of modulated source, this can include an analogue Frequency Modulated (FM) radio transmitter, or any of the more recently introduced digital transmitters such as Digital Broadcast Television, Digital Audio Broadcast Radio, Mobile Telephones, Wi-Fi, and Wi-Max.
The range of a target identified by FMCW RADAR was determined by Faulconbridge (2002) to be calculated as:
R= fb×C 4×∆f×fm
(2.9)
where R is the target range in metres, fb is the beat frequency due to target range in
Hertz, ∆f is the frequency deviation present in the modulation method in Hertz, and
2.2.2.3 Synthetic Aperture RADAR
Synthetic Aperture RADAR (SAR) is generally utilised on moving platforms to simulate a larger antenna aperture. Its function is similar to that of a phased-array antenna, except that instead of utilising a large physical antenna area, a small antenna is used. Successive results are stored and combined to produce a high resolution image of an area. Synthetic aperture RADAR was developed in 1951 by Carl Wiley (Carrara, Goodman & Majewski 1995). The improvement in azimuth resolution and the range resolution of large bandwidth pulses allow the production of SAR images where the reflectivity of the scene is represented by the intensity of each pixel.
There are two common SAR data acquisition modes, map and spotlight. In strip-map mode, the beam location remains constant and observes a strip of area parallel to its movement. Spotlight mode keeps the RADAR beam fixed at the centre of a scene during collection (Gutierrez del Arroyo 2012). Figure 2.5 depicts the spotlight synthetic aperture RADAR collection mode.
Figure 2.5: Spotlight SAR Collection Mode (Gutierrez del Arroyo 2012).
The spotlight method of SAR data acquisition most accurately replicates the opposite of the inverse synthetic aperture RADAR collection method, and is hence further detailed. Monostatic spotlight SAR imaging along the y axis was defined by Gutierrez del Arroyo (2012) as:
ρy =
C
2B (2.10)
and along the x axis as:
ρx= λ
2∆φ (2.11)
where C is the speed of light in metres per second,B is the pulse bandwidth in Hertz,
λis the pulse wavelength in metres, and ∆φ is the azimuth collection in radians. The collected data is compressed or filtered, then subsequently sampled in what is known as fast time samples, being the RADAR image calculation resolution. The transmission time of each pulse defines slow time, the rate at which the acquisition vehicle passes over the collection range.
2.2.2.4 Inverse Synthetic Aperture RADAR
The Synthetic Aperture RADAR (SAR) described in Section 2.2.2.3, is reliant upon the RADAR antenna moving in order to acquire a comparatively stationary target. In order to implement a SAR on a system where the RADAR antenna is stationary relative to the target, it is necessary to use the inverse SAR technique. ISAR is commonly implemented against ships that are moving in three dimensions (roll, pitch, and yaw) on the ocean’s surface, or for tracking aircraft moving across the sky.
Figure 2.6: Comparison between (a) ISAR and (b) SAR techniques (Faulconbridge 2002).
The concept of ISAR was illustrated by Faulconbridge (2002) in Figure 2.6 comparing an ISAR technique with the conventional SAR technique. Faulconbridge (2002) stated that in Figure 2.6 (a), the target rotates by an angleγto provide a relative movement between the RADAR and target. When viewed from the target’s perspective, the movement is equivalent to the movement made by the RADAR from point #1 to point #2, as shown in Figure 2.6 (b). The distance d in metres between points #1 and #2 becomes a function of the angle of rotationγ in radians and the target range R, therefore:
Inverse synthetic aperture RADAR is primarily used in maritime surveillance applica-tions, whereby, an aircraft overflies a region of water repeatedly in order to acquire an accurate picture of the space. ISAR can also be used in terrestrial applications, however, as multiple passes over a target region are required, producing an accurate picture of rapidly moving targets, such as aircraft, is not plausible. ISAR can be used similarly over land as it can water, and is commonly used to produce terrain maps.
More recently, ISAR has been used to produce terrain maps of asteroids in deep space. With appropriate range and velocity data, it is possible to produce an ISAR image of any region or target, hence RTL-SDR dongles will be investigated for their suitability as an ISAR receiver.
2.2.3 Passive Bistatic RADAR
Passive Bistatic RADAR (PBR) is primarily implemented in two distinct ways; Installa-tions where both the transmitter and receiver are controlled, or installaInstalla-tions where the receiver is controlled, and the transmitter is classified using the interchangeable terms of either “opportunistic” or “non-cooperative.” The terms essentially refer to a trans-mitter source that is generally a commercial broadcast, or any other suitable extant transmission in the geographical area of interest.
burden transferred to Digital Signal Processing (DSP).
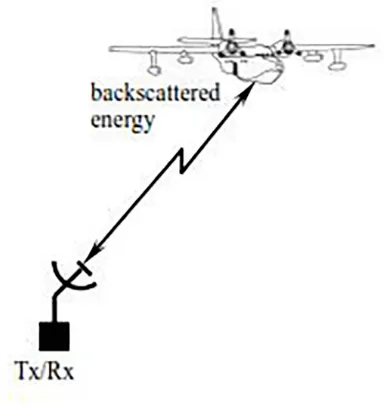
Figure 2.7 shows a functional diagram of the implementation of passive bistatic RADAR. The diagram identifies the requirement for coherent receivers sharing a single clock source, and identifies the relevant signal paths.
Figure 2.7: Passive Bistatic RADAR Functional Diagram.
The signal path and subsequently range from a transmitter to a target and then on to a receiver is defined as:
R=RT +RR (2.13)
where R is the total signal path length, RT is the distance from the transmitter to the
target and RR is the distance from the target to the receiver. Figure 2.8 illustrates the
two-dimensional bistatic ranging concept, where L is the baseline and β is the bistatic angle. In Figure 2.8 any target that is on the ellipse will result in the same range value ofR for a consistent value ofL. As outlined previously, additional receivers are required to determine the direction of the target in conjunction with the range.
The PBR equation, as defined by Willis & Griffiths (2007) was developed in two parts; First, the equation is solved for the bistatic maximum range product:
RM =
p
Figure 2.8: Two-dimensional bistatic RADAR geometry (Gutierrez del Arroyo 2012).
Secondly, Cassinian Ovals, a curve defined as the set of points in a plane such that the product of the distances between two fixed points is constant, are plotted with reference to the baselineL to define the geometric properties of the bistatic RADAR equation in terms of a constant Signal to Noise Ratio (SNR). From this, the maximum and minimum ranges and coverage areas can be calculated as a function of RM.
The PBR range product RM is equivalent to the monostatic RADAR range calculated
in Equation 2.1 and represents the Passive Bistatic RADAR performance as though the receiver and transmitter were co-located. It is therefore useful in comparing the performance of a PBR to a conventional monostatic RADAR. Willis & Griffiths (2007) define the Continuous Wave (CW) form of the bistatic maximum range as:
RM =
"
PTρGTGRtcλ2σBFT2FR2
(4π)3kT
i(S/N)minLTLRLsp
#14
where:
PT Transmitter Average Power
ρ Power Utilisation Factor
GT Transmitter Antenna Gain
GR Receiver Antenna Gain
tc Coherent Processing Interval (CPI) (seconds)
λ Wavelength (Metres)
σB Bistatic RADAR Cross Section (m2)
FT Pattern Propagation Factor (Transmitter to Target)
FR Pattern Propagation Factor (Receiver to Target)
k Boltzman’s Constant (1.38×10⁻²³J ·K−1)
Ti Receiver Input Noise Temperature (K)
(S/N)min SNR required for Detection
LT Transmitter Losses
LR Receiver Losses
Lsp Signal Processing Losses
The pattern propagation factor specified in Equation 2.15 is a term used to describe the wave propagation when free space conditions are not met. This factor is defined separately for the transmitting and receiving paths. The propagation factor also accounts for the RADAR antenna pattern effects (Mahafza 2000). The basic definition of the propagation factor is:
F = E E0 (2.16)
where E is the electric field in the medium and E0 is the free space electric field.
Griffiths (2007) also noted that the derived PBR formula makes use of the Coherent Processing Interval (CPI) instead of the more commonly used Noise Bandwidth Bn, as
it discourages attempts at achieving overly long detection ranges by reducing the Noise Bandwidth. The CPI is generally limited by the Doppler spread:
∆fd=t−c1 =Bn (2.17)
If the bistatic angle is significant, the Doppler spread is related to the radial velocityvr
of the bisector β/2 where Willis & Griffiths (2007) defined the rule of thumb as:
∆fd=
r
vr
λ bistatic (2.18)
This is half of the equivalent monostatic formula:
∆fd=
r 2vr
λ monostatic (2.19)
The performance of a bistatic RADAR is reliant upon the specific geometry of the transmitter, target, and receiver. The general bistatic, pseudo-bistatic and forward scattering geometries are illustrated in Figure 2.9.
Figure 2.9: Three bistatic geometry cases: bistatic (left), psuedomonostatic (centre), and
forward scatter (right). (Gutierrez del Arroyo 2012).
Conversely, where β approaches 180 degrees, the RADAR operation becomes forward scattering, and although cluster scattering coefficients are enhanced, range and Doppler measurements are greatly degraded (Tsao, Weiner, Varshney, Schwarzlander, Slamani & Borek n.d.).
Cassinian Ovals are generally used to illustrate the expected coverage area of a bistatic RADAR based on a modelled detection range. These figures illustrate to a bistatic RADAR designer the expected performance window as a function of the Receiver-Transmitter baseline L. The RADAR Cross Section m2 (RCS), pattern propagation factors, and receiving noise temperatures are assumed within the coverage areas. Ta-ble 2.1 details the range and area calculations for the four general cases as described by Willis & Griffiths (2007).
Condition Area MaxRR MinRR
L = 0 πRm2 Rm Rm
L < 2Rm ≈πR
2
m−(L4)
(64R2
m) q
R2
m + L
2 4 + L 2 q R2
m + L
2
4 −
L
2
L > 2Rm ≈πR2m R2m
L2 L2 −
q
L2
4 − R2m
q
R2
m + L
2
4 −
L
2
L ≥ 3Rm ≈πR2m R2
m
L2 ≈
R2 m L ≈ R2 m L
Table 2.1: Area and Range calculation for the four constant SN R cases (Willis & Griffiths 2007).
Figures 2.10 and 2.11 show the normalised Cassinian Ovals for the four cases described in Table 2.1. The left focus is the receiver shown always at zero, and the right focus is the transmitter. The contours represent the area of coverage around the transmitter and receiver for a particular baseline of lengthL. Gutierrez del Arroyo (2012) noted that for
L/Rm ≥2 the contour does not show a single oval. Targets located between the ovals are
detailed by Simpson (1993).
Figure 2.10: Normalised bistatic RADAR range and coverage areas. L/Rm = 0 (left),
L/Rm= 1 (right) (Gutierrez del Arroyo 2012).
Figure 2.11: Normalised bistatic RADAR range and coverage areas. L/Rm = 2 (left),
For the passive bistatic RADAR transmitters of interest, Bezousek & Schejbal (2008) compiled a table of their typical characteristics, shown at Table 2.2.
Transmitter ERP (kW) Range Resolution (km) Peak Sidelobe Level Range (dB) Doppler (dB) FM Radio 50 1.8→ 16.5 -12 →- 27 -26→ - 46.5
DAB+ 10 1.5 -11.7 -38
DVB-T 10 0.044 -18.5 -34.6
Table 2.2: Transmitters of Opportunity Signal Characteristics.
2.2.4 The Complex Ambiguity Function
The complex ambiguity function forms the main component of passive bistatic RADAR data interpretation. It is used to acquire insight about the usage of different waveforms in RADAR applications. The Complex Ambiguity Function is a 2D function of time delay and Doppler frequency, and is essentially the output of a matched filter, a commonly used RADAR tool used to match the return signal of a monostatic RADAR to a known range or velocity deviation. Matched filters are often used to reduce processing load, as the filter result can be stored as a constant, reducing the processing cycles required for each data window.
from targets. The complex ambiguity function is described as (Ozdemir 2012):
X(τ, f) = Z ∞
−∞
s(t)s∗(t−τ)ei2πf tdt (2.20) in the time domain, and subsequently in the frequency domain as:
A(τ, v) =AXX(v,−τ) =
Z ∞
−∞
S(f)S∗(f +v)e−j2πf τdf (2.21) where S(f) is the Fourier transform of s(t) being the input signal. The time shift τ
represents the delay between the reference and surveillance signal, hence the range of a target can be calculated from this delay. the frequency shift f represents the Doppler shift due to a moving target, or moving receiver, or transmitter, or a combination of all three elements moving at the same time. Where a target is stationary relative to the receiver, the Complex ambiguity function becomes an autocorrelation function of the signal.
2.3
Terrestrial Digital Video Broadcast (DVB-T)
Terrestrial Digital Video Broadcast in Australia conforms to ETSI EN 300 744 V1.6.1, the European digital broadcast standard. The system transmits compressed digital video and digital audio using Coded Orthogonal Frequency Division Multiplexing (OFDM). The operation mode of OFDM is to split digital data into a large number of slower concurrent digital data streams, each of which modulates a set of closely spaced adjacent sub carriers. There are two operational modes that DVB-T can operate under, 2K mode and 8K mode, representing 1,705 or 6,817 subcarriers respectively, that are either 4 kHz or 8 kHz apart. Commonly Australian broadcasters use 7 MHz bandwidth channels, in 8K mode, modulated in 64 Quadrature Amplitude Modulation (QAM).
Generically, OFDM signals carry coded information on multiple subcarriers simultane-ously, with the allocated bandwidth being divided equally into N subcarriers, with each being a harmonic of the lowest frequency in the band, ensuring all are mutually orthogo-nal. The orthogonality allows for close spreading of the data in frequency with minimum interference between them, resulting is a more efficient use of the allocated bandwidth (Gutierrez del Arroyo 2012). The DVB-T standard in 8K mode uses 6,817 subcarriers that are 1 kHz apart.
OFDM waveform generation starts with a randomised set of data bits modulated using Binary Phase Shift Keying (BPSK), Quadrature Phase Shift Keying (QPSK), or in the case of DVB-T, Quadrature Amplitude Modulation (QAM), producing complex data
dn. When not defined by an international standard or convention as is the case with
DVB-T, the signal bandwidth is divided into N subcarriers evenly spaced in frequency by:
∆f = B
N (2.22)
whereN is the number of available subcarriers and the discrete Fourier transform length. The effective signal bandwidth is defined as:
Bef f =
1
Ts
= ∆f (2.23)
Gutierrez del Arroyo (2012) found that eachnthsubcarrier is modulated with the ampli-tude and phase of a particular dataset dn, subsequently, all subcarriers are assembled in
parallel through an inverse discrete Fourier transform operation then transmitted. The time domain signal becomes a sequence of symbols, each a linear superposition of the N-modulated subcarriers. The communication symbol duration is defined by:
Ts=
1
∆f (2.24)
For one (1) communication symbol, the OFDM transmitted signal voltage is modelled in complex form as (Standards Committee 2002):
s(t) =ejω0t
N−1
X
n=0
The use of OFDM non-cooperative transmitters has been researched previously by Gutierrez del Arroyo (2012), Levanon (n.d.), and Levanon & Mozeson (2004). The OFDM waveform is also known as a Multi-Carrier Phase-Coded (MPC) signal, and when used as a PBR transmitter, produces a favourable ambiguity function, complex envelope and spectrum when optimised parameters are used. Levanon’s (n.d.) general expression for the MPC complex envelope is:
g(t) =
N X n=1 M X m=1
ωnan,ms[t−(m−1)tb]e
j2π(n−N+12 t
tb) (2.26)
whereωn is thenth subcarrier complex weight,an,m is themth element of the sequence
subcarrier n (|an,m|= 1, and s(t) ≡1 for 0≤t≤tb and zero elsewhere. The equation
describes a sequence of M consecutive symbols, each with their own modulation set ωn.
2.4
Software Defined Radio
A Software Defined Radio (SDR) is a collection of hardware and software elements in which some or all of the radio’s functions are implemented in software. Some of the common programmable radio elements include:
• Field Programmable Gate Arrays (FPGA);
• Digital Signal Processors (DSP);
• General Purpose Processors (GPP);
• Programmable System on Chip (SoC);
• Other Application Specific Programmable Processors.
2.4.1 Software Defined Radio Software
2.4.1.1 SDR# Software
SDR# (AirSpy 2016) has become the unofficial standard amongst the software defined radio community, as it is windows based, and provides an unobtrusive graphical user interface, allowing new users to access software defined radio functions without needing to understand any programming language. Originally produced as an open source ap-plication, it has since become a closed source (AirSpy 2016). SDR# is based on C++ and is developed for the windows environment, however recent updates have allowed compatibility with Linux and OS X. The primary function of the program is to act as a spectrum analyser, and there are a number of third party plugins that allow greater functionality around the central purpose, however ultimately, the program is limited in what can be achieved.
2.4.1.2 GQRX
GQRX (Csete 2016) is an open source software defined radio receiver. It provides a similar interface to that of SDR# and was originally developed as an alternative that was functional on Linux and Mac OS X systems. GQRX relies on a functional installation of GNU Radio and other dependent applications to operate.
2.4.1.3 MATLAB
and Simulink (Mathworks 2016b). The MATLAB package functions from 22 MHz to 2.2GHz with a sampling frequency range of 225 - 300 kHz or 900 - 2560 kHz. MATLAB interfacing to the RTL-SDR means that all MATLAB functions are able to be carried out on signals received by the RTL-SDR device. The plug-in also provides support for radio addressing, therefore making it suitable for interfacing multiple radio receivers.
2.4.1.4 GNU Radio
GNU Radio (GNURadio 2016a) is an open source development toolkit that provides a block based architecture on which software defined radios and signal processing systems can be built. It can function with or without external hardware, to run as a functional radio, or a testing environment. It is based on Python and C++ code, with its open source nature allowing users to add their own blocks, or modify existing blocks as needed for their purpose. The code blocks produced in GNU Radio Companion produce a python script, where all of the program parameters are stored.
2.4.2 Software Defined Radio Hardware
a number of open hardware platforms have been developed with interface open source SDR software platforms such as SDR# or GNURadio (Wikipedia Contributors 2016). The most common of these hardware platforms as determined by GNURadio (2016b) are identified and detailed below.
2.4.2.1 Ettus Research USRP Devices
Figure 2.13: Ettus Research USRP N200 (Ettus Research 2016a).
USRP N200 Specifications
Use with GNU Radio, LabVIEW and Simulink 2 Gbps Expansion Interface Modular Architecture: DC-6 GHz Spartan 3A-DSP 1800 FPGA (N200)
Dual 100 MS/s, 14-bit ADC 1 MB High-Speed SRAM Dual 400 MS/s, 16-bit DAC Auxiliary Analog and Digital I/O DDC/DUC with 25 MHz Resolution 2.5 ppm TCXO Frequency Reference Up to 50 MS/s Gigabit Ethernet Streaming 0.01 ppm w/ GPSDO Option
Fully-Coherent MIMO Capability Gigabit Ethernet Interface to Host
2.4.2.2 Great Scott Gadgets HackRF
The Great Scott Gadgets HackRF One device functions over an RF range of 1MHz to 6 GHz and was developed as an open source hardware platform, to allow the hobbyist access to SDR. The device has a half duplex transceiver and operates over USB 2.0 unlike the Ettus Research device that operates via Ethernet. This interface presents a disadvantage as it requires the device and processing terminal to be co-located, unlike the USRP devices that can be located with the receive antenna, and away from data processing terminals. The device is powered by the USB bus and therefore requires no external supply. The device is capable of a maximum quadrature sample rate of 20 Msps. Table 2.4 outlines the primary features of the device.
HackRF One Specifications
1 MHz to 6 GHz operating frequency half-duplex transceiver
up to 20 million samples per second 8-bit quadrature samples (8-bit I and 8-bit Q)
compatible with GNU Radio, SDR#, and more
software-configurable RX and TX gain and baseband filter
software-controlled antenna port power (50 mA at 3.3 V)
SMA female antenna connector
SMA female clock input and output for syn-chronisation
convenient buttons for programming
internal pin headers for expansion internal pin headers for expansion
USB-powered open source hardware
Table 2.4: HackRF One Specifications (Great Scott Gadgets 2016).
2.4.2.3 Nuand BladeRF
BladeRF Specifications
Fully bus-powered USB 3.0 SuperSpeed Software Defined Radio
Portable, handheld form factor: 5” by 3.5”
SMA antenna and clock connectors 300MHz - 3.8GHz RF frequency range Independent RX/TX 12-bit 40MSPS
quadrature sampling
Capable of achieving full-duplex 28MHz channels
16-bit DAC factory calibrated 38.4MHz +/-1ppm VCTCXO
On-board 200MHz ARM9 with 512KB embedded SRAM (JTAG port available) On-board 40KLE or 115KLE Altera
Cy-clone 4 E FPGA (JTAG port available)
2x2 MIMO configurable with SMB cable, expandable up to 4x4
Modular expansion board design for adding GPIO, Ethernet, and 1PPS sync signal and expanding frequency range, and power limits
DC power jack for running headless
Highly efficient, low noise power architec-ture
Stable Linux, Windows, Mac and GNU-Radio software support
Hardware capable of operating as a spec-trum analyser, vector signal analyser, and vector signal generator
Table 2.5: BladeRF Specifications (Nuand 2016).
2.4.2.4 RTL-SDR TV Tuners
data in the same manner as a dedicated SDR receiver, allowing it to be utilised as a SDR receiver. The RF tuning range of the RTL-SDR device ranges from 24 MHz to 2200 MHz, although this does vary based upon the tuner chip used, Table 2.6 outlines the tuning range based upon the tuner chipset used.
RTL-SDR Tuner Ranges
Tuner Frequency Range
Elonics E4000 52 - 2200 MHz with a gap from 1100 MHz to 1250 MHz (varies) Rafael Micro R820T 24 - 1766 MHz
Rafael Micro R828D 24 - 1766 MHz
Fitipower FC0013 22 - 1100 MHz (FC0013B/C, FC0013G has a separate L-band input, which is unconnected on most sticks)
Fitipower FC0012 22 - 948.6 MHz
FCI FC2580 146 - 308 MHz and 438 - 924 MHz (gap in between)
Table 2.6: RTL-SDR Tuner Ranges (Osmocom 2016).
The additional functionality of the RTL2832U chipset was discovered by Antti Palosaari (Cass 2013) and further developed by Osmocom to produce functional driver sets. De-vices containing the RTL2832U chipset are commonly available in online stores for under $20.00 AUD (2016) and provide an affordable device for SDR (Osmocom 2016). Unlike the purpose designed SDR dongles, the RTL-SDR provides only an 8-bit quadrature Digital to Analogue Converter (DAC), substantially reducing its bandwidth. The theo-retical maximum sampling rate of the RTL-SDR is 3.2 Msps, however anecdotal testing evidence suggests a practical maximum closer to 2.56 Msps (Osmocom 2016).
imple-mented for SDR the in-phase and quadrature data is passed without any processing at the limited bandwidth of 2.56 MHz, hence the dongle’s ability to process DVB-T signals is severely impaired.
The clock used on the RTL-SDR is a 28.8 MHz crystal oscillator, some hardware devel-opers are producing devices with a Temperature Controlled Crystal Oscillator (TCXO), which have a high quality, or Q factor, representing a low rate of energy loss and a higher quality oscillation. The high quality TCXO components used present limitations with regard to the project scope as they are substantially more expensive than the standard dongles (RTL-SDR.com 2016a). Table 2.7 outlines the product specifications of the RTL-SDR dongles.
Figure 2.16: Typical RTL2832U Based TV Tuner.
RTL-SDR Specifications
Bus Powered USB 2.0 24 - 1766 MHz Frequency Range 8-Bit I/Q DAC Maximum 3.2 Msps Sampling Rate Actual 2.56 Msps Sampling Rate
2.4.3 Coherent Clock Hardware
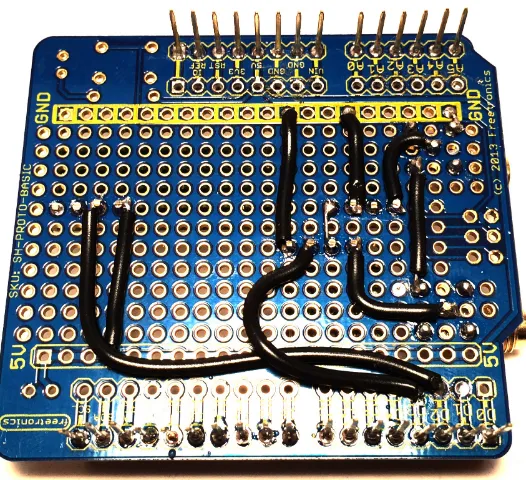
Receiving a Passive Bistatic RADAR (PBR) signal requires multiple hardware receivers to capture an unobstructed reference signal from the transmitter, and a reflected surveil-lance signal from the target. Each of the receivers in use then requires a coherent clock source to provide a timing reference to the received data. The hardware structure for a PBR is shown in Figure 2.7. There are a number of clock generators available from Hewlett-Packard and Tektronix, however, they are extremely expensive and only avail-able in a laboratory environment. Alternatives that were cost appropriate are considered below. The standard circuit diagram of the RTL-SDR clock configuration is shown in Figure 2.17
Figure 2.17: RTL-SDR Clock Config